Supply Chain Carbon Management Software Market Size and Share
Market Overview
| Study Period | 2020 - 2031 |
|---|---|
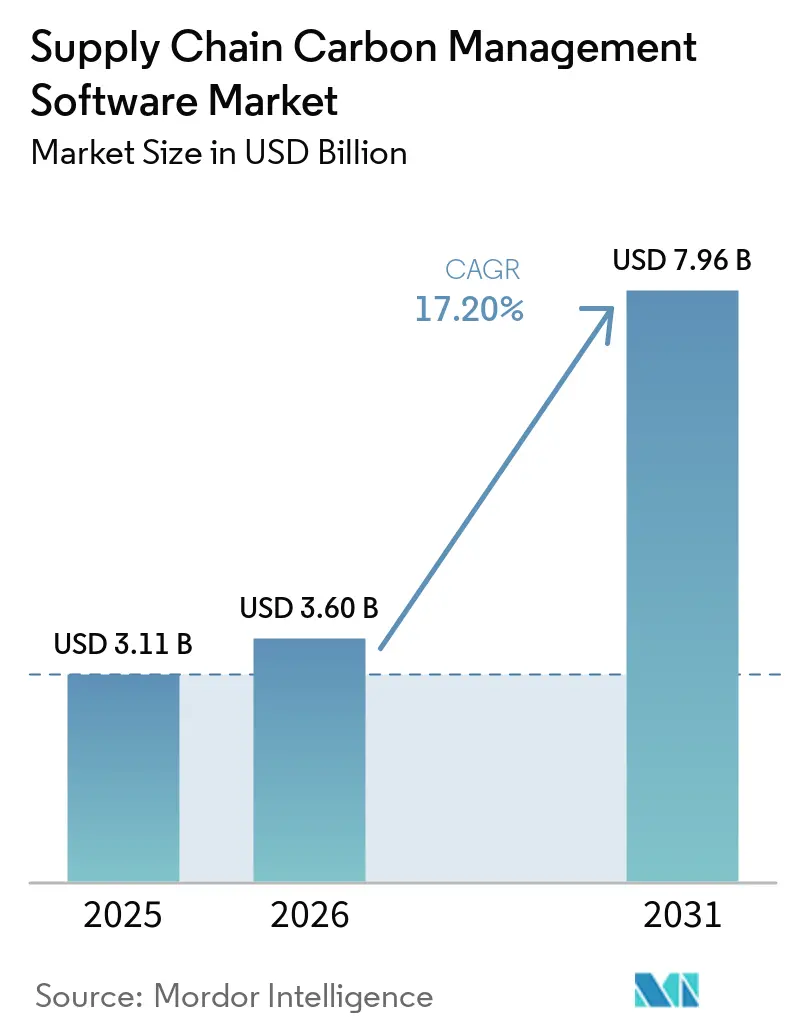
| Market Size (2026) | USD 3.60 Billion |
| Market Size (2031) | USD 7.96 Billion |
| Growth Rate (2026 - 2031) | 17.20% CAGR |
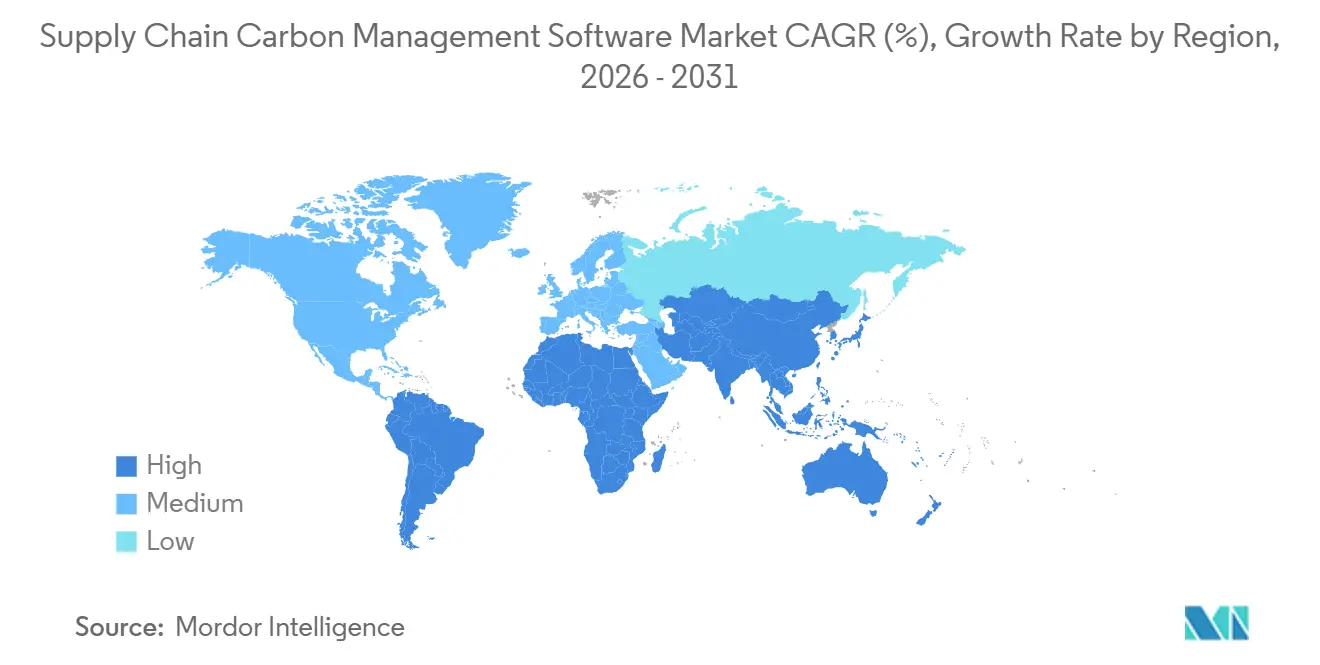
| Fastest Growing Market | Europe |
| Largest Market | Asia-Pacific |
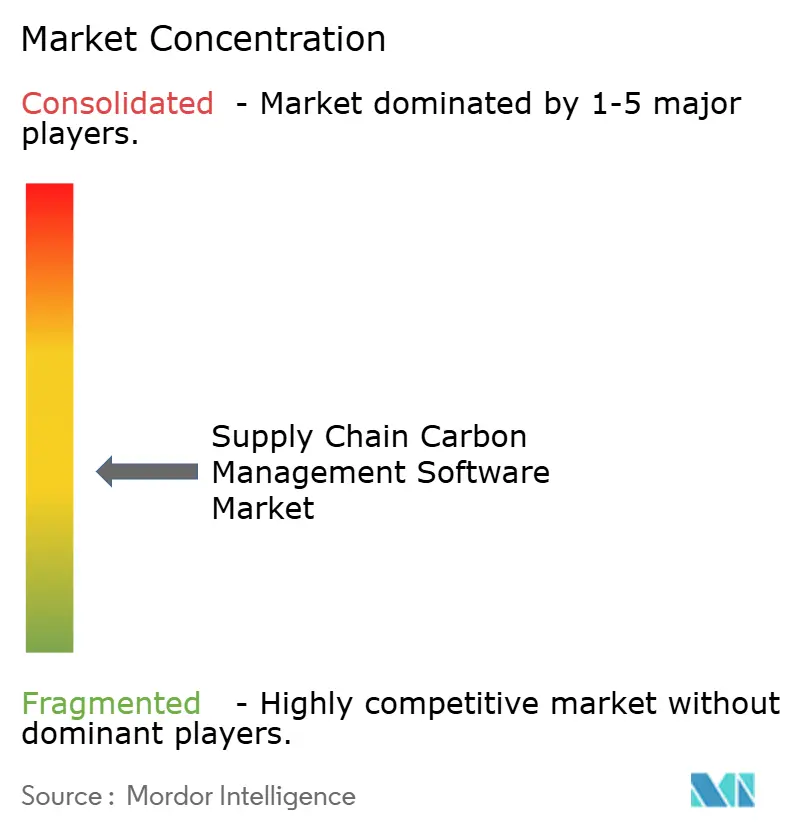
| Market Concentration | Medium |
Major Players *Disclaimer: Major Players sorted in no particular order Image © Mordor Intelligence. Reuse requires attribution under CC BY 4.0. | |
Supply Chain Carbon Management Software Market Analysis by Mordor Intelligence
The Supply Chain Carbon Management Software Market size was valued at USD 3.11 billion in 2025 and estimated to grow from USD 3.60 billion in 2026 to reach USD 7.96 billion by 2031, at a CAGR of 17.20% during the forecast period (2026-2031). The supply chain carbon management software market is moving from early reporting use cases to broader operational use, because large enterprises now need audit-ready emissions data across multi-tier supplier networks. Mandatory disclosure rules in Europe, tighter product-level carbon requirements, and stronger investor attention are pushing software decisions out of evaluation mode and into live buying cycles. The market is also benefiting from a shift in buyer expectations, where companies no longer want a narrow reporting tool but instead seek platforms that connect carbon data with procurement, logistics, finance, and planning systems. This is raising the value of vendors that can combine supplier data collection, emissions calculation, scenario modeling, and workflow automation within a single system. The next phase of growth is likely to come from buyers that already built measurement baselines and now need planning tools, managed services, and supplier engagement capabilities that turn data into action.
Key Report Takeaways
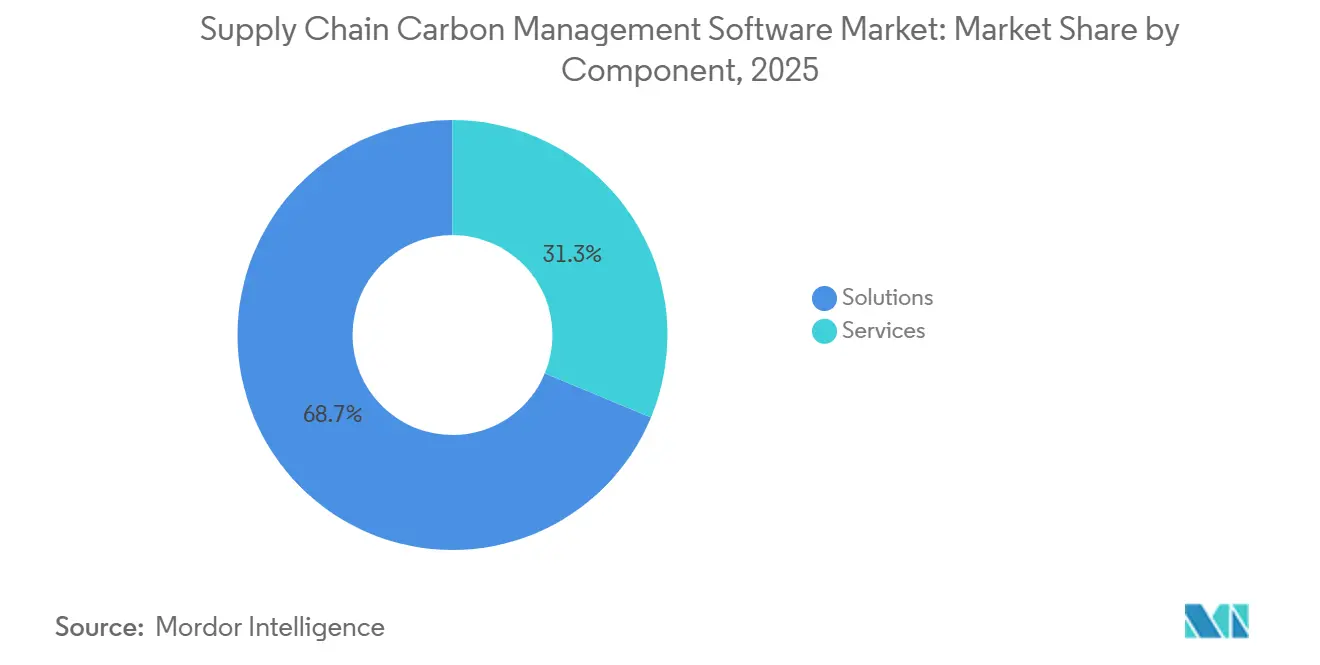
- By component, the supply chain carbon management software market saw solutions lead with 68.74% revenue share in 2025, while services are projected to expand at a 17.65% CAGR through 2031.
- By deployment mode, cloud held 65.12% share in 2025, while hybrid is projected to record the highest CAGR at 17.85% through 2031.
- By enterprise size, large enterprises accounted for 63.45% of the market in 2025, while SMEs are projected to grow fastest at a 17.42% CAGR through 2031.
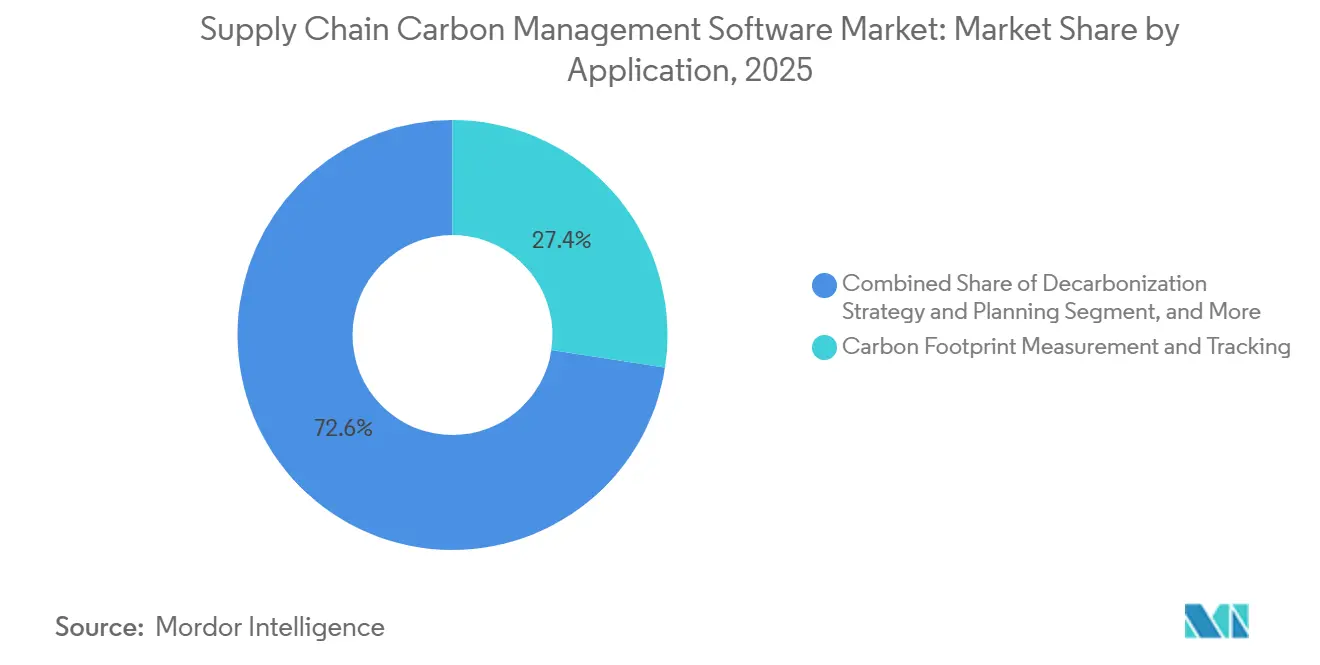
- By application, carbon footprint measurement and tracking captured 27.41% share in 2025, while decarbonization strategy and planning are projected to expand at an 18.05% CAGR through 2031.
- By end-use industry, manufacturing held 28.63% share in 2025, while retail and e-commerce are projected to post the fastest CAGR at 17.92% through 2031.
- By geography, Europe held 34.56% of the supply chain carbon management software market share in 2025, while Asia-Pacific is projected to record the highest CAGR at 18.12% through 2031.
Note: Market size and forecast figures in this report are generated using Mordor Intelligence’s proprietary estimation framework, updated with the latest available data and insights as of January 2026.
Global Supply Chain Carbon Management Software Market Trends and Insights
Drivers Impact Analysis*
| Driver | (~) % Impact on CAGR Forecast | Geographic Relevance | Impact Timeline |
|---|---|---|---|
| Rising Scope 3 Disclosure Pressure Across Global Supply Chains | +4.5% | Global | Short term (≤ 2 years) |
| Adoption of AI-Based Supplier Data Harmonization | +3.2% | Global | Medium term (2-4 years) |
| Digital Product Passport Readiness in Export-Oriented Manufacturing | +2.8% | Europe and Asia-Pacific | Medium term (2-4 years) |
| Procurement-Led Decarbonization Programs in Large Enterprises | +2.0% | North America and Europe | Short term (≤ 2 years) |
| Carbon Credit and Internal Carbon Price Workflow Integration | +1.5% | North America and Europe | Medium term (2-4 years) |
| Embedded Carbon Analytics in ERP and Procurement Suites | +1.2% | Global | Long term (≥ 4 years) |
| Source: Mordor Intelligence | |||
Rising Scope 3 Disclosure Pressure Across Global Supply Chains
The supply chain carbon management software market is seeing strong demand from companies that now need more rigorous Scope 3 disclosures across global supplier networks. The first CSRD filers reported 2024 fiscal-year Scope 3 data in 2025, creating a live benchmark for the level of evidence and repeatability that later filers now need to meet. ESRS E1 kept Scope 3 at the center of climate reporting, meaning companies still need to assess all relevant categories and apply consistent methods year over year.[1]Normative, “Scope 3 Reporting: CSRD and SBTi Requirements (2026),” Normative, normative.io That requirement is difficult to manage in manual files because supplier data comes from many systems, geographies, and reporting formats. California's climate disclosure framework is intensifying the same pressure on U.S.-based multinationals, so the supply chain carbon management software market is no longer being shaped solely by Europe. The result is a faster move toward platforms that can collect supplier data, apply emissions factors, maintain audit trails, and support assurance-ready reporting at scale.
Adoption of AI-Based Supplier Data Harmonization
The supply chain carbon management software market is also expanding because enterprises are struggling less with missing data than with inconsistent data. Supplier emissions records often sit across invoices, product records, life cycle databases, and ERP exports, and each source uses different units, boundaries, and assumptions. That makes harmonization a core software task rather than a supporting feature. In March 2026, EcoVadis and Watershed partnered to combine supplier primary data with automated reliability grading, demonstrating how the market is moving toward confidence scoring and evidence checks rather than simple data intake. In May 2026, EcoVadis expanded the same network through Workiva, further connecting supplier carbon data with reporting workflows that require audit-ready outputs. As a result, the supply chain carbon management software market is rewarding vendors that can rank data quality, detect outliers, and move high-volume supplier inputs into formal assurance processes.[2]EcoVadis, “EcoVadis and Watershed Partner to Close the Scope 3 Data Gap,” EcoVadis, resources.ecovadis.com
Digital Product Passport Readiness in Export-Oriented Manufacturing
The supply chain carbon management software market is gaining a new growth path from digital product passport preparation in export-driven manufacturing. The EU Ecodesign for Sustainable Products Regulation has set in motion a phased rollout of product passports across multiple categories, pushing manufacturers to build product carbon data infrastructure earlier than many domestic rules require. This matters because exporters need more than corporate emissions totals; they need stock-keeping-unit-level product carbon footprint information that can be shared across value chains. Automotive, electronics, metals, and industrial goods suppliers are particularly exposed because their products flow through deep supply chains and into tightly regulated export destinations. The supply chain carbon management software market is therefore seeing greater demand for modules that support product-level calculations, documentation control, and supplier traceability, rather than only enterprise-wide reporting. That shift is making specialized product carbon footprint functionality more important in software selection, especially for manufacturers serving European buyers.[3]EU Digital Product Passport Tracker, “Digital Product Passport Delegated Acts Tracker,” EU Digital Product Passport Tracker, eudigitalproductpassport.org
Procurement-Led Decarbonization Programs in Large Enterprises
The supply chain carbon management software market is also being supported by procurement teams that now use carbon data in daily sourcing decisions. Large enterprises are no longer treating decarbonization as a separate sustainability task that happens after purchasing and operations are complete. They are bringing supplier carbon scores into sourcing workflows so that price, quality, and emissions can be reviewed together. SAP's Green Ledger and its wider ERP-linked sustainability capabilities show how vendors are positioning around this operational use case, where carbon data is written into finance and procurement systems rather than stored in a separate reporting layer. That model matters for the supply chain carbon management software market because buyers want systems that influence sourcing, production planning, and supplier choices in real time. It also favors vendors that can reduce integration friction and show a direct line from emissions data to commercial decisions.
Restraints Impact Analysis*
| Restraint | (~) % Impact on CAGR Forecast | Geographic Relevance | Impact Timeline |
|---|---|---|---|
| High Supplier Data Gaps and Poor Emissions Factor Quality | -2.8% | Global | Medium term (2-4 years) |
| Integration Burden with Legacy ERP, TMS, and MES Systems | -2.1% | Global | Medium term (2-4 years) |
| Audit-Grade Cybersecurity and Data Privacy Concerns | -1.2% | Europe and North America | Medium term (2-4 years) |
| Budget Sensitivity Among Mid-Market and SME Buyers | -0.8% | Global | Short term (≤ 2 years) |
| Source: Mordor Intelligence | |||
High Supplier Data Gaps and Poor Emissions Factor Quality
The biggest practical constraint in the supply chain carbon management software market remains supplier data quality. Many enterprises still rely on secondary estimates because suppliers do not provide complete primary emissions data, or they do so in formats that cannot be easily verified. That weakens reporting quality and also limits the value of downstream planning tools. The challenge becomes harder when generic emissions factors do not reflect site-level or country-level conditions, which can materially distort carbon baselines for global supply chains. SAP addressed part of this issue in its 2026 updates by adding more country-specific factors for agricultural and industrial commodities, indicating that buyer demand for geographic granularity is growing. Until supplier participation improves and emissions factor libraries become more precise, the supply chain carbon management software market will continue to face slower adoption among companies with fragmented sourcing networks.[4]SAP Community, “SAP Sustainability Footprint Management: Q1-26 Updates and Highlights,” SAP Community, community.sap.com
Integration Burden With Legacy ERP, TMS, And MES Systems
The supply chain carbon management software market also faces slower adoption where core enterprise systems are old, highly customized, or poorly standardized. Carbon calculations depend on operational inputs from ERP, transport, manufacturing, and procurement systems, and many companies lack clean data flows across those environments. This raises project cost, lengthens deployment timelines, and increases the risk that buyers delay purchases until integration becomes easier. Research noted that companies often struggle not only with technical interfaces, but also with weak information infrastructure and low data standardization in the systems that feed emissions reporting. The problem is especially acute in large enterprises with complex on-premises systems and in mid-sized firms without dedicated integration teams. For that reason, the supply chain carbon management software market is placing growing value on API-ready platforms, prebuilt connectors, and ERP-native architectures that reduce deployment friction.
*Our forecasts treat driver/restraint impacts as directional, not additive. The impact forecasts reflect baseline growth, mix effects, and variable interactions.
Segment Analysis
By Component: Services Gain Momentum As Scope 3 Complexity Deepens
Solutions accounted for 68.74% of 2025 revenue in the supply chain carbon management software market, with software licenses remaining the largest component of spending. That lead reflected early enterprise buying patterns, in which companies first secured the core platform needed for emissions measurement, supplier data capture, and reporting controls. Buyers also preferred solutions because they established a common data model that could later support assurance, planning, and product-level analysis. In the early build-out stage of the supply chain carbon management software industry, this platform-first approach made sense because large enterprises needed a stable system before adding external advisory support. The solutions segment also benefited from SaaS delivery, which enabled companies to onboard faster and update their systems more easily across distributed supplier networks.
The services segment is projected to expand at a 17.65% CAGR through 2031, which makes it the fastest-growing component. That rise shows that many enterprises have moved past the first step of buying software and now need help using it across complex supplier ecosystems. CSRD assurance workflows, supplier outreach, data cleaning, and emissions factor matching are all work-intensive tasks that internal teams often cannot absorb. The ERM and Carbmee partnership reflects this shift by combining software capabilities with service-led execution to drive Scope 3 reduction work in manufacturing value chains. The supply chain carbon management software market is therefore moving toward a model in which services extend beyond setup to include continuous data management, supplier engagement, and decarbonization follow-through. That pattern strengthens vendors and partners that can support long implementation cycles and deliver measurable outcomes after the initial deployment is complete.


By Deployment Mode: Hybrid Architecture Balances Control And Scalability
Cloud deployment accounted for 65.12% of 2025 revenue in the supply chain carbon management software market, making it the dominant delivery model. Cloud platforms gained early market share by enabling automated data ingestion from procurement, finance, and logistics systems without the need for extensive internal infrastructure. They also meet the needs of sustainability teams that want faster setup, lower upfront costs, and easier expansion across supplier networks. For many mid-sized adopters, cloud systems reduced the burden of maintaining internal servers while supporting live reporting needs. Cloud leadership in the supply chain carbon management software market also reflects how quickly regulatory and reporting requirements evolve, because buyers value frequent updates and easier feature rollouts.
Hybrid deployment is projected to grow at a 17.85% CAGR through 2031, which makes it the fastest-growing mode. This growth comes from enterprises that need cloud-scale connectivity but still must keep sensitive supplier or operational data within controlled regional environments. That requirement is particularly relevant in Europe, where data governance and residency expectations shape system design choices. SAP's footprint management architecture demonstrates this direction, as companies can calculate carbon data in cloud environments and publish results back to on-premises systems when needed. On-premises deployments still hold a role in defense, government, and tightly regulated supply chains, but they are less aligned with the need for fast supplier onboarding and continuous updates. As a result, the supply chain carbon management software market is increasingly favoring hybrid models that combine compliance control with practical scalability.
By Enterprise Size: SMEs Expand Faster As Compliance Pressure Moves Downstream
Large enterprises accounted for 63.45% of 2025 revenue in the supply chain carbon management software market, making them the core buyer group. Their lead reflected larger budgets, broader supplier footprints, and direct exposure to formal reporting obligations such as CSRD and related Scope 3 requirements. These companies had the scale to invest in full-platform deployments, system integration, and supplier engagement programs before smaller firms entered the space. They also created the first large demand wave in the supply chain carbon management software industry by turning emissions measurement into a structured enterprise process. Because many operate across several regions and thousands of suppliers, they needed robust data governance earlier than the rest of the market.
SMEs are projected to grow at a 17.42% CAGR through 2031, making them the fastest-growing segment of the enterprise market. This growth is being driven less by direct regulation and more by customer mandates from larger buyers that now need supplier-level primary data. Many smaller firms are being pulled into carbon reporting because they supply companies that already face disclosure, CBAM, or decarbonization requirements. Persistent barriers for SMEs include tool complexity, language constraints, and high implementation costs, which explains why adoption still depends on simpler software and clearer onboarding support. Stocktake findings also showed that SMEs using digital carbon tools were more likely to have formal reporting systems and better access to green finance, suggesting that software adoption has a financial logic beyond compliance alone. For the supply chain carbon management software market, this means the next adoption wave may come from smaller suppliers that need affordable tools, guided workflows, and direct links to customer reporting requests.
By Application: Planning Tools Gain Ground Beyond Measurement
Carbon footprint measurement and tracking accounted for 27.41% of 2025 application revenue in the supply chain carbon management software market, making it the largest application layer. That position reflects the simple fact that companies must establish a baseline before they can report, compare suppliers, or plan reductions. Measurement tools are usually the first to enter because they organize activity data, map emissions factors, and create a repeatable calculation engine. They also serve as the foundation for later modules, such as supplier engagement, climate risk review, and product carbon footprint analysis. In practical terms, the supply chain carbon management software market still begins with measurement because no broader decarbonization workflow can function without reliable baseline data.
Decarbonization strategy and planning is projected to grow at a 18.05% CAGR through 2031, making it the fastest-growing application. This shift shows that buyers are under pressure to move from emissions inventories to reduction road maps that can be defended with numbers. Boards, investors, and regulators now expect more than disclosure, and software vendors are responding by adding scenario analysis, target planning, and reduction pathway tools. SAP's Footprint Optimization Agent shows this direction because it can simulate emissions outcomes across products, plants, and supply chains in much less time than older approaches. Product carbon footprint assessment, supplier engagement, and emissions reporting remain important adjacent applications, especially in manufacturing and retail, where supply chain transparency is moving closer to product-level use. The supply chain carbon management software market is therefore shifting from a reporting-centered stack toward a wider planning and execution stack that supports operational decisions.

By End-Use Industry: Manufacturing Leads While Retail And E-Commerce Accelerate
Manufacturing accounted for 28.63% of 2025 end-use revenue in the supply chain carbon management software market, making it the largest vertical. Manufacturers face some of the hardest carbon data challenges because they source physical inputs from many tiers, countries, and production sites. That complexity is intensified by CBAM verification needs, Scope 3 Category 1 disclosures, and growing demand for product-level carbon visibility. Manufacturing buyers also need systems that can connect procurement, plant operations, and product data rather than producing only corporate emissions totals. As a result, manufacturing held the largest share of the supply chain carbon management software market size in 2025 because it faces the highest urgency for multi-tier traceability and product carbon management.
Retail and e-commerce are projected to expand at a 17.92% CAGR through 2031, making it the fastest-growing vertical. Large retailers are pushing supplier transparency deeper into onboarding and sourcing processes, especially where private-label products and broad vendor networks create Scope 3 visibility challenges. These companies also face growing pressure to support product-level carbon communication and cleaner assortment planning. Transportation and logistics, energy and utilities, food and beverage, IT and telecom, BFSI, construction and infrastructure, and government and public sector also form important demand pools, each with its own reporting trigger and data model. The HowGood and Sweep integration highlights how food and beverage buyers are gaining access to large datasets on product carbon footprints within broader sustainability workflows. Across these end users, the supply chain carbon management software market is expanding fastest, as supplier visibility, product footprint requirements, and operational decision-making converge within a single software environment.
Geography Analysis
Europe held a 34.56% revenue share in 2025, making it the leading position in the supply chain carbon management software market. The region moved furthest from policy planning to live implementation because large companies have already completed full Scope 3 reporting cycles under CSRD-linked requirements. The supply chain carbon management software market also benefits in Europe from the combined effect of CSRD, the EU Emissions Trading System, CBAM, and product passport preparation, which together create both corporate and product-level data needs. Germany stands out because its automotive and industrial supply chains face high exposure to both product carbon footprint demands and deep supplier data collection requirements. France and the Netherlands also remain important demand centers due to reporting adoption, import-export activity, and a high concentration of large enterprises.
North America represented the second-largest regional market, supported by U.S. multinationals, California disclosure mandates, and strong voluntary target-setting among large companies. Buyers in the United States continue to invest because they need systems that can support enterprise-wide emissions accounting across complex domestic and overseas supplier networks. Canada adds a similar need through carbon pricing and cross-border customer reporting requirements, which favor software with multi-jurisdiction reporting logic. South America remains at the forefront of adoption, but Brazil is building momentum as corporate sustainability expectations rise and green finance activity drives structured emissions reporting.
Asia-Pacific is projected to post the fastest CAGR of 18.12% through 2031, making it the strongest growth region in the supply chain carbon management software market. The region is being shaped by domestic climate policies and by export-linked compliance needs from customers in Europe and North America. China is pushing Scope 3 and enterprise carbon data higher on the agenda through its dual-carbon goals and the broader evolution of its emissions trading framework. India is adding momentum through the Energy Conservation framework, the Carbon Credit Trading Scheme, and BRSR Core expectations for listed companies. Japan supports premium demand through GX funding, sustainability guidance, and listed-company disclosure pressure, while the Middle East and Africa are beginning to see earlier traction through enterprise decarbonization efforts tied to Saudi Vision 2030, UAE Net Zero 2050, and carbon policy development in South Africa and Nigeria.

Competitive Landscape
The supply chain carbon management software market is moderately fragmented, with competition split between large enterprise platform vendors and specialist carbon software providers. The first group includes broad technology and enterprise software names such as IBM, SAP, Microsoft, Schneider Electric, Salesforce, Workiva, Wolters Kluwer, Cority, and Sphera. The second group includes supply chain-focused specialists such as Watershed, Persefoni AI, Greenly, Sweep, Carbmee, SINAI Technologies, Plan A, and Carbon Direct. This structure means buyers often compare deep integration and platform breadth against speed, specialization, and faster feature development. It also means the market remains active on both partnership building and targeted acquisition.
Recent moves show that vendors are strengthening their positions through ecosystem expansion and selective consolidation. EcoVadis linked its Carbon Data Network with Watershed in March 2026 and with Workiva in May 2026, thereby strengthening the flow of supplier primary data into broader reporting and assurance workflows. Green Project Technologies acquired the Emitwise platform in July 2025, adding automated product carbon footprint and supplier engagement capabilities to its existing offering. Makersite’s acquisition of Siemens’ SiGREEN platform, effective June 1, 2026, showed that specialist operators are gaining relevance in product carbon footprint and supply chain data exchange. SAP also expanded its sustainability functionality in 2026 with new AI agents, reinforcing the value of ERP-linked emissions planning and simulation.
Competition is increasingly centered on three themes: AI-based data harmonization, ERP-native embedding, and interoperable partner networks. Vendors that can validate supplier data, reduce integration work, and support product-level carbon workflows are improving their position on the shortlist. Standards and exchange frameworks are also becoming increasingly important as automotive and industrial buyers seek software that can move data across shared supply chain ecosystems. Cority’s 2026 leader recognition showed that buyers still value workflow design, granular permissions, and large emissions factor libraries alongside newer AI features. ENGIE SA is less relevant as a core peer set name because it is primarily an energy utility rather than a dedicated software vendor, while Emitwise no longer operated as a standalone market participant after its platform sale to Green Project Technologies in July 2025. In practical terms, the market is rewarding vendors that can combine trusted data infrastructure, strong partner ecosystems, and operational usability across procurement, reporting, and planning.
Supply Chain Carbon Management Software Industry Leaders
IBM Corporation
SAP SE
Microsoft Corporation
Schneider Electric SE
Salesforce, Inc.
- *Disclaimer: Major Players sorted in no particular order

Recent Industry Developments
- June 2026: SAP was named a Leader for the second time in the IDC MarketScape: Worldwide Carbon Accounting and Management Applications 2026 Vendor Assessment (April 2026), recognized for its ERP-embedded approach that unifies financial, operational, and sustainability data under a single governance framework.
- May 2026: SAP announced new sustainability AI agents at Sapphire 2026 on May 15, 2026, including the Footprint Optimization Agent, which aggregates Scope 1, 2, and 3 data across products, plants, and supply chains, reducing carbon scenario simulation time from approximately 1 day to 20 minutes. General availability of the full AI agent suite is planned for the end of 2026, marking a significant expansion of capabilities for SAP's supply chain sustainability platform.
- May 2026: EcoVadis and Workiva announced a strategic partnership on May 12, 2026, integrating EcoVadis' primary supplier carbon data from its Carbon Data Network directly into Workiva's AI-powered reporting platform. The partnership enables mutual enterprise customers to replace industry-average estimates with verified, supplier-specific Scope 3 data for audit-ready execution within CSRD and CDP reporting workflows.
- May 2026: IBM announced the general availability of the Envizi Emissions API on April 28, 2026, enabling organizations, developers, and software providers to embed GHG Protocol-aligned emissions calculations directly into existing systems, workflows, and products. The API extends Envizi's managed emissions factor data to third-party applications, broadening the platform's ecosystem reach beyond standalone enterprise deployments.


Global Supply Chain Carbon Management Software Market Report Scope
The Supply Chain Carbon Management Software market comprises platforms and services that enable organizations to measure, monitor, and reduce carbon emissions across their supply chains. These solutions provide functionalities such as carbon accounting and emissions tracking, supplier ESG and sustainability performance management, transparency and disclosure reporting, and advanced analytics for forecasting and scenario modeling. By embedding carbon intelligence into procurement, logistics, and supplier management workflows, these platforms help enterprises comply with ESG regulations, enhance supply chain resilience, and align with global decarbonization goals.
The Supply Chain Carbon Management Software market report is segmented by Offering (Software, and Services), Deployment Model (Cloud, On-Premises, and Hybrid), Enterprise Size (Large Enterprises, and Small and Medium Enterprises), Application (Carbon Accounting and Emissions Tracking, Supplier ESG and Sustainability Management, Supply Chain Transparency and Reporting, and Forecasting and Scenario Analysis), End-Use Industry (IT and Telecom, BFSI, Industrial Manufacturing, Energy and Utilities, Oil and Gas, Retail and E-Commerce, Food and Beverage Manufacturing, Construction and Infrastructure, Government and Public Sector, and Other End-User Industries), and Geography (North America, South America, Europe, Asia-Pacific, Middle East, and Africa). The Market Forecasts are Provided in Terms of Value (USD).
| Solutions |
| Services |
| Cloud |
| On-Premises |
| Hybrid |
| Large Enterprises |
| Small And Medium Enterprises |
| Carbon Footprint Measurement and Tracking |
| Emissions Reporting and Compliance |
| Supplier Engagement and Data Collection |
| Product Carbon Footprint Assessment |
| Climate Risk Analysis |
| Decarbonization Strategy and Planning |
| Manufacturing |
| Retail and E-Commerce |
| Transportation and Logistics |
| Energy and Utilities |
| Food and Beverage |
| IT and Telecom |
| BFSI |
| Construction and Infrastructure |
| Government and Public Sector |
| Other End-user Industries |
| North America | United States | |
| Canada | ||
| Mexico | ||
| South America | Brazil | |
| Argentina | ||
| Rest of South America | ||
| Europe | Germany | |
| United Kingdom | ||
| France | ||
| Italy | ||
| Spain | ||
| Russia | ||
| Rest of Europe | ||
| Asia-Pacific | China | |
| India | ||
| Japan | ||
| South Korea | ||
| Australia | ||
| Rest of Asia-Pacific | ||
| Middle East and Africa | Middle East | Saudi Arabia |
| United Arab Emirates | ||
| Rest of Middle East | ||
| Africa | South Africa | |
| Nigeria | ||
| Rest of Africa | ||
| By Component | Solutions | ||
| Services | |||
| By Deployment Mode | Cloud | ||
| On-Premises | |||
| Hybrid | |||
| By Enterprise Size | Large Enterprises | ||
| Small And Medium Enterprises | |||
| By Application | Carbon Footprint Measurement and Tracking | ||
| Emissions Reporting and Compliance | |||
| Supplier Engagement and Data Collection | |||
| Product Carbon Footprint Assessment | |||
| Climate Risk Analysis | |||
| Decarbonization Strategy and Planning | |||
| By End-Use Industry | Manufacturing | ||
| Retail and E-Commerce | |||
| Transportation and Logistics | |||
| Energy and Utilities | |||
| Food and Beverage | |||
| IT and Telecom | |||
| BFSI | |||
| Construction and Infrastructure | |||
| Government and Public Sector | |||
| Other End-user Industries | |||
| By Geography | North America | United States | |
| Canada | |||
| Mexico | |||
| South America | Brazil | ||
| Argentina | |||
| Rest of South America | |||
| Europe | Germany | ||
| United Kingdom | |||
| France | |||
| Italy | |||
| Spain | |||
| Russia | |||
| Rest of Europe | |||
| Asia-Pacific | China | ||
| India | |||
| Japan | |||
| South Korea | |||
| Australia | |||
| Rest of Asia-Pacific | |||
| Middle East and Africa | Middle East | Saudi Arabia | |
| United Arab Emirates | |||
| Rest of Middle East | |||
| Africa | South Africa | ||
| Nigeria | |||
| Rest of Africa | |||


Key Questions Answered in the Report
What is the current and forecast value of the supply chain carbon management software market?
The supply chain carbon management software market was valued at USD 3.11 billion in 2025, is estimated at USD 3.60 billion in 2026, and is forecast to reach USD 7.96 billion by 2031 at a 17.20% CAGR.
Which region currently leads revenue generation?
Europe led with 34.56% share in 2025, supported by CSRD reporting requirements, CBAM readiness, and earlier enterprise software deployment across regulated supply chains.
Which region is growing the fastest through 2031?
Asia-Pacific is projected to grow at an 18.12% CAGR through 2031, driven by export-linked compliance pressure and expanding climate disclosure frameworks in China, India, and Japan.
Which application area is expanding the fastest?
Decarbonization strategy and planning is projected to post the fastest growth at 18.05% CAGR, showing that buyers are moving beyond measurement toward scenario planning and reduction execution.
Why does manufacturing remain the largest end-use vertical?
Manufacturing held 28.63% share in 2025 because it faces the deepest supplier networks, stronger product carbon footprint needs, and higher compliance exposure under CBAM and Scope 3 reporting rules.
What is changing buying behavior among smaller suppliers?
SMEs are projected to grow at 17.42% CAGR as large enterprise customers push carbon data requirements down the supply chain and smaller firms adopt simpler digital tools to meet those requests.
Page last updated on:


