
Carbon-Aware Application Development Platform Market Size and Share
Market Overview
| Study Period | 2020 - 2031 |
|---|---|
| Market Size (2026) | USD 1.03 Billion |
| Market Size (2031) | USD 3.26 Billion |
| Growth Rate (2026 - 2031) | 25.91 % |
| Fastest Growing Market | Asia-Pacific |
| Largest Market | Europe |
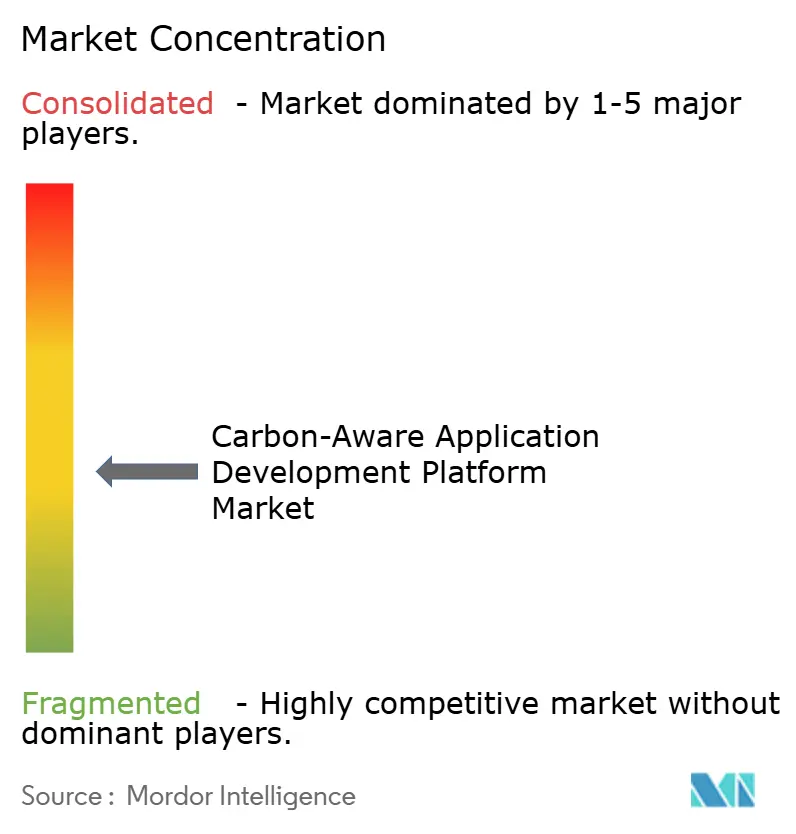
| Market Concentration | Medium |
Major Players *Disclaimer: Major Players sorted in no particular order Image © Mordor Intelligence. Reuse requires attribution under CC BY 4.0. | |
Carbon-Aware Application Development Platform Market Analysis by Mordor Intelligence
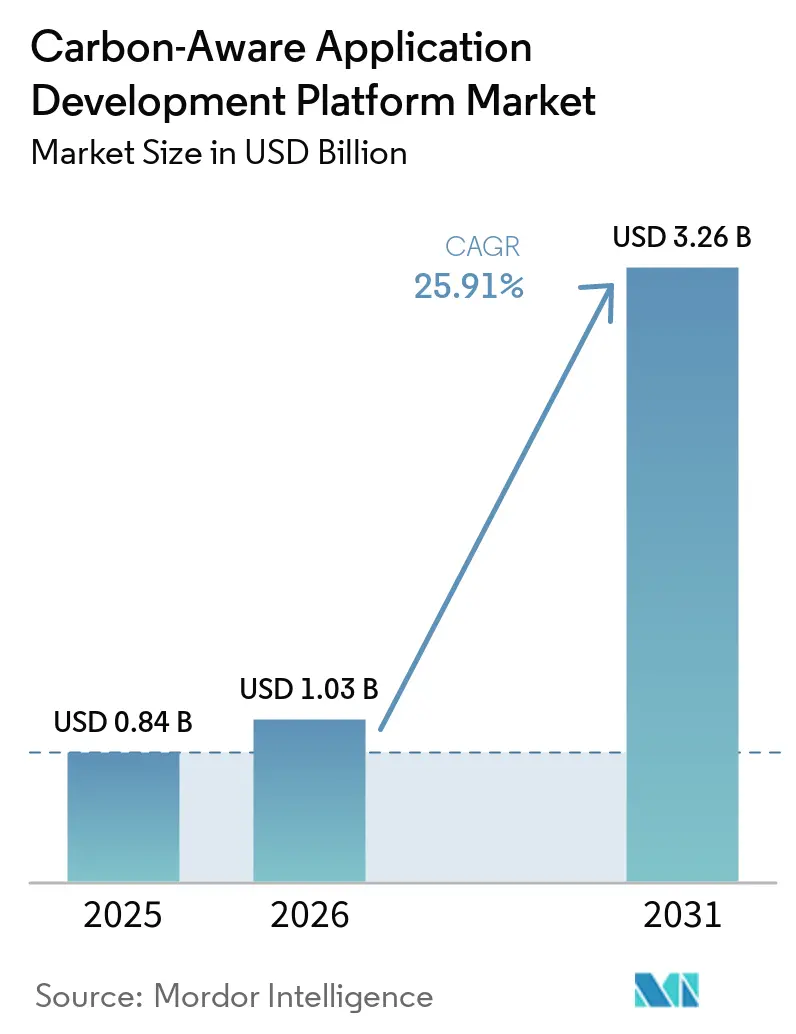
The Carbon-Aware Application Development Platform Market size is projected to be USD 0.84 billion in 2025, USD 1.03 billion in 2026, and reach USD 3.26 billion by 2031, growing at a CAGR of 25.9% from 2026 to 2031. At USD 1.03 billion in 2026, the market marks the point where workload-level carbon accounting moves from pilot programs into mainstream enterprise practice. Growth is supported by auditable sustainability reporting requirements, the rising carbon footprint of AI infrastructure, and the wider adoption of FinOps methods that now track carbon alongside cloud spending. The International Energy Agency reported that global data center electricity consumption rose by 17% in 2025, while the combined capital expenditure of 5 large technology companies exceeded USD 400 billion in 2025 and is projected to rise by a further 75% in 2026. These pressures are pulling the Carbon-Aware Application Development Platform Market toward the center of enterprise cloud operations, regulatory reporting, and AI efficiency planning. Competitive activity is also rising as hyperscalers deepen embedded carbon tooling, specialist API providers expand their developer ecosystems, and sovereign AI programs in Europe, Japan, and India make carbon accountability an operating requirement.
Key Report Takeaways
- By component, Platform held 72.1% share in 2025, while Services is forecast to grow at 26.5% CAGR through 2031.
- By deployment mode, Cloud accounted for 67.3% of the Carbon-Aware Application Development Platform market in 2025, while Hybrid is projected to grow at a 26.9% CAGR through 2031.
- By enterprise size, Large Enterprises held 65.4% share in 2025, while SMEs are expected to grow at 27.1% CAGR through 2031.
- By application, Carbon Measurement, Monitoring, and Forecasting led with 29.8% share in 2025, while Carbon-Aware Workload Optimization is forecast to expand at 27.6% CAGR through 2031.
- By end-use industry, IT and Telecom held 26.7% share in 2025, while Retail and E-Commerce are projected to grow at 27% CAGR through 2031.
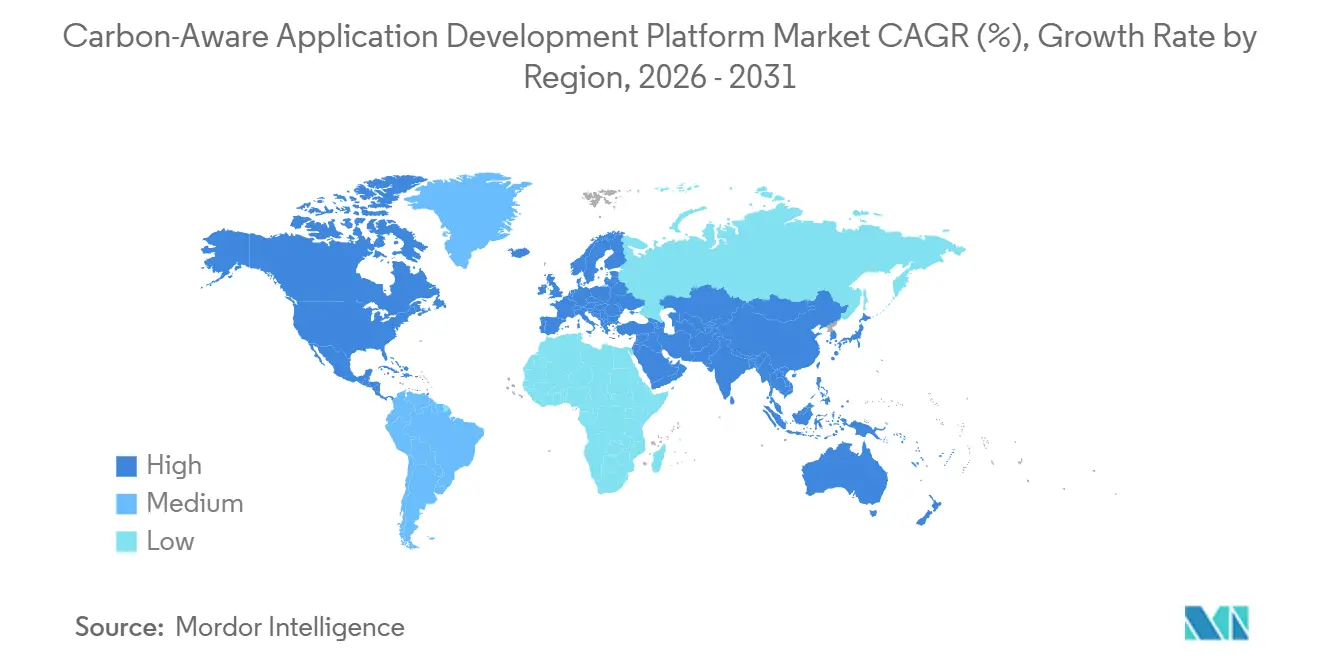
- By geography, Europe held 34.9% of the Carbon-Aware Application Development Platform market share in 2025, while Asia-Pacific is forecast to grow at 27.9% CAGR through 2031.
Note: Market size and forecast figures in this report are generated using Mordor Intelligence’s proprietary estimation framework, updated with the latest available data and insights as of January 2026.
Market Trends and Insights
Drivers Impact Analysis of Carbon-Aware Application Development Platform Market*
| Driver | (~) % Impact on CAGR Forecast | Geographic Relevance | Impact Timeline |
|---|---|---|---|
| Rising Enterprise Demand for Carbon-Optimized Software Execution | +5.2% | Global | Short term (≤ 2 years) |
| Regulatory Push for Auditable Digital Sustainability Controls | +4.8% | Europe and North America, With Spill-Over to APAC | Medium term (2-4 years) |
| Growth of AI and High-Density Compute Workloads | +4.1% | Global, Led by North America and APAC | Short term (≤ 2 years) |
| FinOps and GreenOps Convergence in Cloud Operations | +3.5% | North America and Europe | Medium term (2-4 years) |
| Shift Toward Real-Time Carbon Intensity APIs and Scheduling | +2.8% | Global | Short term (≤ 2 years) |
| Expansion of ESG-Linked Procurement and Product Development Standards | +2.3% | Europe, APAC Core, Spill-Over to North America | Long term (≥ 4 years) |
| Source: Mordor Intelligence | |||
Rising Enterprise Demand for Carbon-Optimized Software Execution
Enterprise demand for carbon-optimized software execution is rising because sustainability targets now affect budgets and operating decisions, not just corporate messaging. The FinOps Foundation reported that 53% of European FinOps practices were reporting cloud carbon metrics in 2025, up 18 percentage points year over year, while North America remained at 29%. That gap gives vendors in the Carbon-Aware Application Development Platform Market a clear opening to sell tools that turn carbon tracking into a standard part of cloud management. Enterprises are also finding that carbon-aware scheduling can expose idle capacity and waste that cost-only rightsizing programs do not always catch. The ISO/IEC 21031:2024 Software Carbon Intensity specification provided buyers with a formal way to convert software emissions work into repeatable, auditable scores, making internal approval easier for finance and legal teams.
Regulatory Push for Auditable Digital Sustainability Controls
The first mandatory reporting phase of the EU CSRD applied in 2025 to large listed companies and required greenhouse gas disclosure under ESRS E1 with third-party assurance. The U.S. Securities and Exchange Commission also adopted climate disclosure rules in March 2024 with phased Scope 1 and Scope 2 reporting for public companies beginning with Large Accelerated Filers in 2025. Even though these rules do not expressly require software-level carbon-intensity data, auditors are increasingly requesting workload-level evidence to support reported emissions values. That demand shifts carbon-aware tooling from a voluntary ESG purchase into a control layer that helps enterprises defend reported numbers. The Carbon-Aware Application Development Platform Market is benefiting from that shift, as traceable data collection, reporting logic, and evidence trails are becoming increasingly important in procurement decisions.[1]
Growth of AI and High-Density Compute Workloads
The International Energy Agency projected in April 2025 that global data center electricity consumption will reach 945 terawatt-hours by 2030. The same report stated that electricity use from AI-focused data centers will triple over the period. It also noted that the 5 largest technology companies spent more than USD 400 billion on data center-related capital expenditure in 2025 and are expected to lift that figure by 75% in 2026. These conditions strengthen the Carbon-Aware Application Development Platform Market because AI teams have a direct incentive to shift training, analytics, and replication jobs into cleaner, cheaper grid windows. Google reported that its Ironwood TPU delivered a 3.7x improvement in Compute Carbon Intensity compared with its predecessor, demonstrating that hardware efficiency and carbon-aware scheduling are becoming complementary levers in enterprise AI operations.[2]
FinOps and GreenOps Convergence in Cloud Operations
FinOps and GreenOps are converging as enterprises embed carbon performance into day-to-day cloud operations. The FinOps Foundation's 2025 work showed that carbon metrics were already being incorporated into cloud management routines, especially in Europe, where reporting adoption was much higher than in North America. Hyperscalers are supporting that shift by placing emissions data inside existing management layers, as seen in Microsoft Azure Carbon Optimization and the AWS Sustainability Console. This operating model benefits the Carbon-Aware Application Development Platform Market because enterprises can justify carbon tooling as part of cloud governance rather than treating it as a stand-alone ESG purchase. It also explains why services are expanding quickly, since many organizations need outside help to connect cloud data, development workflows, and reporting controls across mixed environments.[3]
Restraints Impact Analysis of Carbon-Aware Application Development Platform Market*
| Restraint | (~) % Impact on CAGR Forecast | Geographic Relevance | Impact Timeline |
|---|---|---|---|
| Limited Standardization Across Carbon Data Providers | -2.1% | Global | Medium term (2-4 years) |
| High Integration Complexity with Legacy DevOps and Cloud Stacks | -1.8% | North America and Europe | Medium term (2-4 years) |
| Data Quality Gaps in Workload-Level Emissions Measurement | -1.4% | Global | Short term (≤ 2 years) |
| Budget Scrutiny for Non-Core Sustainability Software Spend | -1.0% | North America and APAC | Short term (≤ 2 years) |
| Source: Mordor Intelligence | |||
Limited Standardization Across Carbon Data Providers
Limited standardization across carbon data providers remains one of the clearest barriers in the Carbon-Aware Application Development Platform Market. Electricity Maps reported in January 2025 that average flow-traced and marginal emissions factors showed very low statistical correlation across 65 global grids. That means a workload optimized for one signal can perform worse when evaluated under another. The SCI framework provided software teams with a way to calculate carbon intensity, but it did not prescribe a single grid emissions signal, leaving enterprises to decide on methodology on a case-by-case basis. Until regulators or standards bodies close that gap, buyers face the risk of having to rework data models, controls, and integrations later to meet audit expectations.[4]
High Integration Complexity with Legacy DevOps and Cloud Stacks
High integration complexity with legacy DevOps and cloud stacks is a second major restraint on adoption. Many enterprise CI/CD environments were built without carbon telemetry hooks, so emissions data is often added via custom connectors, middleware, or external adapters. That work competes directly with product delivery schedules and core engineering priorities. The burden is heavier in enterprises that run a mix of on-premises infrastructure, private clouds, and multiple public clouds, because the reporting logic must span very different control layers. This makes pre-integrated bundles, managed services, and cloud-native APIs more attractive in the Carbon-Aware Application Development Platform Market, especially for organizations without dedicated sustainability engineering teams.
*Our forecasts treat driver/restraint impacts as directional, not additive. The impact forecasts reflect baseline growth, mix effects, and variable interactions.
Carbon-Aware Application Development Platform Market Segment Analysis
By Component:
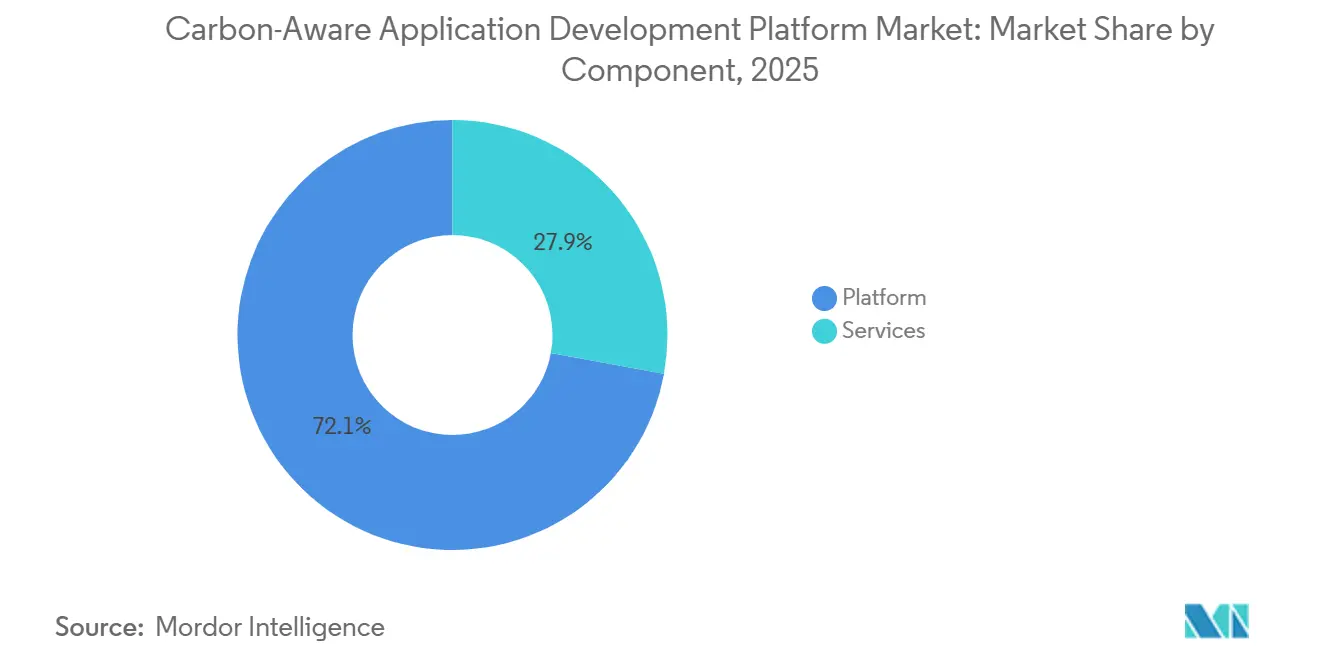
Platform Anchors Revenue While Services AcceleratePlatform held a 72.1% share of the Carbon-Aware Application Development Platform Market in 2025, making it the revenue anchor for the component mix. That lead reflects enterprise spending on measurement engines, emissions APIs, SCI scoring tools, and CI/CD reporting plugins that form the base layer for carbon-aware development. Adoption has moved furthest in technology and financial services organizations that have already completed baseline greenhouse gas inventories and now need developer tooling for routine use. The Carbon Aware SDK, maintained by the Green Software Foundation, shows the breadth of the integration surface that commercial vendors are packaging for enterprise deployment.
Services are forecast to grow at a 26.5% CAGR through 2031, making it the fastest-growing component of the Carbon-Aware Application Development Platform Market. That pattern reflects a familiar enterprise buying path where advisory, implementation, and managed operations rise quickly before in-house carbon tooling skills become common. Enterprises still need help setting boundaries, mapping activity data, connecting software delivery systems, and building reporting controls that stand up in audit settings. The balance between platform revenue and services growth suggests that software alone is not enough, and that execution support will remain important as adoption broadens across the Carbon-Aware Application Development Platform Market.
By Deployment Mode:
Cloud Dominates, Hybrid InflectsCloud held 67.3% of the Carbon-Aware Application Development Platform market in 2025, making it the dominant deployment model by a wide margin. The lead came from the fact that the most usable carbon signals, such as grid carbon intensity feeds, dashboards, and scheduler integrations, are easiest to access in public cloud environments. Microsoft Azure Carbon Optimization, the AWS Sustainability Console, and Google's carbon-intelligent computing tools all place carbon data close to where engineering teams already manage workloads. That proximity lowers adoption friction because teams can view emissions and cost data in the same operating context.
Hybrid is projected to expand at a 26.9% CAGR through 2031, making it the fastest-growing deployment mode. Regulated sectors such as banking, utilities, and government still run major workloads on-premises and need a single reporting view across both private and public infrastructure. That need is pushing buyers toward architectures that bridge legacy compute, new AI environments, and cloud-native telemetry. On-premises remains the smallest segment, but it remains relevant for enterprises that build private AI capacity under direct carbon audit obligations or compute sovereignty rules.
By Enterprise Size:
Large Enterprises Define the Base and SMEs Expand the FrontierLarge Enterprises held 65.4% of the Carbon-Aware Application Development Platform market share in 2025, underscoring the continued demand from organizations with larger cloud estates and greater regulatory exposure. These buyers usually have the scale to fund dedicated sustainability engineering work, and the internal controls needed to justify deeper instrumentation. Financial institutions stand out within this group because workload-level emissions data can support broader greenhouse gas inventories and climate disclosure programs. The Carbon-Aware Application Development Platform Market, therefore, continues to rely on large enterprise contracts as its primary revenue source.
SMEs are forecast to grow at a 27.1% CAGR through 2031, making them the fastest-expanding enterprise size band. Growth is being supported by supplier reporting pressure emanating from larger customers, especially as disclosure obligations expand across the value chain. Newer carbon platforms also fit smaller teams better because API-first delivery allows them to plug carbon intelligence into existing tools without adopting a full sustainability suite. As a result, the Carbon-Aware Application Development Platform Market is expanding from a compliance-led, large-enterprise base into a more distributed buyer set.
By Application:
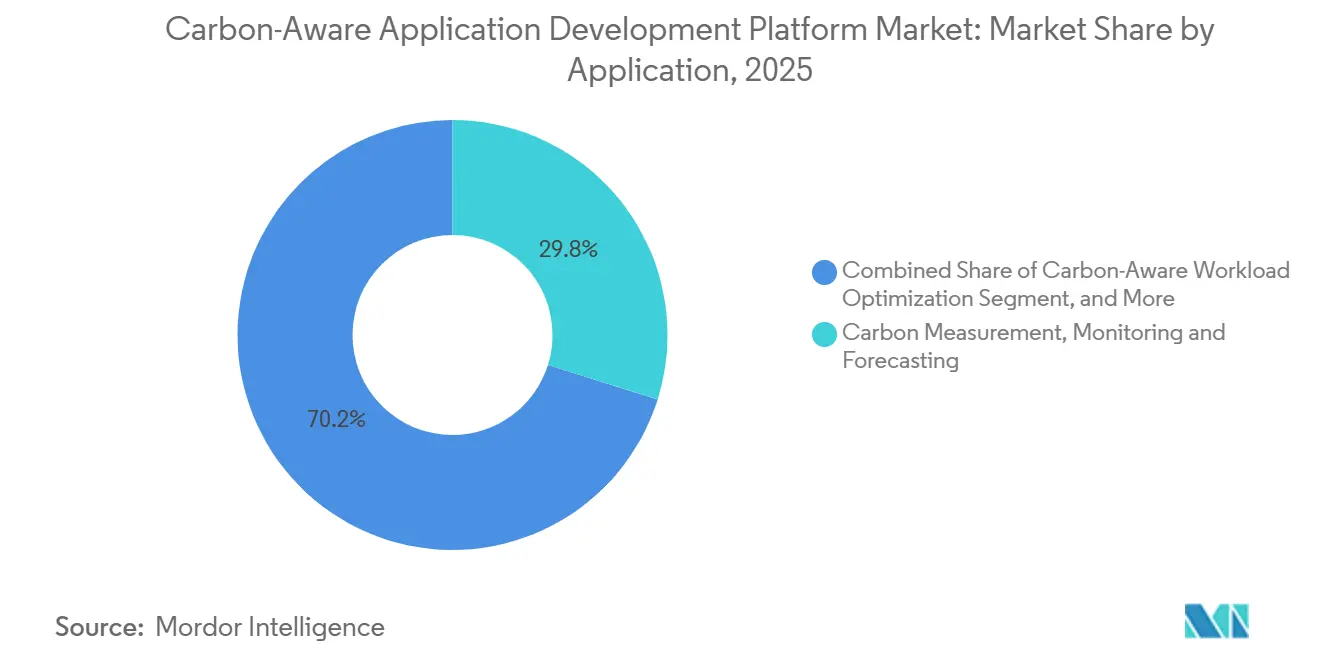
Carbon Measurement Anchors Revenue, Workload Optimization AcceleratesCarbon Measurement, Monitoring, and Forecasting accounted for 29.8% of the market in 2025, making it the largest application area. That ranking aligns with a market that is still measurement-first, where enterprises want reliable baselines before moving to active scheduling or automated control. SAP Green Ledger and Salesforce Agentforce for Net Zero show how measurement is moving closer to financial reporting and enterprise workflow systems. These products connect software emissions data to cost centers, disclosures, and operating controls, helping move the Carbon-Aware Application Development Platform Market from experimentation to routine governance.
Carbon-Aware Workload Optimization is projected to grow at a 27.6% CAGR through 2031, making it the fastest-growing application. Enterprises that already have baseline measurement data are now moving toward active scheduling for AI training, batch analytics, and replication tasks. Carbon-Aware Development and SDLC Management, along with Decision Intelligence and Automation, are also expanding as teams begin to embed carbon metrics into development velocity and observability workflows. Governance, Reporting, and Compliance is maturing quickly as more vendors add framework-specific reporting builders for CSRD, GRI, and SEC reporting requirements.

By End-Use Industry:
IT and Telecom Leads, Retail and E-Commerce DisruptsIT and Telecom held a 26.7% share in 2025, making it the largest end-use industry in the Carbon-Aware Application Development Platform Market. The sector sits closest to the underlying digital infrastructure where software-driven carbon emissions are created and managed. Telecom operators also have a direct financial incentive to optimize, as energy costs can represent a significant share of operating expenses. That combination of infrastructure ownership and cost pressure has kept IT and Telecom at the front of adoption.
BFSI and Industrial Manufacturing were already meaningful adopters because they need stronger reporting controls and closer links between software activity and broader carbon accounting. Energy and Utilities, Oil and Gas, and Government and Public Sector are entering a mid-cycle phase in which modernization programs are creating new digital carbon-reporting needs. Retail and E-Commerce is forecast to grow at a 27% CAGR through 2031, making it the fastest-growing end-use industry. That pace reflects the scale of cloud-native commerce infrastructure and the growing use of sustainability clauses in business procurement, which is turning digital carbon performance into a commercial differentiator.
Geography Analysis
Europe Carbon-Aware Application Development Platform Market
Europe held a 34.9% share in 2025, making it the largest regional contributor to the Carbon-Aware Application Development Platform Market. The region benefits from a strong reporting framework built around the CSRD and ESRS E1 requirements. Those rules made greenhouse gas disclosure more detailed and more auditable for in-scope companies, which raised the value of workload-level evidence and traceable reporting logic. Germany also supported developer capacity building through its 2025 Green Coding workshop series. The Green Software Foundation later mapped the SCI framework to CSRD support needs, providing procurement teams with a clearer bridge between software engineering practices and formal reporting expectations.
The Americas Carbon-Aware Application Development Platform Market
North America held the second-largest share in the Carbon-Aware Application Development Platform Market because the region combines strong AI infrastructure investment with an active climate disclosure environment. The U.S. Securities and Exchange Commission's phased disclosure framework increased the need for better emissions evidence, while large technology and financial services firms already had the scale to operationalize carbon-aware tooling. Canada and Mexico remain earlier-stage markets, but supplier linkages with U.S. enterprises are widening the adoption base. South America, led by Brazil, is still smaller, yet early demand is emerging as supply chain decarbonization and reporting obligations become more important.
APAC and MEA Carbon-Aware Application Development Platform Market
Asia-Pacific is forecast to grow at a 27.9% CAGR through 2031, making it the fastest-growing region. Japan is a major growth center because METI published the first Watt-Bit Collaboration report in June 2025, and the country's updated Energy Conservation Act framework will begin applying to qualifying data centers in 2026. China also added momentum through its August 2025 technical standard for cloud service customer carbon emission accounting, which created a domestic model for calculation and disclosure. The Middle East and Africa remain early-stage markets, but long-term potential is improving as net-zero commitments and investor-led ESG requirements begin to shape digital infrastructure procurement.
Competitive Landscape
The Carbon-Aware Application Development Platform Market has a split structure, with several strong groups rather than a single dominant vendor. Hyperscalers and enterprise software incumbents such as Microsoft, Amazon Web Services, Google, SAP, Salesforce, ServiceNow, and Oracle capture a large share of enterprise attention because they can embed carbon tools into existing cloud and ERP relationships. A second group, including Electricity Maps, WattTime, Normative.io, Cycloid, and Workiva, competes through specialist APIs, measurement methods, and developer-focused product design. Large systems integrators form a third lane by combining platform configuration, training, and ongoing operations into managed GreenOps services. This structure keeps competition active across the Carbon-Aware Application Development Platform Market because distribution power, data quality, workflow fit, and implementation support all matter simultaneously.
The strongest white space remains in edge inference attribution, cross-cloud carbon budgeting without vendor lock-in, and carbon-aware scheduling for IoT and distributed infrastructure. Electricity Maps and WattTime continue to matter because carbon-aware products still depend on trusted external grid signals. WattTime's Automated Emissions Reduction technology reached more than 1 billion deployed devices by October 2025, demonstrating the scale specialist data providers can achieve even without controlling the full software stack. At the same time, the Carbon-Aware Application Development Platform Market still leaves room for vendors that embed carbon intelligence directly into developer tools rather than requiring teams to work through a separate ESG interface.
Several company moves in 2026 show how leading vendors are extending control over adjacent workflows. SAP's Q2 2026 Green Ledger Analytical Dashboard update added project-level carbon and financial analysis by Work Breakdown Structure element, deepening carbon accounting within ERP-based project management. Microsoft's April 2026 Sustainability Manager release added EcoVadis supplier integration, custom emission factor mappings, and allocation profiles, which widened its reach into supply chain-linked carbon accounting. Amazon Web Services also launched the AWS Sustainability Console in March 2026, with programmatic API access and Scope 1, 2, and 3 reporting, strengthening its position with cloud-native teams that want emissions data integrated into daily operating tools.
Carbon-Aware Application Development Platform Industry Leaders
-
Microsoft Corporation
-
Amazon Web Services, Inc.
-
Google LLC
-
Workiva Inc.
-
SAP SE
- *Disclaimer: Major Players sorted in no particular order
Carbon-Aware Application Development Platform Market Companies Covered in this Report
- Electricity Maps ApS
- WattTime, Inc.
- Normative.io Ltd
- Cycloid SAS
- Workiva Inc.
- SAP SE
- Microsoft Corporation
- Amazon Web Services, Inc.
- Google LLC
- IBM Corporation
- Salesforce, Inc.
- ServiceNow, Inc.
- Oracle Corporation
- Schneider Electric SE
- ENGIE SA
- Siemens AG
- Dassault Systèmes SE
- Accenture plc
- Capgemini SE
- HCL Technologies Limited
- Tata Consultancy Services Limited
Recent Industry Developments in Carbon-Aware Application Development Platform Market
- May 2026: AP SE released version 1.5.1 of the SAP Green Ledger Analytical Dashboard on May 18, 2026, adding project-level carbon and financial analysis by Work Breakdown Structure element. The update enables enterprises to assign carbon costs to individual software development projects within SAP S/4HANA, establishing the first ERP-native bridge between project management carbon accounting and greenhouse gas inventory disclosures.
- April 2026: Microsoft Corporation released Microsoft Sustainability Manager version 2.34 in April 2026, adding EcoVadis supplier integration, custom emission factor mappings, and allocation profiles in public preview. The update extends enterprise carbon accounting to supply chain partners, enabling organizations to correlate supplier emissions data with workload-level carbon attribution within Azure-managed environments.
- March 2026: Amazon Web Services launched the AWS Sustainability Console on March 31, 2026, as a standalone service providing Scope 1, 2, and 3 emissions reporting at no additional cost, with programmatic API access, configurable CSV exports, and dual market-based and location-based methodology outputs. The AWS Customer Carbon Footprint Tool was simultaneously deprecated in favor of this expanded service.
- March 2026: WattTime released updated North America carbon intensity data models on March 4, 2026, covering CO2 marginal operating emissions rate and health damage signals with more than 2 years of back-filled data. The update improves the precision of real-time carbon-aware scheduling decisions for enterprises using WattTime-integrated scheduling tools.
Global Carbon-Aware Application Development Platform Market Report Scope
The Carbon-Aware Application Development Platform market refers to platforms and services that embed sustainability intelligence into the software development lifecycle (SDLC) and application operations. These solutions provide capabilities such as carbon-aware development and SDLC management, workload optimization, carbon measurement, monitoring and forecasting, governance and compliance reporting, and decision intelligence with automation. By integrating carbon-awareness into application design, deployment, and runtime management, these platforms enable organizations to reduce energy consumption, optimize resource utilization, and align IT operations with ESG and decarbonization goals.
The Carbon-Aware Application Development Platform market report is segmented by Component (Platform and Services), Deployment Mode (Cloud, On-Premises, and Hybrid), Enterprise Size (Large Enterprises, and Small and Medium Enterprises), Application (Carbon-Aware Development and SDLC Management, Carbon-Aware Workload Optimization, Carbon Measurement, Monitoring and Forecasting, Governance, Reporting and Compliance, Decision Intelligence and Automation), End-Use Industry (IT and Telecom, BFSI, Industrial Manufacturing, Energy and Utilities, Oil and Gas, Retail and E-Commerce, Food and Beverage Manufacturing, Transportation and Logistics, Construction and Infrastructure, Government and Public Sector, and Other End-User Industries), and Geography (North America, South America, Europe, Asia-Pacific, Middle East, and Africa). The Market Forecasts are Provided in Terms of Value (USD).
Segmentation Overview
| Platform |
| Services |
| Cloud |
| On-Premises |
| Hybrid |
| Large Enterprises |
| Small and Medium Enterprises |
| Carbon-Aware Development and SDLC Management |
| Carbon-Aware Workload Optimization |
| Carbon Measurement, Monitoring and Forecasting |
| Governance, Reporting and Compliance |
| Decision Intelligence and Automation |
| IT and Telecom |
| BFSI |
| Industrial Manufacturing |
| Energy and Utilities |
| Oil and Gas |
| Retail and E-Commerce |
| Food and Beverage Manufacturing |
| Transportation and Logistics |
| Construction and Infrastructure |
| Government and Public Sector |
| Other End-User Industries |
| North America | United States |
| Canada | |
| Mexico | |
| South America | Brazil |
| Rest of South America | |
| Europe | Germany |
| United Kingdom | |
| France | |
| Italy | |
| Spain | |
| Russia | |
| Rest of Europe | |
| Asia-Pacific | China |
| India | |
| Japan | |
| South Korea | |
| Australia | |
| Rest of Asia-Pacific | |
| Middle East | Turkey |
| Saudi Arabia | |
| United Arab Emirates | |
| Rest of Middle East | |
| Africa | South Africa |
| Nigeria | |
| Rest of Africa |
| By Component | Platform | |
| Services | ||
| By Deployment Mode | Cloud | |
| On-Premises | ||
| Hybrid | ||
| By Enterprise Size | Large Enterprises | |
| Small and Medium Enterprises | ||
| By Application | Carbon-Aware Development and SDLC Management | |
| Carbon-Aware Workload Optimization | ||
| Carbon Measurement, Monitoring and Forecasting | ||
| Governance, Reporting and Compliance | ||
| Decision Intelligence and Automation | ||
| By End-Use Industry | IT and Telecom | |
| BFSI | ||
| Industrial Manufacturing | ||
| Energy and Utilities | ||
| Oil and Gas | ||
| Retail and E-Commerce | ||
| Food and Beverage Manufacturing | ||
| Transportation and Logistics | ||
| Construction and Infrastructure | ||
| Government and Public Sector | ||
| Other End-User Industries | ||
| By Geography | North America | United States |
| Canada | ||
| Mexico | ||
| South America | Brazil | |
| Rest of South America | ||
| Europe | Germany | |
| United Kingdom | ||
| France | ||
| Italy | ||
| Spain | ||
| Russia | ||
| Rest of Europe | ||
| Asia-Pacific | China | |
| India | ||
| Japan | ||
| South Korea | ||
| Australia | ||
| Rest of Asia-Pacific | ||
| Middle East | Turkey | |
| Saudi Arabia | ||
| United Arab Emirates | ||
| Rest of Middle East | ||
| Africa | South Africa | |
| Nigeria | ||
| Rest of Africa | ||
Key Questions Answered in the Report
What is the expected value of the Carbon-Aware Application Development Platform Market by 2031?
The Carbon-Aware Application Development Platform Market is forecast to reach USD 3.26 billion by 2031, rising from USD 1.03 billion in 2026 at a 25.9% CAGR.
Why is demand increasing for carbon-aware application development platforms?
Demand is rising because enterprises need auditable emissions data, AI workloads are increasing electricity use, and cloud teams now manage carbon closer to cost and performance.
Which region leads current adoption of carbon-aware development platforms?
Europe led in 2025 with a 34.9% share, supported by CSRD and ESRS reporting requirements that increased the need for traceable digital emissions data.
Which application area is expanding the fastest in this space?
Carbon-Aware Workload Optimization is the fastest-growing application, with a 27.6% CAGR through 2031, as enterprises move from passive monitoring to active scheduling.
Why do large enterprises still account for most spending?
Large Enterprises held 65.4% share in 2025 because they face stronger disclosure pressure, run larger compute estates, and can fund dedicated sustainability engineering programs.
What is the biggest challenge for buyers evaluating carbon-aware platforms?
Methodology differences across carbon data providers and the difficulty of integrating telemetry into legacy DevOps and cloud stacks remain the most important adoption barriers.