
Sustainable Procurement and Supplier Carbon Scoring Software Market Size and Share
Market Overview
| Study Period | 2020 - 2031 |
|---|---|
| Market Size (2026) | USD 3.48 Billion |
| Market Size (2031) | USD 7.06 Billion |
| Growth Rate (2026 - 2031) | 15.23 % |
| Fastest Growing Market | Asia-Pacific |
| Largest Market | Europe |
| Market Concentration | Low |
Major Players *Disclaimer: Major Players sorted in no particular order Image © Mordor Intelligence. Reuse requires attribution under CC BY 4.0. | |
Sustainable Procurement and Supplier Carbon Scoring Software Market Analysis by Mordor Intelligence
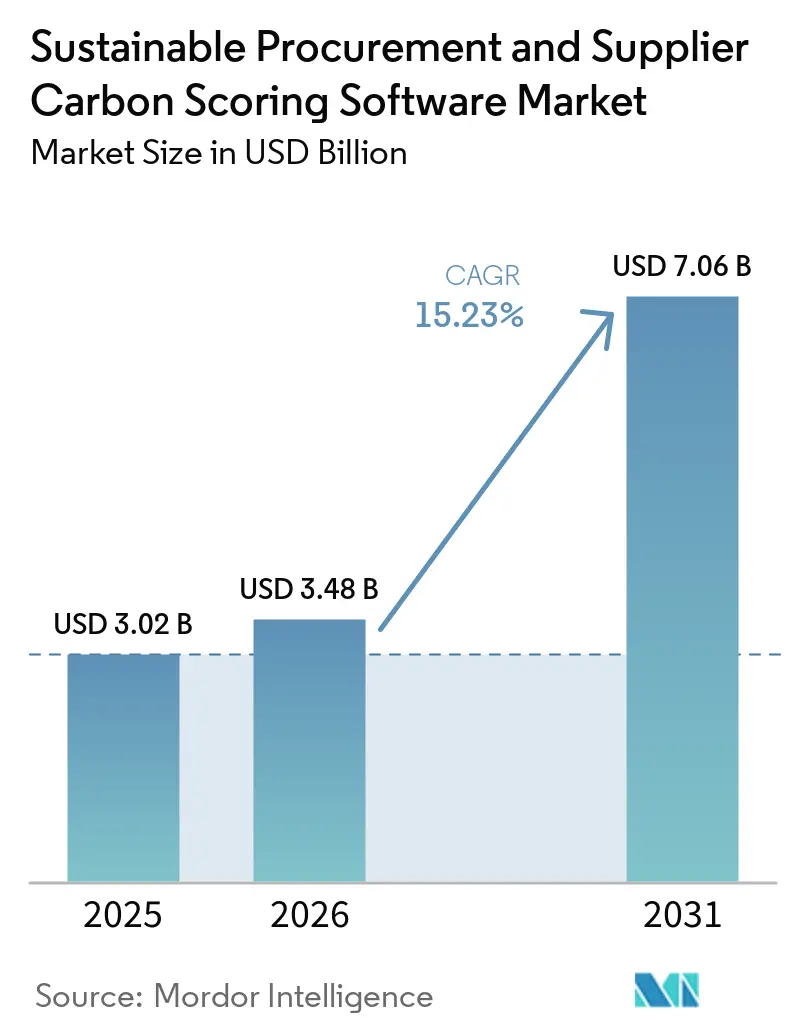
The Sustainable Procurement and Supplier Carbon Scoring Software Market size was valued at USD 3.02 billion in 2025 and estimated to grow from USD 3.48 billion in 2026 to reach USD 7.06 billion by 2031, at a CAGR of 15.23% during the forecast period (2026-2031). The sustainable procurement and supplier carbon scoring software market is moving into a compliance-led phase, as procurement teams now need supplier emissions records to support formal disclosure and assurance work. The sustainable procurement and supplier carbon scoring software market is also benefiting from a shift in budget ownership, as carbon data collection is increasingly handled within procurement workflows rather than remaining the purview of sustainability teams. Demand is rising most where companies manage wide supplier bases, frequent sourcing cycles, and large Scope 3 exposure, which makes supplier scoring useful for both reporting and supplier selection. The sustainable procurement and supplier carbon scoring software market is creating space for vendors that can combine supplier onboarding, data quality controls, and audit-ready reporting in a single system. Competition is also intensifying as large enterprise software vendors embed sustainability functions into existing procurement and ERP systems, while specialist platforms leverage supplier network depth and faster product updates to defend their position.
Key Report Takeaways
- By function, supplier carbon scoring and benchmarking held 41.45% of the sustainable procurement and supplier carbon scoring software market share in 2025, while supplier carbon data collection is projected to expand at a 16.77% CAGR through 2031.
- By deployment, cloud-based delivery accounted for 72.11% of the sustainable procurement and supplier carbon scoring software market size in 2025 and is expected to grow at a 17.45% CAGR through 2031.
- By organization size, large enterprises held 68.35% share in 2025, while SMEs are projected to expand at a 17.02% CAGR through 2031.
- By end-user industry, manufacturing accounted for 20.12% share in 2025, while retail and consumer goods are projected to grow at a 15.81% CAGR through 2031.
- By geography, Europe led with 36.18% share in 2025, while Asia-Pacific is projected to record a 16.23% CAGR through 2031.
Note: Market size and forecast figures in this report are generated using Mordor Intelligence’s proprietary estimation framework, updated with the latest available data and insights as of January 2026.
Market Trends and Insights
Drivers Impact Analysis of Sustainable Procurement and Supplier Carbon Scoring Software Market*
| Driver | (~) % Impact on CAGR Forecast | Geographic Relevance | Impact Timeline |
|---|---|---|---|
| Rising Scope 3 Disclosure Pressure from Enterprise Buyers | +4.2% | Global, concentrated in Europe and North America | Short term (≤ 2 years) |
| Procurement-Led Decarbonization Becomes a Budgeted Workflow | +3.1% | Europe, North America, and Asia-Pacific core | Medium term (2-4 years) |
| Supplier Data Digitization Improves Emissions Scoring Accuracy | +2.6% | Europe, North America, with spillover to Asia-Pacific and Middle East and Africa | Medium term (2-4 years) |
| Audit-Ready Carbon Data Reduces Reporting Friction | +2.0% | Europe first, with national adoption in Japan, India, and South Korea | Medium term (2-4 years) |
| Carbon Scoring Becomes Embedded in Supplier Selection | +1.5% | North America and Europe | Long term (≥ 4 years) |
| AI-Assisted Supplier Intake Reduces Manual Follow-Up Cost | +1.2% | Global | Long term (≥ 4 years) |
| Source: Mordor Intelligence | |||
Rising Scope 3 Disclosure Pressure from Enterprise Buyers
The sustainable procurement and supplier carbon scoring software market is being driven by the tightening timelines for Scope 3 reporting in major economies. California adopted its initial reporting regulations for SB 253 in February 2026, and the rule requires companies above the revenue threshold to begin filing Scope 1 and Scope 2 disclosures in 2026, with Scope 3 obligations following after that first phase. The European Union also kept Scope 3 disclosure inside the revised sustainability reporting framework, even after reducing the overall number of required data points in the 2026 amendment.[1] This means buyers can no longer rely on broad spend-based estimates for long, because the quality and origin of supplier data now matter more in formal reporting. The practical result is that procurement teams are turning supplier outreach, data capture, and scoring into recurring, software-led work rather than one-time spreadsheet exercises. The sustainable procurement and supplier carbon scoring software market is therefore gaining demand from enterprises that want to avoid last-minute supplier data gaps once reporting cycles begin.
Procurement-Led Decarbonization Becomes a Budgeted Workflow
The sustainable procurement and supplier carbon scoring software market is also expanding because procurement teams are now treating supplier emissions management as a funded operating task. EcoVadis reported in May 2026 that more than USD 2.5 trillion in global spend was already linked to sustainability risk insights across its network, which shows that supplier sustainability screening has moved into mainstream sourcing activity. The same update said that 55,838 companies were reporting at least 1 GHG metric and that 25,852 new companies adopted sustainability ratings in 2025, indicating growing participation on both the buyer and supplier sides. Once procurement owns the workflow, software spending becomes easier to justify because the tools support supplier engagement, risk review, and sourcing decisions. This shifts the category away from discretionary ESG budgets and closer to core procurement systems. The sustainable procurement and supplier carbon scoring software market benefits directly from that change, as recurring procurement activity creates steadier demand than periodic reporting projects.
Supplier Data Digitization Improves Emissions Scoring Accuracy
The sustainable procurement and supplier carbon scoring software market is being shaped by a shift away from generic emission factors toward supplier-specific records. The revised sustainability reporting environment in Europe kept Scope 3 requirements in place while pushing companies to document data quality more clearly, thereby increasing the value of tools that can cleanly separate primary and secondary inputs. Normative noted in May 2026 that the updated reporting structure preserves Scope 3 requirements and increases attention on how companies classify and evidence the source of emissions data across categories. That change matters because procurement teams need stronger records not only to score suppliers, but also to explain how each score was built. As a result, vendors that can support supplier intake, data validation, and documentation within a single workflow are becoming increasingly relevant, while tools that only display a score are becoming less so. The sustainable procurement and supplier carbon scoring software market is therefore seeing stronger demand for platforms that make data provenance visible and usable.
Audit-Ready Carbon Data Reduces Reporting Friction
The sustainable procurement and supplier carbon scoring software market is also gaining support from the need to make carbon reporting more auditable within daily workflows. SAP said in May 2026 that its new Footprint Optimization Agent can reduce Scope 3 scenario simulation time from 1 day to 20 minutes, while its Packaging Compliance Agent can cut manual compliance review hours by more than 50% and reduce assessment errors by more than 20%. These product moves show that large vendors are no longer treating sustainability as a separate reporting file; they are integrating it into process automation and regulatory-readiness tools. That matters for buyers because the burden is not only to collect data but also to retain records that can withstand internal review and external assurance. Software that links supplier inputs, calculations, and reporting outputs in a single system reduces operational friction for procurement and finance teams. The sustainable procurement and supplier carbon scoring software market is therefore benefiting from the shift toward audit-ready architecture rather than stand-alone reporting outputs.
Restraints Impact Analysis of Sustainable Procurement and Supplier Carbon Scoring Software Market*
| Restraint | (~) % Impact on CAGR Forecast | Geographic Relevance | Impact Timeline |
|---|---|---|---|
| Supplier Data Gaps Limit Score Reliability | -2.8% | Global, concentrated in Middle East and Africa and South America | Short term (≤ 2 years) |
| Methodology Fragmentation Reduces Score Comparability | -2.0% | Global | Medium term (2-4 years) |
| Integration Complexity with ERP and Procurement Suites | -1.5% | Enterprise-heavy markets in Europe and North America | Medium term (2-4 years) |
| Buyer Fatigue from Overlapping ESG Questionnaires | -1.1% | Europe and North America | Short term (≤ 2 years) |
| Source: Mordor Intelligence | |||
Supplier Data Gaps Limit Score Reliability
The sustainable procurement and supplier carbon scoring software market still faces a fundamental quality issue because many supplier records remain incomplete. The issue is strongest in long supplier tails, where smaller vendors often have limited sustainability staff and weaker internal data systems. That leads many buying organizations to work with a mix of verified values, partial disclosures, and estimated records inside the same scoring environment. When procurement teams cannot demonstrate how much of the score is based on primary supplier information, confidence in the result declines. This creates hesitation during vendor selection because buyers do not want a platform that produces neat scores without strong underlying coverage. The sustainable procurement and supplier carbon scoring software market, therefore, remains exposed to adoption delays, with data collection depth still weaker than disclosure expectations.
Methodology Fragmentation Reduces Score Comparability
The sustainable procurement and supplier carbon scoring software market also faces friction from inconsistent rules across reporting and target-setting frameworks. Normative explained in May 2026 that supplier-specific data is treated as primary data under the CSRD structure, while improvement pathways and estimate use can still look different in other climate programs, meaning the same supplier record may be interpreted differently across platforms. This makes score comparison harder for buyers reviewing several tools at once. A supplier can appear stronger or weaker depending on the vendor's methodology assumptions and data classification approach. That slows purchasing decisions because procurement leaders need confidence that scores are decision-ready and explainable. The sustainable procurement and supplier carbon scoring software market will continue to face this restraint until methodology mapping becomes easier and buyers adopt clearer standards for comparing outputs.
*Our forecasts treat driver/restraint impacts as directional, not additive. The impact forecasts reflect baseline growth, mix effects, and variable interactions.
Sustainable Procurement and Supplier Carbon Scoring Software Market Segment Analysis
By Function:
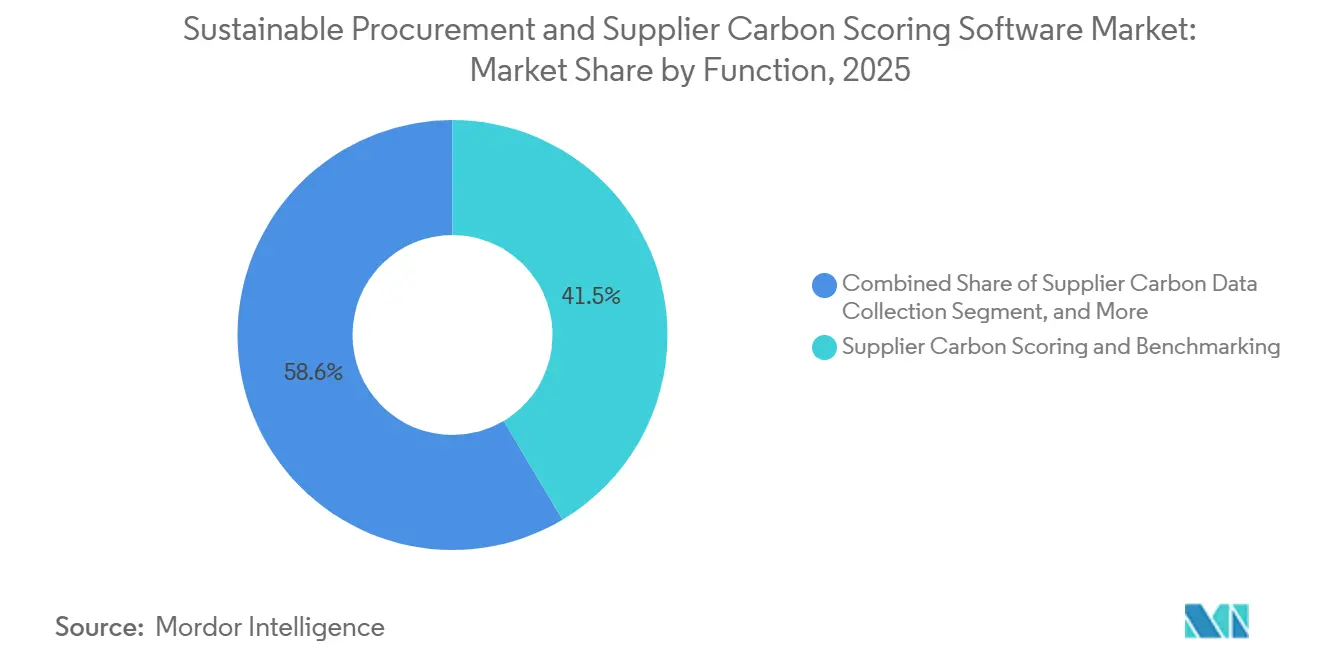
Benchmarking Leads While Data Collection Grows FastestSupplier carbon scoring and benchmarking accounted for 41.45% of the market in 2025, making it the largest function in the sustainable procurement and supplier carbon scoring software market. That lead reflects how procurement teams usually start with a practical question: which supplier poses lower carbon risk and which should be prioritized for sourcing or engagement. Benchmarking also gives buyers a clear way to compare suppliers across categories and regions, making it easier to incorporate carbon performance into routine procurement decisions. In the first phase of adoption, many organizations preferred scoring layers because they could work with available supplier submissions and estimation methods rather than redesign the entire data collection process.
Supplier carbon data collection is projected to grow at a 16.77% CAGR through 2031, which makes it the fastest-growing functional segment. This pattern shows that early scoring tools are now being followed by deeper investment in data capture, because buyers want stronger evidence behind the scores they use. The sustainable procurement and supplier carbon scoring software market is moving from output display to input quality, and this shift raises the value of supplier portals, guided questionnaires, document handling, and validation rules. Corrective action management and reporting functions also remain important because a score has limited value if it does not lead to supplier follow-up, target tracking, and audit-ready records. Other functions continue to absorb adjacent use cases, such as support for product carbon footprint and digital product information needs, broadening the functional map over time.

By Deployment:
Cloud Delivery Keeps Its Strong LeadCloud-based deployment accounted for 72.11% share in 2025 and is also projected to grow at a 17.45% CAGR through 2031. This means the largest deployment model is also the fastest-growing in the sustainable procurement and supplier carbon scoring software market. Cloud delivery fits the category well because suppliers, buyers, and internal teams need access to shared workflows without the heavy local infrastructure required. It also supports faster product updates, broader supplier onboarding, and easier integration of automation features into everyday use.
SAP’s 2026 product roadmap showed how differentiated features are increasingly tied to cloud delivery, with new sustainability agents built into its software environment rather than treated as separate manual tools.[2] SAP also highlighted Q1 2026 updates in Sustainability Footprint Management that reduced dependence on manual data handling and extended ERP-linked calculation workflows. On-premises deployment still matters for organizations with strict residency, security, or procurement rules, especially in sensitive sectors and long-standing ERP environments. Even so, the balance of innovation is clearly moving toward cloud platforms, leaving on-premises solutions more focused on continuity than on category leadership. This makes deployment a structural competitive advantage for vendors that already operate at scale in cloud-based procurement and carbon data environments.
By Organization Size:
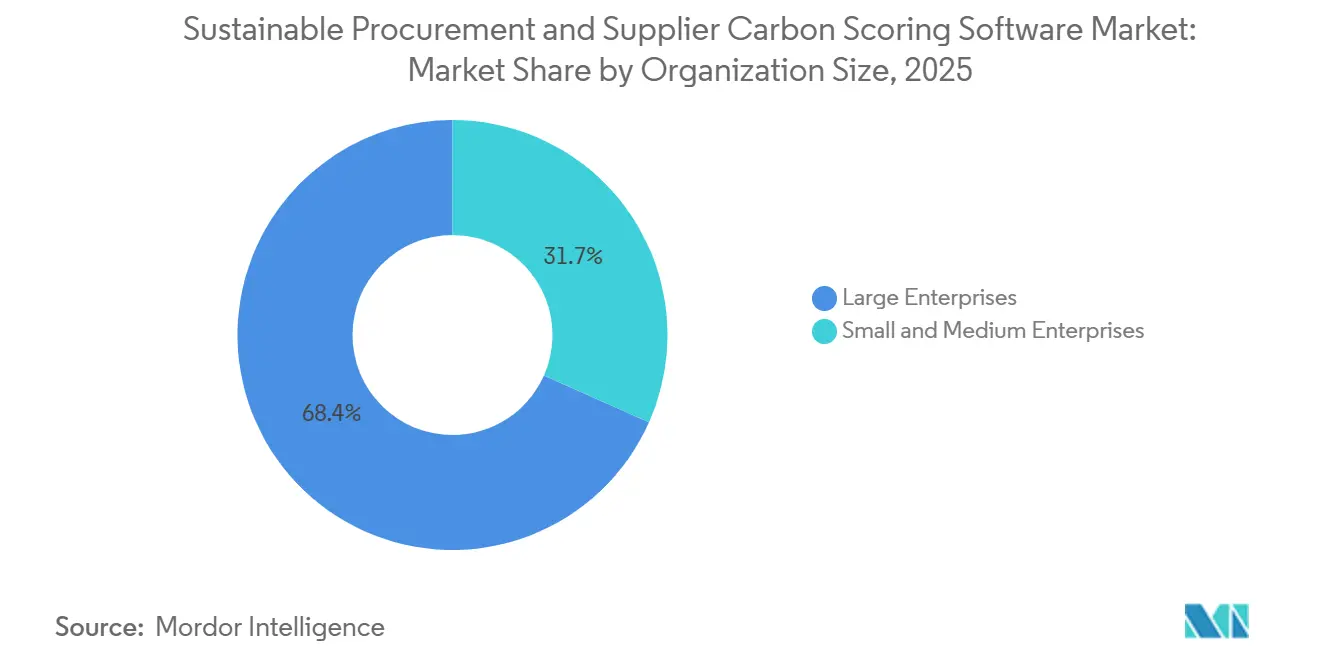
Large Enterprises Lead While SMEs Gain SpeedLarge enterprises held a 68.35% share in 2025, reflecting that they typically manage the broadest supplier bases and face the most immediate disclosure pressure. These buyers also have larger software budgets, dedicated procurement teams, and stronger motivation to standardize supplier carbon requests across regions. In the sustainable procurement and supplier carbon scoring software industry, enterprise demand has anchored current revenue, as large companies were the first to formalize supplier emissions collection as part of procurement and reporting. Their deployments often span multiple business units, supplier tiers, and compliance programs, which increases contract size and the value of integrated workflows.
SMEs are projected to grow at a 17.02% CAGR through 2031, making them the fastest-growing segment. The European Commission clarified in May 2026 that the value chain cap limits what large companies can formally ask from smaller entities in some reporting contexts, but it does not remove broader commercial pressure for suppliers to provide relevant sustainability information. This leaves SMEs facing continued requests from larger customers, lenders, and export markets, even when the formal reporting scope is narrower than before. Platforms are responding with lighter onboarding models and lower-friction tools that help smaller suppliers calculate and share footprints without needing a large sustainability team. The sustainable procurement and supplier carbon scoring software market is therefore opening to a new buyer layer that enters through supply chain pressure rather than a standalone ESG strategy.
By End-User Industry:
Manufacturing Leads While Retail and Consumer Goods Move QuicklyManufacturing held a 20.12% share in 2025, making it the largest end-user vertical in the sustainable procurement and supplier carbon scoring software market. That position reflects the sector’s complex supplier structures, higher material intensity, and stronger need to trace embedded emissions across procurement categories. Research published in the Journal of Industrial Ecology in 2026 reinforced the importance of multi-tier methods in complex supply chains, which aligns with why manufacturing buyers place value on deeper supplier data and stronger calculation logic. JAGGAER’s 2026 guidance on carbon-integrated procurement also showed how carbon performance is increasingly being evaluated alongside cost and quality in sourcing decisions. Manufacturing, therefore, remains the clearest fit for platforms that can connect supplier information, sourcing events, and carbon outcomes within a single process.
Retail and consumer goods are projected to grow at a 15.81% CAGR through 2031, indicating strong momentum from customer-facing supply chains. These companies face direct pressure to demonstrate progress on product-related emissions and to organize data from broad supplier networks spanning packaging, logistics, and raw materials. The sustainable procurement and supplier carbon scoring software industry is gaining relevance in this vertical because retail buyers need supplier carbon information that is simple enough to collect at scale but detailed enough to support downstream claims and reporting. Other verticals, such as BFSI, information technology, healthcare and life sciences, automotive and mobility, energy and utilities, and government and public sector, also remain meaningful, but their adoption paths vary by reporting model and procurement structure. Overall, end-user demand is broadening, though manufacturing continues to set the pace for depth, and retail continues to push the category toward more scalable supplier engagement.
Geography Analysis
Europe Sustainable Procurement and Supplier Carbon Scoring Software Market
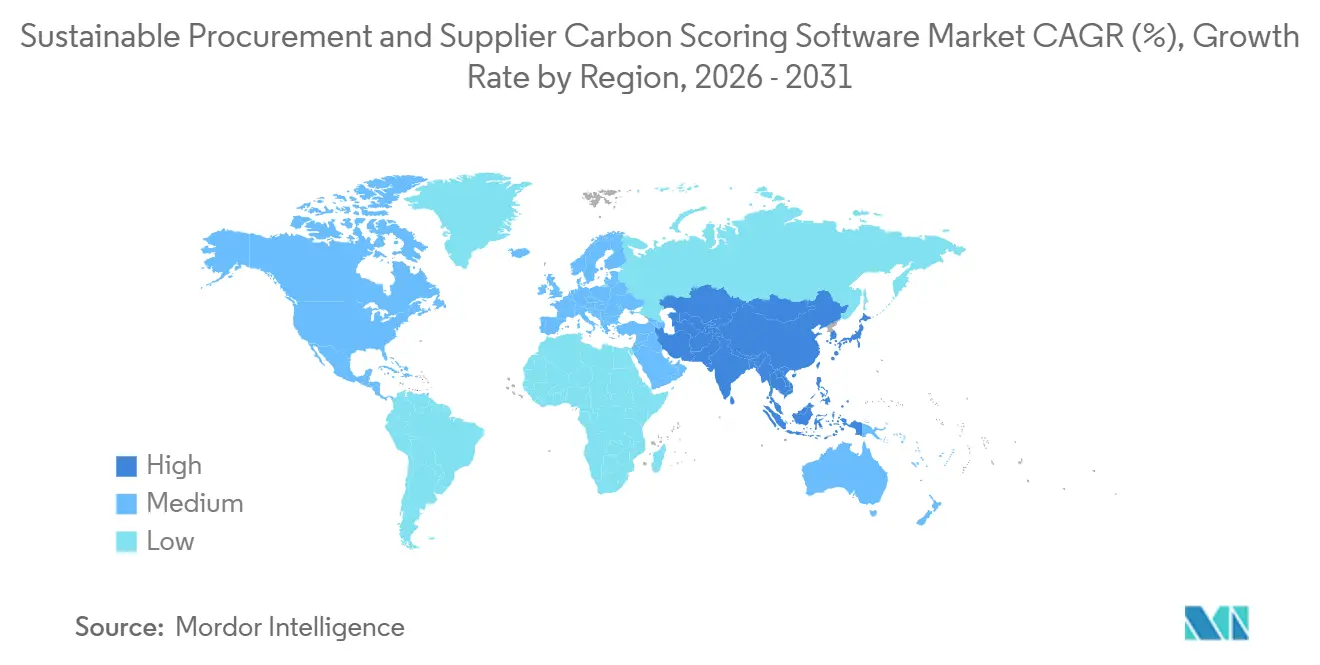
Europe held a 36.18% share in 2025, giving it the leading regional position in the sustainable procurement and supplier carbon scoring software market. The region moved earlier than most others because large companies already had to prepare supplier-linked sustainability information for formal disclosures. The 2026 EU amendment narrowed the reporting scope in employee and turnover terms, but it kept Scope 3 obligations within the framework, meaning supplier data needs did not disappear with the simplification. This helps explain why Europe remains the largest revenue base even as reporting rules are being refined. Companies in Germany, France, Italy, and the United Kingdom already operate in procurement environments where supplier sustainability expectations are more established, so software adoption is supported by existing internal processes as much as by new compliance pressure.
The Americas and MEA Sustainable Procurement and Supplier Carbon Scoring Software Market
North America held the second-largest regional position in 2025, supported mainly by U.S.-based multinationals with broad procurement networks and early exposure to California’s reporting timetable. California’s February 2026 rulemaking made disclosure preparation a near-term operational task, increasing the urgency around supplier data collection and internal readiness. South America remained smaller, but export-facing companies in sectors such as commodities and manufacturing are still affected when large overseas buyers demand stronger supplier emissions records. Middle East and Africa also remained smaller in 2026, though the region offers entry points where buyers are building procurement modernization and sustainability reporting capabilities in parallel. Across these regions, adoption tends to start with larger enterprises that have international customers, stricter governance expectations, or exposure to multinational supply chain standards.
APAC Sustainable Procurement and Supplier Carbon Scoring Software Market
Asia-Pacific is projected to grow at a 16.23% CAGR through 2031, making it the fastest-growing region in the sustainable procurement and supplier carbon scoring software market. Japan’s Financial Services Agency released its phased roadmap in April 2026 and set mandatory sustainability disclosure requirements for larger Prime Market companies, effective for fiscal years beginning in April 2026, including Scope 3 expectations under the new framework.[3] This gives the region an important regulatory anchor that reaches directly into listed companies and their supplier networks. Growth in Asia-Pacific is also supported by export-side pressure, as suppliers serving European buyers need better records of embedded emissions and related carbon data. As a result, the region is becoming a major expansion area for platforms that can scale supplier onboarding while still maintaining documentation strong enough to meet global customer requirements.
Competitive Landscape
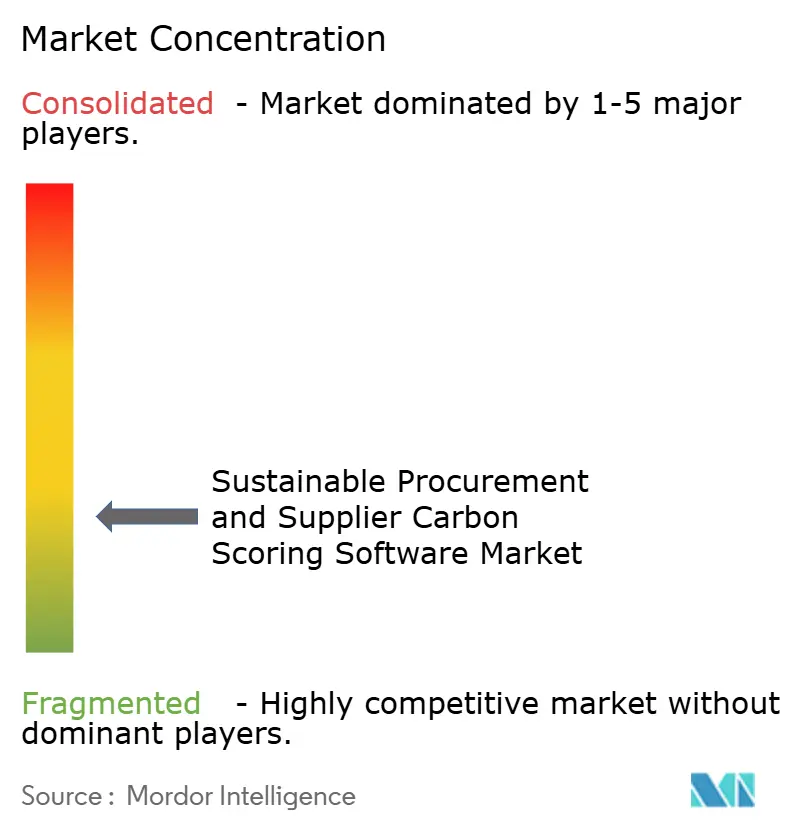
The sustainable procurement and supplier carbon scoring software market remains fragmented, with competition spread across specialist supplier ratings platforms, carbon accounting providers, and large source-to-pay vendors. This creates a field in which no single vendor type controls the entire value chain, even though each group is trying to move toward end-to-end coverage. Specialist platforms still hold an advantage in supplier network familiarity and onboarding experience, while enterprise software vendors hold an advantage in installed procurement and ERP relationships. Carbon accounting vendors sit between those positions by linking emissions calculations, reporting workflows, and supplier data models. The sustainable procurement and supplier carbon scoring software market is therefore competitive not only on product features, but also on where each vendor already sits within the customer’s workflow.
EcoVadis remains one of the most visible players because network scale has become a form of competitive protection in this category. In May 2026, the company said that more than USD 2.5 trillion in global spend was governed through sustainability risk insights across its network and that more than 130,000 companies were active in its rated ecosystem.[4] That scale matters because enterprises often prefer a platform that can bring suppliers into their existing network rather than starting every data request from scratch. SAP is taking a different route by embedding sustainability functions more deeply into enterprise software, and its May 2026 launch plan for regulatory-readiness and footprint-optimization agents shows a clear push to make sustainability part of everyday business systems. IntegrityNext is also broadening its platform, and its March 2026 XMINDS initiative signaled a longer-term AI-first product direction for supply chain sustainability workflows.
Strategic moves in 2026 show that vendors are competing on workflow depth, automation, and adjacent compliance coverage rather than on simple scoring screens alone. IntegrityNext expanded its Product Compliance pillar in May 2026, further pushing its platform into regulatory obligations tied to goods and trade flows, not just supplier due diligence and carbon management. Climatiq introduced a Product Carbon Footprint API in May 2026, using ISO 14067-verified methodology, reflecting demand for embedded product-level emissions tools that other software providers can plug into their own systems. Normative also launched product carbon footprint software in May 2026, extending its offer beyond corporate footprint work and into supplier and customer data exchange needs. These moves show that the sustainable procurement and supplier carbon scoring software market is shifting toward broader carbon data infrastructure, where vendor strength depends on integration, traceability, and the ability to support both company-level and product-level requirements.
Sustainable Procurement and Supplier Carbon Scoring Software Industry Leaders
-
SAP SE
-
IBM Corporation
-
Schneider Electric SE
-
Watershed Technology, Inc.
-
Sphera Solutions, Inc.
- *Disclaimer: Major Players sorted in no particular order
Sustainable Procurement and Supplier Carbon Scoring Software Market Companies Covered in this Report
- EcoVadis SAS
- IntegrityNext GmbH
- Worldfavor AB
- Greenly SAS
- SAP SE
- IBM Corporation
- Siemens AG
- Schneider Electric SE
- Persefoni AI, Inc.
- Watershed Technology, Inc.
- Sphera Solutions, Inc.
- Ivalua Inc.
- Coupa Software Incorporated
- Jaggaer, LLC
- GEP Worldwide
- Oracle Corporation
- Basware Corporation
- Cority Software Inc.
- Sedex Holdings Limited
- Enablon SA
- Normative AB
- Plan A Earth GmbH
- Emitwise Ltd
- Climatiq GmbH
- Cozero GmbH
- CarbonChain Ltd
Recent Industry Developments in Sustainable Procurement and Supplier Carbon Scoring Software Market
- May 2026: SAP announced that new sustainability AI agents, including a Sustainability Regulatory Readiness Agent, a Footprint Optimization Agent (reducing scenario simulation from one day to 20 minutes), and a Packaging Compliance Agent (cutting manual review hours by over 50%), will reach general availability by end-2026, targeting enterprise procurement teams under escalating CSRD and CBAM compliance pressure.
- May 2026: IntegrityNext announced the strategic expansion of its Product Compliance pillar with AI-powered capabilities, extending its platform beyond supplier due diligence and carbon management to cover product-level regulatory obligations under PPWR and CBAM.
- May 2026: Climatiq launched its Product Carbon Footprint API, powered by an ISO 14067-verified methodology, enabling software platforms to embed supplier-specific product-level emissions calculations using a database of over 1 million emission factors.
- March 2026: IntegrityNext launched the XMINDS corporate transformation initiative formalizing an AI-first innovation roadmap, announced a strategic partnership with BearingPoint for procurement resilience and regulatory compliance delivery, and released its AI Screening tool for supply chain due diligence, three capability extensions in two weeks that Verdantix cited as reflecting the industry's shift toward embedding sustainability in procurement workflows.
Global Sustainable Procurement and Supplier Carbon Scoring Software Market Report Scope
The sustainable procurement and supplier carbon scoring software market encompasses software solutions that enable enterprises to measure, monitor, and manage carbon emissions within their supplier base, aligning with sustainable procurement strategies. These platforms gather emissions data at the supplier level, evaluate ESG risks, and produce carbon scores to guide sourcing decisions. They enhance supplier engagement, plan corrective actions, and manage Scope 3 emissions throughout global supply chains. By integrating with procurement systems, the software helps organizations synchronize purchasing choices with sustainability objectives and regulatory mandates.
The Sustainable Procurement and Supplier Carbon Scoring Software Market Report is Segmented by Function (Supplier Carbon Data Collection, Supplier Carbon Scoring and Benchmarking, Supplier Engagement and Corrective Action Management, Carbon Reporting and Audit Trail Management, and Other Functions), Deployment (Cloud-Based, and On-Premises), Organization Size (Large Enterprises, and Small and Medium Enterprises), End-User Industry (Banking, Financial Services and Insurance, Information Technology and Telecom, Healthcare and Life Sciences, Manufacturing, Retail and Consumer Goods, Automotive and Mobility, Energy and Utilities, Government and Public Sector, and Other End-User Industries), and Geography (North America, South America, Europe, Asia-Pacific, Middle East, and Africa). The Market Forecasts are Provided in Terms of Value (USD).
Segmentation Overview
| Supplier Carbon Data Collection |
| Supplier Carbon Scoring and Benchmarking |
| Supplier Engagement and Corrective Action Management |
| Carbon Reporting and Audit Trail Management |
| Other Functions |
| Cloud-Based |
| On-Premises |
| Large Enterprises |
| Small and Medium Enterprises |
| Banking, Financial Services, and Insurance |
| Information Technology and Telecom |
| Healthcare and Life Sciences |
| Manufacturing |
| Retail and Consumer Goods |
| Automotive and Mobility |
| Energy and Utilities |
| Government and Public Sector |
| Other End-User Industries |
| North America | United States |
| Canada | |
| Mexico | |
| South America | Brazil |
| Argentina | |
| Rest of South America | |
| Europe | Germany |
| United Kingdom | |
| France | |
| Italy | |
| Spain | |
| Russia | |
| Rest of Europe | |
| Asia-Pacific | China |
| India | |
| Japan | |
| South Korea | |
| Australia | |
| Rest of Asia-Pacific | |
| Middle East | Saudi Arabia |
| United Arab Emirates | |
| Turkey | |
| Rest of Middle East | |
| Africa | South Africa |
| Nigeria | |
| Rest of Africa |
| By Function | Supplier Carbon Data Collection | |
| Supplier Carbon Scoring and Benchmarking | ||
| Supplier Engagement and Corrective Action Management | ||
| Carbon Reporting and Audit Trail Management | ||
| Other Functions | ||
| By Deployment | Cloud-Based | |
| On-Premises | ||
| By Organization Size | Large Enterprises | |
| Small and Medium Enterprises | ||
| By End-User Industry | Banking, Financial Services, and Insurance | |
| Information Technology and Telecom | ||
| Healthcare and Life Sciences | ||
| Manufacturing | ||
| Retail and Consumer Goods | ||
| Automotive and Mobility | ||
| Energy and Utilities | ||
| Government and Public Sector | ||
| Other End-User Industries | ||
| By Geography | North America | United States |
| Canada | ||
| Mexico | ||
| South America | Brazil | |
| Argentina | ||
| Rest of South America | ||
| Europe | Germany | |
| United Kingdom | ||
| France | ||
| Italy | ||
| Spain | ||
| Russia | ||
| Rest of Europe | ||
| Asia-Pacific | China | |
| India | ||
| Japan | ||
| South Korea | ||
| Australia | ||
| Rest of Asia-Pacific | ||
| Middle East | Saudi Arabia | |
| United Arab Emirates | ||
| Turkey | ||
| Rest of Middle East | ||
| Africa | South Africa | |
| Nigeria | ||
| Rest of Africa | ||
Key Questions Answered in the Report
What is the 2026 value of the sustainable procurement and supplier carbon scoring software market?
The sustainable procurement and supplier carbon scoring software market stands at USD 3.48 billion in 2026 and is forecast to reach USD 7.06 billion by 2031 at a 15.23% CAGR.
Why are companies investing in supplier carbon scoring software now?
Demand is rising because procurement teams need supplier emissions data that can support Scope 3 reporting, supplier selection, and audit-ready documentation under tighter disclosure rules.
Which function leads demand in supplier carbon scoring platforms?
Supplier carbon scoring and benchmarking held the largest share at 41.45% in 2025, showing that buyers still prioritize comparable supplier decision outputs before expanding deeper into data collection.
Which deployment model is growing fastest in this category?
Cloud-based deployment leads the category with 72.11% share in 2025 and is also the fastest-growing model with a 17.45% CAGR through 2031.
Which customer group is expanding fastest in this software space?
SMEs are the fastest-growing buyer group with a projected 17.02% CAGR through 2031, mainly because larger customers are pushing supplier data requests deeper into the supply chain.
Which region offers the strongest growth opportunity through 2031?
Asia-Pacific has the highest projected regional CAGR at 16.23%, supported by stronger disclosure requirements in Japan and by export-side pressure from global buyers.