Carbon And Energy Software Market Size and Share
Market Overview
| Study Period | 2019 - 2030 |
|---|---|
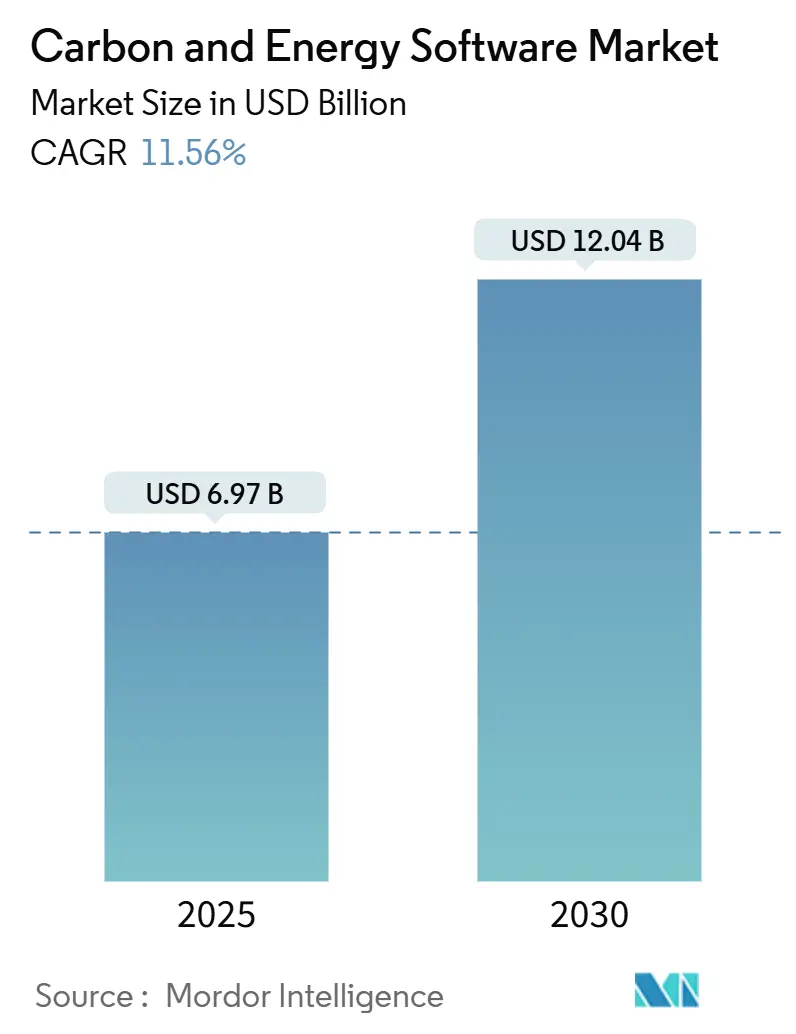
| Market Size (2025) | USD 6.97 Billion |
| Market Size (2030) | USD 12.04 Billion |
| Growth Rate (2025 - 2030) | 11.56% CAGR |
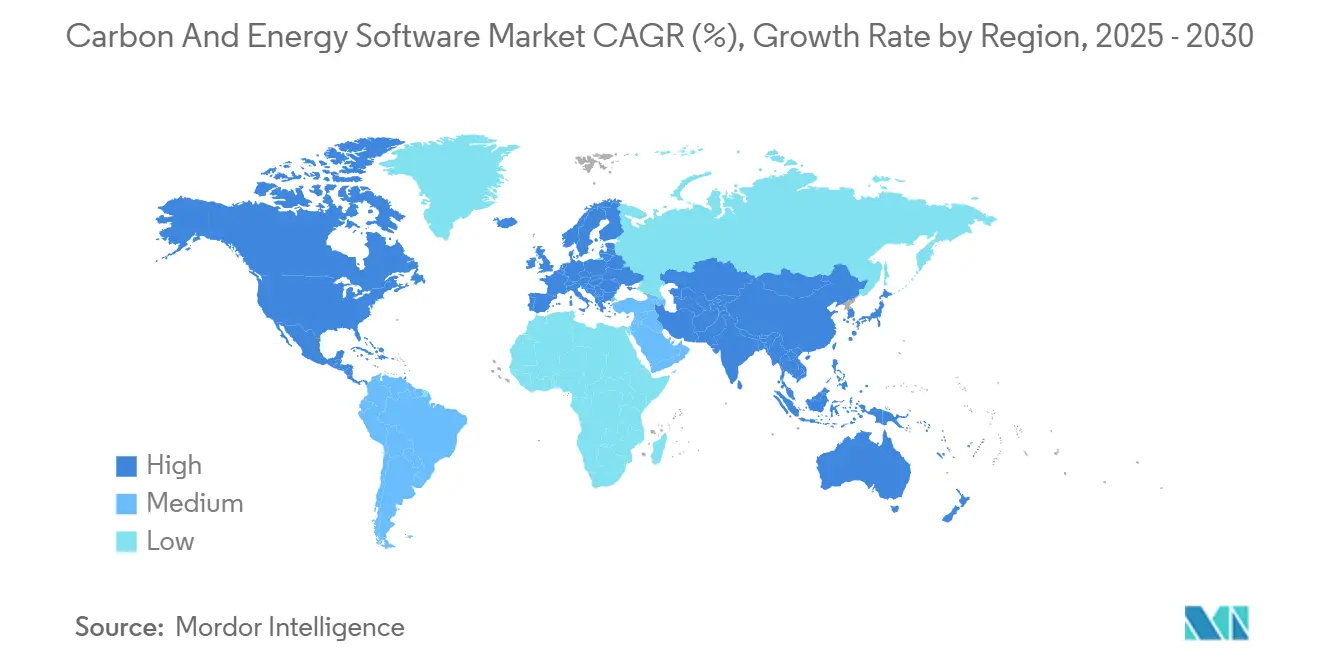
| Fastest Growing Market | Asia Pacific |
| Largest Market | Europe |
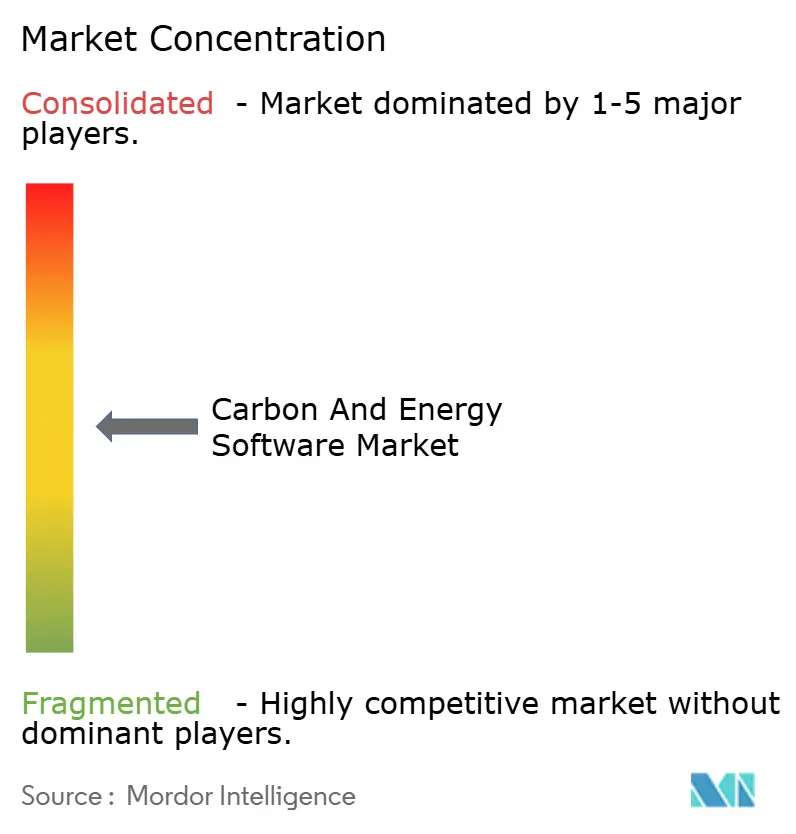
| Market Concentration | Medium |
Major Players *Disclaimer: Major Players sorted in no particular order Image © Mordor Intelligence. Reuse requires attribution under CC BY 4.0. | |
Carbon And Energy Software Market Analysis by Mordor Intelligence
The carbon and energy software market reached USD 6.97 billion in 2025 and is forecast to climb to USD 12.04 billion by 2030, delivering an 11.56% CAGR. The market size expansion reflects tightening disclosure mandates, accelerating net-zero programs, and cloud-first digitalization in carbon accounting. Mandatory greenhouse-gas (GHG) reporting deadlines across OECD economies continue to unlock budget allocations for audit-ready platforms, while ongoing energy-price volatility sustains interest in real-time optimization modules. Corporate demand is shifting toward integrated suites that merge financial, operational, and sustainability data in a single workflow, creating opportunities for vendors that can streamline XBRL tagging, assurance support, and Scope 3 supplier data capture. Strategic acquisitions, notably Workiva’s USD 100 million purchase of Sustain. Life-signal rising consolidation as enterprise software giants embed carbon tools into broader governance, risk, and compliance ecosystems.
Key Report Takeaways
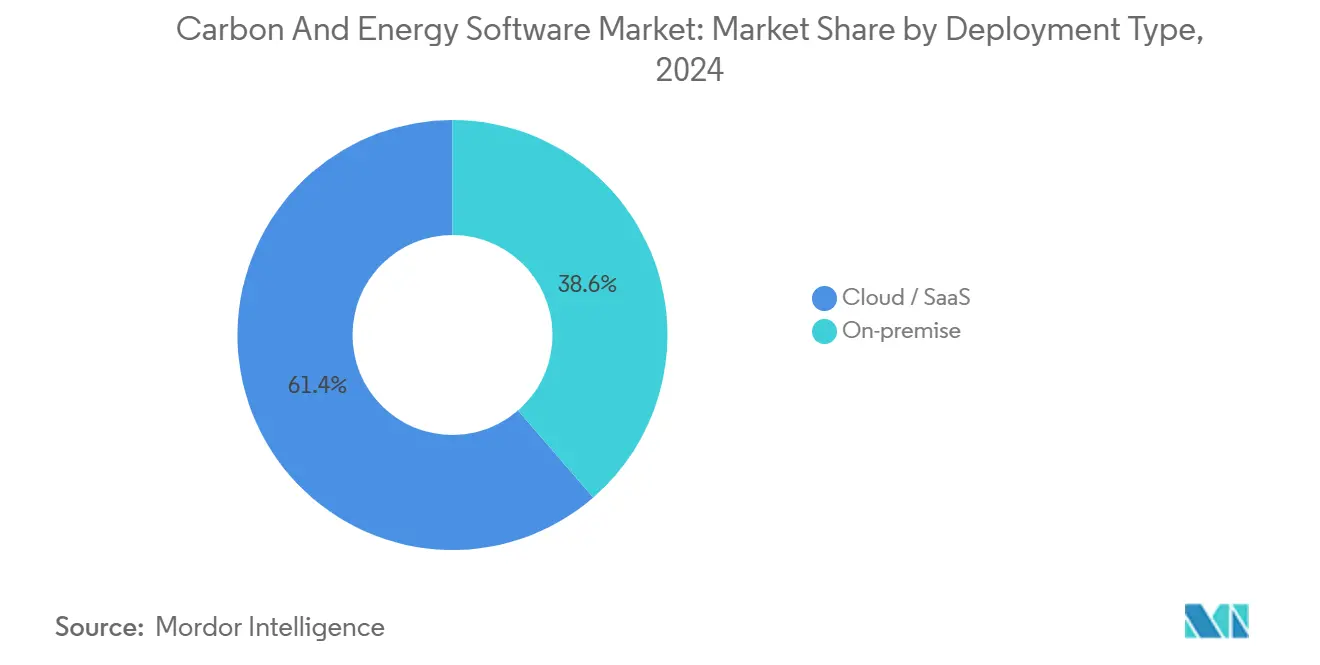
- By deployment type, Cloud/SaaS led with 61.37% revenue share in 2024; Cloud/SaaS is projected to expand at a 13.14% CAGR through 2030.
- By component, Solutions captured 52.78% of the carbon and energy software market share in 2024, while Services is forecast to register a 13.26% CAGR to 2030.
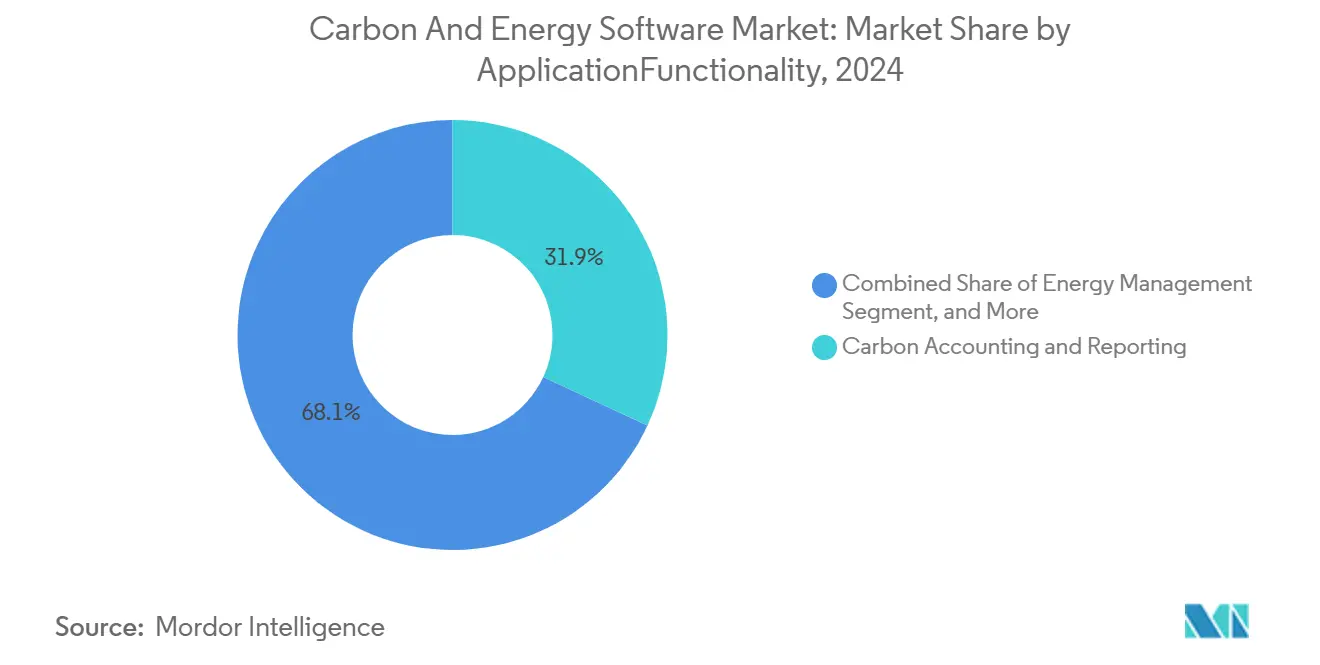
- By application/functionality, Carbon Accounting and Reporting controlled 31.92% share of the carbon and energy software market size in 2024; Supply-Chain Emissions Management is advancing at an 11.73% CAGR through 2030.
- By end-user industry, Manufacturing held a 22.47% share in 2024; Transportation and Logistics is projected to grow at an 11.61% CAGR through 2030.
- By geography, Europe commanded 28.74% revenue share in 2024, whereas Asia-Pacific is expected to post an 11.77% CAGR during the forecast period.
Global Carbon And Energy Software Market Trends and Insights
Drivers Impact Analysis*
| Driver | (~) % Impact on CAGR Forecast | Geographic Relevance | Impact Timeline |
|---|---|---|---|
| Mandatory GHG-reporting deadlines in OECD economies | +3.2% | Europe, North America, Asia-Pacific developed markets | Medium term (2-4 years) |
| Corporate net-zero pledges accelerating software spend | +2.8% | Global, with concentration in North America and Europe | Short term (≤ 2 years) |
| Energy-price volatility post-Ukraine war pushing audit-ready analytics | +1.9% | Europe, with spillover to global energy markets | Short term (≤ 2 years) |
| Scope-3 data-exchange APIs emerging for supplier onboarding | +1.7% | Global, led by manufacturing hubs in Asia-Pacific and Europe | Medium term (2-4 years) |
| Tokenised carbon-credit reconciliation workflows | +1.2% | Global, early adoption in North America and Europe | Long term (≥ 4 years) |
| AI-driven scenario-modelling for embedded emissions | +0.8% | North America, Europe, Asia-Pacific technology centers | Long term (≥ 4 years) |
| Source: Mordor Intelligence | |||
Mandatory GHG-Reporting Deadlines in OECD Economies
The European Union Corporate Sustainability Reporting Directive (CSRD) obliges roughly 50,000 firms to submit XBRL-formatted emissions statements for 2024 data, creating a surge in RFPs for multi-framework platforms. [1]EUR-LEX, “Directive (EU) 2022/2464—CSRD Text,” europa.eu California’s Climate Corporate Data Accountability Act imposes Scope 3 disclosure on enterprises with USD 1 billion-plus revenue, complementing the U.S. SEC climate proposal that targets filers above USD 700 million float. Companies now favor solutions that consolidate EU, U.S., and other regional rules in a single database, reducing duplication and audit costs. Supply-chain knock-on effects intensify demand as tier-one manufacturers cascade data requests to thousands of suppliers. Vendor roadmaps increasingly highlight automated XBRL tagging, machine-readable audit trails, and in-product assurance workflows tailored for Big-Four verification.
Corporate Net-Zero Pledges Accelerating Software Spend
More than 4,000 global corporations have validated science-based targets, shifting budgets from manual spreadsheets to enterprise-grade platforms capable of tracking decarbonization pathways. Workiva Carbon enabled Energy Recovery to automate data feeds from utilities, cutting four hours of monthly manual effort and reallocating staff toward reduction initiatives. [2]Workiva, “Energy Recovery Automates Carbon Accounting with Workiva Carbon,” workiva.com Investment in climate-tech fintech hit USD 2.3 billion in 2024, underscoring board-level urgency to operationalize net-zero goals. Scenario modeling, mitigation planning, and automated target-vs-actual dashboards have become decisive procurement criteria. The cloud architecture integral to most offerings aligns with corporate IT roadmaps that prioritize scalability, cybersecurity, and continuous feature updates.
Energy-Price Volatility Post-Ukraine War Pushing Audit-Ready Analytics
Natural-gas and electricity price swings have forced European manufacturers to scrutinize consumption patterns by facility, shift, and asset. Platforms that merge real-time meter data with emissions factors deliver dual value: cost reduction and compliance evidence. Predictive maintenance algorithms identify energy-hungry anomalies, enabling immediate remedial action while documenting tons of CO₂e avoided for monthly Board reports. Finance teams increasingly require that optimization claims be traceable to source data to satisfy auditor scrutiny, propelling adoption of integrated carbon-and-energy suites.
AI-Driven Scenario Modeling for Embedded Emissions
Generative AI now extracts emissions data from heterogeneous documents-PDF invoices, image-based bills, and multilingual supplier declarations-reducing manual transcription risk. Machine-learning modules flag anomalies, suggest corrective actions, and align raw data with GHG Protocol categories. Advanced suites simulate the emissions effect of replacing equipment, switching suppliers, or adjusting production volumes before capital budgets are finalized. This predictive capacity appeals to CFOs eager to quantify return on decarbonization spend and to sustainability teams tasked with validating science-based targets.
Restraints Impact Analysis*
| Restraint | (~) % Impact on CAGR Forecast | Geographic Relevance | Impact Timeline |
|---|---|---|---|
| Unharmonised ESG taxonomies across jurisdictions | -2.1% | Global, particularly affecting multinational corporations | Medium term (2-4 years) |
| Data-quality gaps in industrial IoT meters | -1.8% | Manufacturing-heavy regions in Asia-Pacific and Europe | Short term (≤ 2 years) |
| Vendor-lock-in concerns around proprietary emissions factors | -1.3% | Global, affecting enterprise segment adoption | Medium term (2-4 years) |
| Shortage of in-house sustainability analysts | -0.9% | Global, with acute impact in emerging markets | Long term (≥ 4 years) |
| Source: Mordor Intelligence | |||
Unharmonized ESG Taxonomies Across Jurisdictions
The International Sustainability Standards Board seeks to unify reporting, yet regional frameworks such as the EU-specific ESRS and Japan’s forthcoming disclosure code differ on scope and metrics. Multinationals must map identical data points to multiple templates, escalating software configuration cost and internal workload. Vendors respond with rules-based engines that route a single data set into diverse layouts, but implementation remains labor-intensive. Divergent assurance requirements further complicate system design, as platform workflows must accommodate both limited- and reasonable-assurance evidence packages. These complexities extend procurement cycles and raise the total cost of ownership, dampening uptake among resource-constrained organizations.
Data-Quality Gaps in Industrial IoT Meters
Factory-floor sensors often vary by make, calibration schedule, and communication protocol. Calibration drift and network outages generate missing or inaccurate readings that undermine emissions calculations. Standardization lags: globally accepted data schemas for kilowatt-hour or cubic-meter streams are still evolving. Software vendors embed cleansing, gap-filling, and machine-learning-based anomaly detection, yet persistent integration headaches lengthen deployment timelines. Projects with heterogeneous legacy assets-common in steel, cement, and chemicals—face multi-phase rollouts that strain sustainability and IT teams alike.
*Our forecasts treat driver/restraint impacts as directional, not additive. The impact forecasts reflect baseline growth, mix effects, and variable interactions.
Segment Analysis
By Deployment Type: Cloud Dominance Accelerates Digital Transformation
Cloud subscriptions accounted for USD 4.28 billion and 61.37% of the carbon and energy software market in 2024, expanding at a 13.14% CAGR through 2030. The carbon and energy software market size advantage stems from built-in scalability that handles sudden ESG data-volume spikes during the reporting season. Cloud platforms integrate native connectors to enterprise resource planning suites and utility portals, offering real-time dashboards accessed simultaneously by sustainability, finance, and audit teams. On-premise architectures, still favored by highly regulated industries, captured the remaining 38.63% but show a flattish trajectory as IT budgets tilt toward SaaS.
Historic migration patterns reveal a steady shift: cloud-based carbon and energy software market share climbed from 45% in 2019 to its current dominance. Vendor roadmaps prioritize microservices for continuous feature deployment, enabling rapid compliance with evolving CSRD annexes or SEC amendments. Cybersecurity certifications-ISO 27001, SOC 2, and FedRAMP-mitigate risk perceptions, further accelerating adoption. Data-residency controls now allow partitioning within EU boundaries, satisfying sovereignty mandates without sacrificing elasticity.


By Component: Services Growth Reflects Implementation Complexity
Solutions retained 52.78% of the carbon and energy software market share in 2024, yet Services exhibited a sharper 13.26% CAGR forecast. The carbon and energy software market size for Services correlates with rising demand for regulatory mapping, emissions-factor maintenance, and change-management training. Advisory partners guide clients through data discovery workshops, supplier-survey rollouts, and assurance evidence compilation.
Continuous updates to emissions-factor libraries from EPA, DEFRA, and IEA necessitate subscription-style maintenance engagements. Vendors bundle technical support with quarterly regulatory briefings, ensuring that platform configurations remain CSRD-ready. As enterprises extend reporting from environmental to social and governance metrics, cross-functional integrations grow more intricate, further raising service intensity.
By Application/Functionality: Supply-Chain Complexity Drives Innovation
Carbon Accounting and Reporting generated 31.92% of revenue in 2024, underpinning every compliance journey. Supply-Chain Emissions Management is set to outpace the broader carbon and energy software market at an 11.73% CAGR, catalyzed by Scope 3 urgency and new EU due diligence statutes. The carbon and energy software market size for supply-chain applications benefits from AI-powered supplier portals that substitute spend-based estimates with primary data, shrinking error margins.
Emerging APIs support secure data exchange between tier-one buyers and thousands of SMEs, while machine-learning algorithms reconcile supplier activity data against category-specific emissions factors. Integrated chatbots speed questionnaire completion, lifting response rates. Carbon-credit reconciliation modules-tied to blockchain registries—allow procurement teams to match offsets with shipment data, ensuring real-time inventory of carbon attributes.

By End-User Industry: Manufacturing Leadership Faces Transportation Challenge
Manufacturing held a 22.47% share in 2024, reflecting the sector’s sizeable Scope 1 and 2 footprint and existing sensor infrastructure. However, Transportation and Logistics will grow faster at 11.61% CAGR as fleet electrification, route optimization, and maritime FuelEU requirements intensify digital-tracking needs. The carbon and energy software industry tailors dashboards to vehicle telematics, cargo manifests, and fuel ledger data.
Tier-one manufacturers expand functionality to product-level lifecycle assessment, integrating bill-of-materials data with GHG factors to produce digital product passports. Financial services users focus on financed-emissions modules that align with the Partnership for Carbon Accounting Financials rules, while healthcare clients target facility energy management and pharma supply-chain tracking.
Geography Analysis
Europe retained leadership with a 28.74% share in 2024, buoyed by early CSRD enforcement and the United Kingdom’s alignment with the Task Force on Climate-related Financial Disclosures. Germany’s fintech ecosystem attracted USD 710 million in 2024 sustainability-tech investment, bolstering vendor innovation hubs. France’s Label Bas-Carbone standard stimulated demand for offset-tracking features among domestic corporates. Nordics emphasize open-data architectures, influencing EU-wide interoperability pilots.
Asia-Pacific will record the fastest 11.77% CAGR. China’s dual-carbon goals push heavy-industry digitalization grants, funneling capital into factory energy-management suites. Japan’s new Corporate Governance Code encourages ESG disclosures, lifting adoption among automotive and electronics majors. India’s Production-Linked Incentive schemes require carbon-reduction reporting, catalyzing SMB uptake. South Korea’s K-Taxonomy and Australia’s Safeguard Mechanism updates create adjacent demand.
North America benefits from voluntary leadership and state mandates. The U.S. SEC proposal, though under review, has already motivated early compliance spend, while Canada’s carbon price trajectory and Mexico’s export-oriented supply chains reinforce regional momentum. Energy-sector clients leverage U.S. Department of Energy grants to integrate renewables and virtual-power-plant data into emissions dashboards.
The Middle East and Africa show rising interest anchored in Saudi Arabia’s Vision 2030 sustainability metrics and the United Arab Emirates’ green-hydrogen roadmap. South America sees Brazil modernizing industrial footprints ahead of EU Carbon Border Adjustment Mechanism enforcement, creating a new wave of demand for audit-ready software across exporters.

Competitive Landscape
Consolidation is advancing as multifunctional governance suites swallow niche carbon startups. Workiva absorbed Sustain. Life, embedding carbon ledgers into its SEC filing platform and reinforcing cross-department collaboration. [3]Sustainable Tech Partner, “Gevo Acquires CultivateAI,” sustainabletechpartner.com IBM extended Envizi with European Sustainability Reporting Standards mapping, underscoring the shift toward single-vendor ecosystems that integrate ESG, risk, and financial controls. Gevo’s acquisition of CultivateAI illustrates vertical integration in agriculture, where barcode-to-biomass traceability supports low-carbon fuel certification.
Competitive differentiation hinges on (1) data-ingestion breadth-utilities, IoT, spend, and HR; (2) AI-enabled assurance-automated variance checks and anomaly alerts; and (3) ecosystem partnerships with consultancies that speed configuration. Market entrants exploit white-space in financed emissions, maritime cargo, and construction lifecycle modules. Vendor lock-in fears stimulate demand for open APIs and downloadable emissions-factor libraries.
Despite ongoing M&A, the top five vendors collectively control under 35% of revenue, indicating moderate concentration and room for specialization.
Carbon And Energy Software Industry Leaders
Persefoni AI Inc.
Plan A Earth GmbH
Sweep SAS
Sphera Solutions Inc.
Wolters Kluwer N.V. (Enablon)
- *Disclaimer: Major Players sorted in no particular order

Recent Industry Developments
- January 2025: IBM added ESRS-aligned data capture and IT sustainability optimization to Envizi, easing multi-framework reporting.
- December 2024: Workiva released a carbon-management datasheet featuring automated emissions calculations across 240+ jurisdictions.
- September 2024: Gevo acquired CultivateAI to deepen agricultural carbon accounting, targeting biofuel supply chains.
- June 2024: Workiva bought Sustain.Life for USD 100 million, integrating emissions tracking into its disclosure cloud.


Global Carbon And Energy Software Market Report Scope
| On-premise |
| Cloud / SaaS |
| Solutions | |
| Services | Implementation and Consulting |
| Support and Maintenance |
| Carbon Accounting and Reporting |
| Energy Management |
| Sustainability Performance Management |
| ESG Reporting and Compliance |
| Supply-Chain Emissions Management |
| Other Application / Functionality |
| Manufacturing |
| Energy and Utilities |
| Information Technology and Telecommunications |
| Transportation and Logistics |
| Healthcare |
| Banking, Financial Services and Insurance |
| Government and Public Sector |
| Other End-User Industry |
| North America | United States | |
| Canada | ||
| Mexico | ||
| Europe | Germany | |
| United Kingdom | ||
| France | ||
| Russia | ||
| Rest of Europe | ||
| Asia-Pacific | China | |
| Japan | ||
| India | ||
| South Korea | ||
| Australia | ||
| Rest of Asia-Pacific | ||
| Middle East and Africa | Middle East | Saudi Arabia |
| United Arab Emirates | ||
| Rest of Middle East | ||
| Africa | South Africa | |
| Egypt | ||
| Rest of Africa | ||
| South America | Brazil | |
| Argentina | ||
| Rest of South America | ||
| By Deployment Type | On-premise | ||
| Cloud / SaaS | |||
| By Component | Solutions | ||
| Services | Implementation and Consulting | ||
| Support and Maintenance | |||
| By Application / Functionality | Carbon Accounting and Reporting | ||
| Energy Management | |||
| Sustainability Performance Management | |||
| ESG Reporting and Compliance | |||
| Supply-Chain Emissions Management | |||
| Other Application / Functionality | |||
| By End-User Industry | Manufacturing | ||
| Energy and Utilities | |||
| Information Technology and Telecommunications | |||
| Transportation and Logistics | |||
| Healthcare | |||
| Banking, Financial Services and Insurance | |||
| Government and Public Sector | |||
| Other End-User Industry | |||
| By Geography | North America | United States | |
| Canada | |||
| Mexico | |||
| Europe | Germany | ||
| United Kingdom | |||
| France | |||
| Russia | |||
| Rest of Europe | |||
| Asia-Pacific | China | ||
| Japan | |||
| India | |||
| South Korea | |||
| Australia | |||
| Rest of Asia-Pacific | |||
| Middle East and Africa | Middle East | Saudi Arabia | |
| United Arab Emirates | |||
| Rest of Middle East | |||
| Africa | South Africa | ||
| Egypt | |||
| Rest of Africa | |||
| South America | Brazil | ||
| Argentina | |||
| Rest of South America | |||


Key Questions Answered in the Report
How large is the carbon and energy software market in 2025?
The market stands at USD 6.97 billion in 2025 and is set to grow at an 11.56% CAGR through 2030.
Which deployment model dominates current adoption?
Cloud/SaaS commands 61.37% revenue share, reflecting preferences for scalable, real-time data integration.
What segment is expanding fastest by application?
Supply-Chain Emissions Management is projected to rise at an 11.73% CAGR as firms tackle Scope 3 data gaps.
Which region is expected to grow quickest?
Asia-Pacific will post the highest 11.77% CAGR thanks to manufacturing-driven demand and emerging regulations.
How are vendors responding to stricter regulations?
Providers are embedding XBRL tagging, assurance workflows, and multi-framework templates to streamline compliance.
What is the main restraint limiting adoption?
Divergent ESG taxonomies force multinationals to manage multiple disclosure formats, elevating cost and complexity.
Page last updated on:


