
Emissions Factor Library and Carbon Intelligence Software Market Size and Share
Market Overview
| Study Period | 2020 - 2031 |
|---|---|
| Market Size (2026) | USD 2.19 Billion |
| Market Size (2031) | USD 4.93 Billion |
| Growth Rate (2026 - 2031) | 17.62 % |
| Fastest Growing Market | Asia-Pacific |
| Largest Market | North America |
| Market Concentration | Medium |
Major Players *Disclaimer: Major Players sorted in no particular order Image © Mordor Intelligence. Reuse requires attribution under CC BY 4.0. | |
Emissions Factor Library and Carbon Intelligence Software Market Analysis by Mordor Intelligence
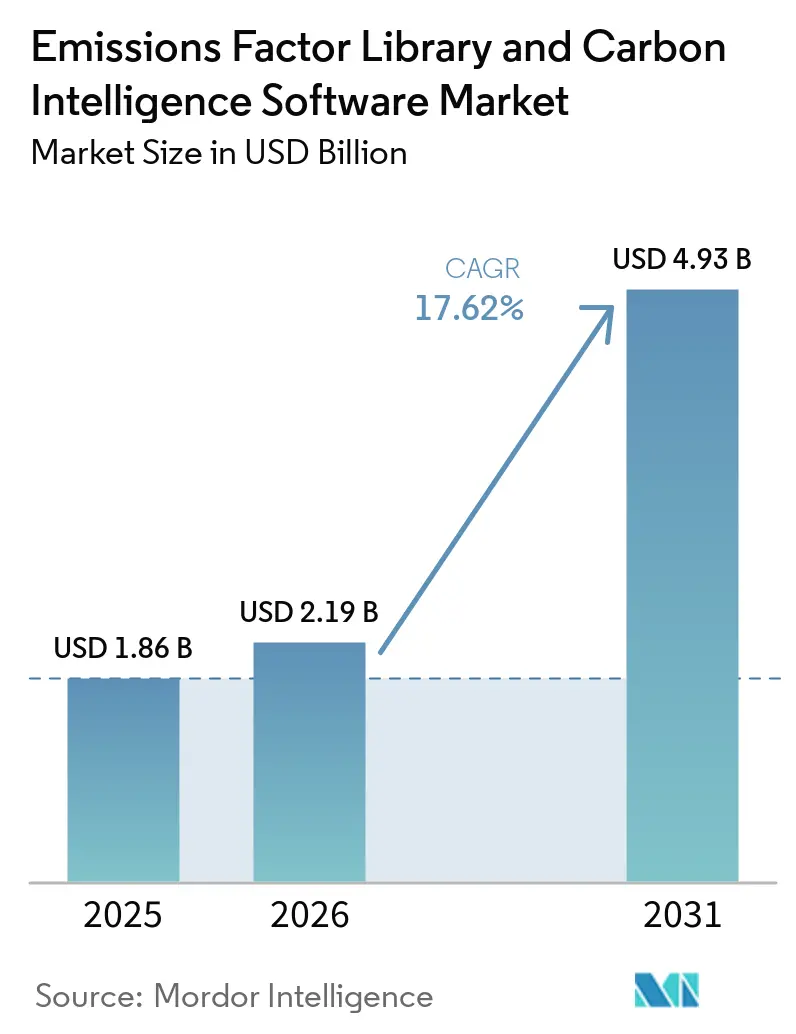
The emissions factor library and carbon intelligence software market size is expected to increase from USD 1.86 billion in 2025 to USD 2.19 billion in 2026 and reach USD 4.93 billion by 2031, growing at a CAGR of 17.62% over 2026 to 2031. Growth is being supported by tighter disclosure obligations, the shift away from spreadsheet-led emissions tracking, and the wider use of enterprise tools that can support audit trails and version control. The carbon accounting software market is also moving closer to core finance and procurement workflows as emissions data becomes part of broader operational and reporting systems. Demand remains strong even as some reporting frameworks narrow direct coverage because large enterprises still need supplier-level information across extended value chains. AI-led automation is also changing buying priorities in the carbon accounting software market because companies want faster activity mapping, better factor selection, and less manual data preparation. The result is a market that is still expanding on compliance demand, while also gaining a second layer of adoption tied to decision support, operational planning, and assurance readiness.
Key Report Takeaways
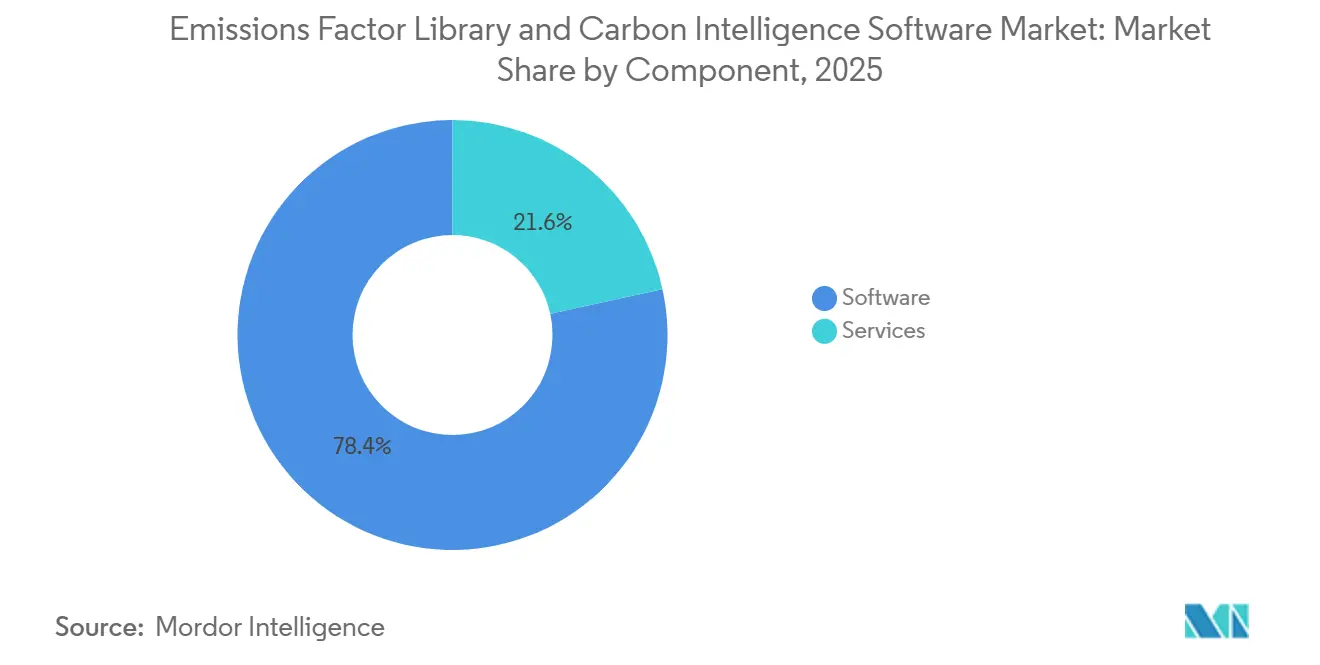
- By component, software held 78.41% of the emissions factor library and carbon intelligence software market share in 2025, while services are projected to expand at a 19.67% CAGR through 2031.
- By deployment, cloud-based held 69.94% revenue share in 2025, while hybrid is expected to grow at an 18.83% CAGR from 2026 to 2031.
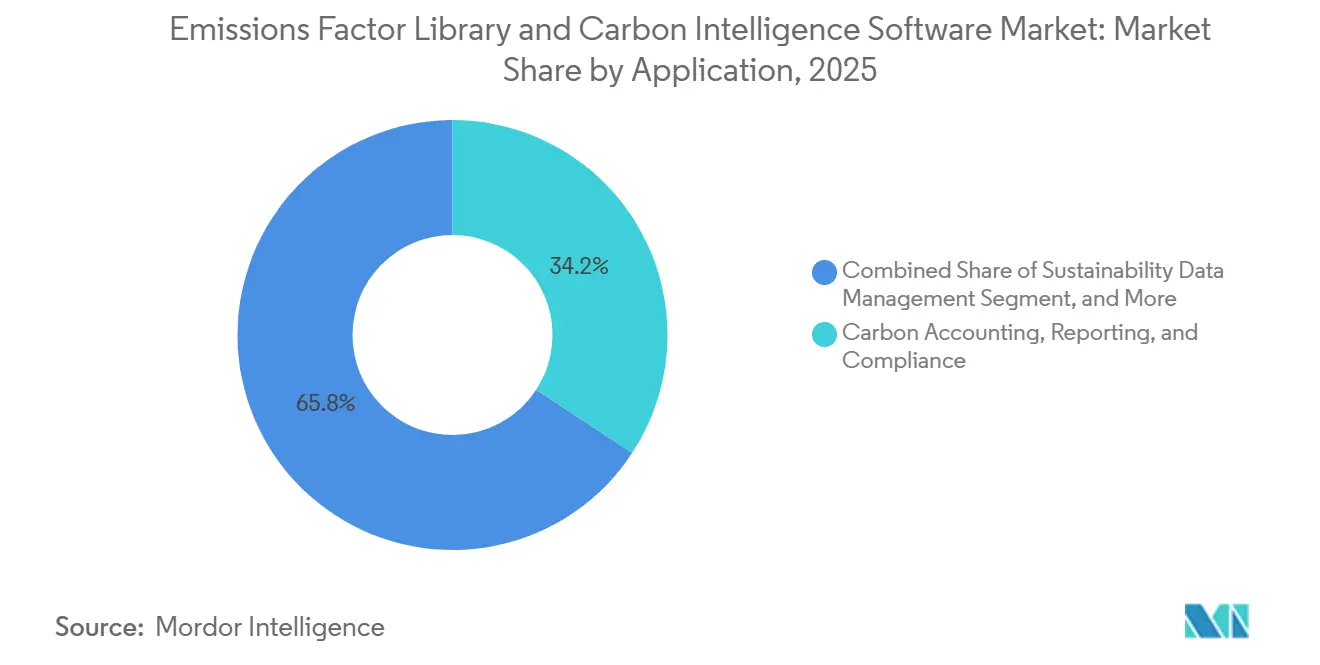
- By application, carbon accounting, reporting, and compliance accounted for 34.23% share of the carbon accounting software market size in 2025, while emissions factor library management is projected to expand at a 23.77% CAGR through 2031.
- By end-user industry, manufacturing accounted for 36.62% of revenue share in 2025, while BFSI is expected to record the highest CAGR of 21.19% through 2031.
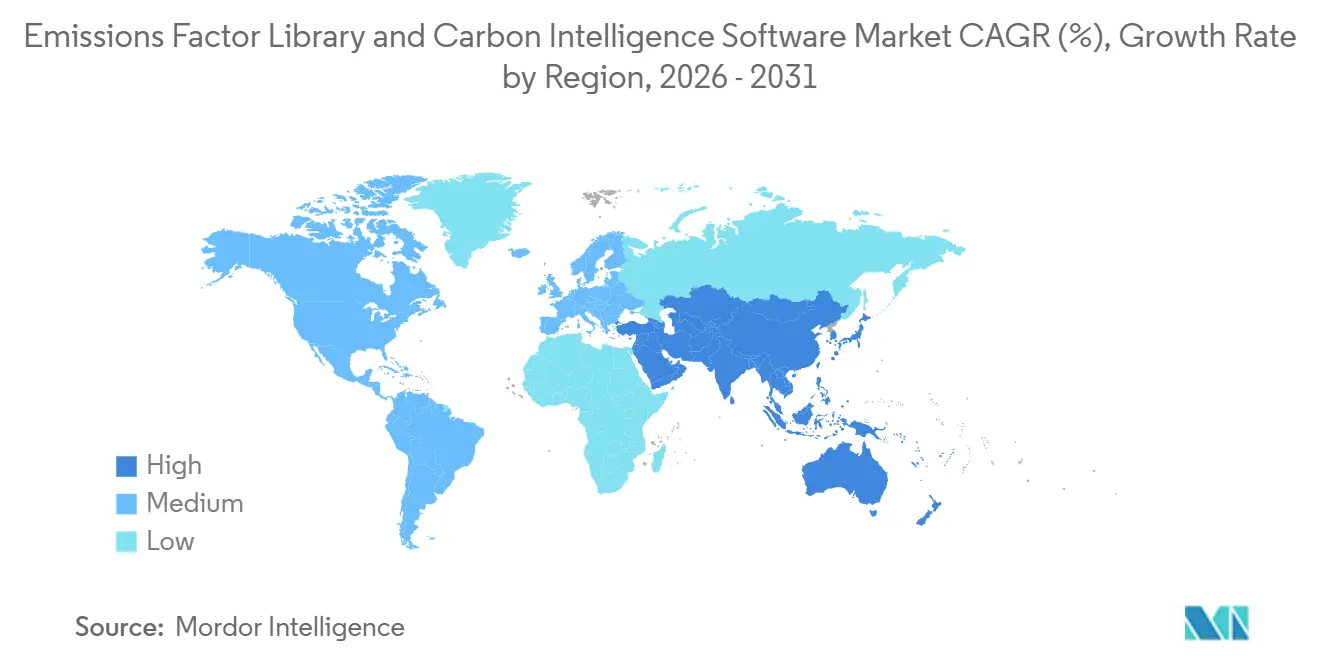
- By geography, North America held 36.44% of the emissions factor library and carbon intelligence software market share in 2025, while Asia-Pacific is projected to grow at a 22.81% CAGR through 2031.
Note: Market size and forecast figures in this report are generated using Mordor Intelligence’s proprietary estimation framework, updated with the latest available data and insights as of January 2026.
Market Trends and Insights
Drivers Impact Analysis of Emissions Factor Library and Carbon Intelligence Software Market*
| DRIVER | (~) % IMPACT ON CAGR FORECAST | GEOGRAPHIC RELEVANCE | IMPACT TIMELINE |
|---|---|---|---|
| Mandatory Climate Disclosure and Audit Readiness | +5.3% | Global, with high intensity in North America, Europe, Australia, and Japan | Short term (≤ 2 years) |
| Scope 3 Data Quality Pressure Across Supplier Networks | +3.8% | Global, with early gains in North America and Europe, followed by Asia-Pacific, Middle East, and Africa | Medium term (2-4 years) |
| Emissions Factor Library Version Control and Traceability Demand | +2.9% | Global, concentrated in Europe and North America | Medium term (2-4 years) |
| AI-Enabled Activity-to-Factor Matching | +2.2% | Global | Short term (≤ 2 years) |
| Integration With ERP, Procurement, and FinOps Stacks | +1.7% | North America and Europe, with growing relevance in core Asia-Pacific markets | Medium term (2-4 years) |
| Granular Product and Facility Level Decarbonization Planning | +1.2% | Global, with early intensity in Europe and manufacturing-heavy Asia-Pacific markets | Long term (≥ 4 years) |
| Source: Mordor Intelligence | |||
Mandatory Climate Disclosure and Audit Readiness
Mandatory disclosure remains the strongest near-term trigger for the emissions factor library and carbon intelligence software market because reporting deadlines create a direct need for structured data collection and documented calculation methods. The pressure is not limited to publishing emissions totals, because assurance requirements also require traceable records that auditors can review across source data, methodologies, and emissions factors. This is pushing the emissions factor library and carbon intelligence software market toward platforms with stronger audit logs, controlled workflows, and clearer linkage to GHG accounting standards. The role of validation and verification has also become more important as ISO 14064-3 continues to shape how assurance work is carried out in practice.[1] As a result, buyers in the emissions factor library and carbon intelligence software market are no longer looking only for disclosure outputs, they are also looking for systems that can stand up to limited assurance and future upgrades in reporting scrutiny.
Scope 3 Data Quality Pressure Across Supplier Networks
Scope 3 emissions continue to reshape software demand because supplier and value chain emissions often make up the largest part of a company’s footprint. Companies are expanding reporting across all 3 emissions scopes, but supplier data availability and internal data quality remain major barriers in day-to-day implementation. This is moving the emissions factor library and carbon intelligence software market away from narrow disclosure tools and toward systems that can support supplier engagement, source-level evidence, and more controlled allocations. Proposed revisions to Scope 3 guidance are also making generic spend-based approaches less durable, which increases the need for primary supplier data and stronger data governance. In the emissions factor library and carbon intelligence software market, this favors vendors that can connect data collection, factor management, and workflow control in a single environment.
Emissions Factor Library Version Control and Traceability Demand
Emissions factor management is becoming a core buying criterion in the emissions factor library and carbon intelligence software market because companies now need to show not only what number was reported, but also which factor was used, when it was applied, and how that choice was governed. That shift is especially visible in the fast growth of factor library tools, which are being adopted as compliance records rather than optional back-end utilities. The emissions factor library and carbon intelligence software market is responding to this need with more structured factor repositories, better lineage controls, and clearer links between activity data and the factor version used in each calculation. IBM’s Envizi Emissions API was launched to embed GHG Protocol-aligned calculations and managed factor data into other enterprise systems while retaining methodology traceability.[2] As assurance expectations rise, factor governance is turning into a baseline requirement for the emissions factor library and carbon intelligence software market rather than an advanced feature reserved for large deployments.
AI-Enabled Activity-to-Factor Matching
AI has become one of the clearest competitive levers in the emissions factor library and carbon intelligence software market because manual mapping of large Scope 3 datasets is slow, inconsistent, and expensive. Vendors are now using AI to reduce time spent on cleaning records, classifying activities, and connecting source data to appropriate emissions factors. Watershed said its new AI agents cut time to actionable sustainability data by 80% across test customers, while reducing data cleaning work that previously took months to minutes. SAP also introduced a Footprint Optimization Agent that reduced carbon simulation time from 1 day to 20 minutes in its demonstration of operational decarbonization workflows. In the emissions factor library and carbon intelligence software market, this is shifting vendor competition toward practical automation, workflow speed, and the ability to support both reporting and operational decisions from the same data foundation.
Restraints Impact Analysis of Emissions Factor Library and Carbon Intelligence Software Market*
| RESTRAINT | (~) % IMPACT ON CAGR FORECAST | GEOGRAPHIC RELEVANCE | IMPACT TIMELINE |
|---|---|---|---|
| Fragmented and Inconsistent Emissions Factor Methodologies | -2.6% | Global, with highest impact in North America and Europe where multiple frameworks overlap | Medium term (2-4 years) |
| Low Quality Supplier Activity Data for Scope 3 Mapping | -1.9% | Global, with strongest friction in South America, the Middle East, and Africa | Medium term (2-4 years) |
| High Implementation Burden for Midmarket Buyers | -1.4% | North America and Europe | Short term (≤ 2 years) |
| Limited Assured Factor Coverage for Niche Materials and Emerging Markets | -0.8% | Core Asia-Pacific, the Middle East, Africa, and niche manufacturing sub-sectors globally | Long term (≥ 4 years) |
| Source: Mordor Intelligence | |||
Fragmented and Inconsistent Emissions Factor Methodologies
The emissions factor library and carbon intelligence software market still faces friction from the overlap between GHG Protocol, ISO 14064, PCAF, ESRS-linked reporting needs, and sector-specific methods. Vendors must keep calculation engines aligned with more than one framework, while also helping customers report a single emissions inventory across different compliance settings. This increases product complexity and makes standard revisions more disruptive for both suppliers and buyers in the emissions factor library and carbon intelligence software market. It also creates a heavier burden for midmarket users that do not have internal technical staff focused on methodology choices, controls, and periodic updates. The result is that methodology fragmentation slows adoption in parts of the emissions factor library and carbon intelligence software market where buyers need simple tools but face complex disclosure expectations.
Low Quality Supplier Activity Data for Scope 3 Mapping
Supplier data quality remains one of the clearest constraints on the emissions factor library and carbon intelligence software markets, as software cannot fully address the lack of usable upstream activity information. Many supply chains still depend on small- and midsize suppliers that lack systems for product-level, site-level, or usage-based carbon data. This raises implementation effort because enterprises often need supplier engagement programs alongside software deployment just to make the platform usable at the required level of detail. Sphera’s 2025 Scope 3 report showed that supplier data availability was the top challenge for 79% of respondents, while 62% also cited internal data quality as a major barrier. In the emissions factor library and carbon intelligence software market, this keeps total ownership costs high and slows advanced Scope 3 adoption in regions where digital supplier infrastructure remains uneven.
*Our forecasts treat driver/restraint impacts as directional, not additive. The impact forecasts reflect baseline growth, mix effects, and variable interactions.
Emissions Factor Library and Carbon Intelligence Software Market Segment Analysis
By Component:
Software Leads Revenue While Services Gain Strategic WeightSoftware held 78.41% of total revenue in 2025, which kept this part of the emissions factor library and carbon intelligence software market centered on platform subscriptions and enterprise software deployments. The software category remained dominant because most large buyers still prefer systems that can bring carbon data into finance, procurement, and supply chain workflows with stronger controls. In the carbon accounting software industry, software also benefits from higher switching costs once a platform is connected to ERP and reporting processes. This keeps the revenue base stable even as buyers ask for more implementation help and domain support.
Services are projected to grow at a 19.67% CAGR from 2026 to 2031, which makes it the fastest-moving component in the emissions factor library and carbon intelligence software market. Demand is rising because inventory design, assurance preparation, and methodology alignment are difficult for companies that lack trained in-house teams. The emissions factor library and carbon intelligence software market is, therefore, seeing more managed service models that combine access to software with advisory and support layers. That pattern was visible when Normative introduced Carbon Inventory Managed Services in 2026 and reported more than 1,000 hours of dedicated GHG Protocol-certified client support in the first 6 weeks. Over time, this should shift revenue mix toward bundled offerings without displacing the central role of software platforms.
By Deployment:
Cloud Stays Largest While Hybrid Gains GroundCloud-Based deployment held 69.94% of revenue in 2025, which reflected the SaaS-led structure of the emissions factor library and carbon intelligence software market and the need to process large volumes of activity data across sites and suppliers. Cloud systems remain attractive because they are easier to scale, update, and connect to external data flows used in disclosure and audit preparation. This is especially relevant in the emissions factor library and carbon intelligence software market, where reporting cycles are recurring, and data volumes are still rising. Buyers also continue to value the lower setup burden of cloud tools when compared with fully local implementations.
Hybrid deployment is expected to grow at an 18.83% CAGR from 2026 to 2031, and that growth reflects a more practical balance between scale and control. Multinational companies often need cloud-based analytics, but they also need to keep some data within local or existing enterprise environments because of internal policy or jurisdiction-specific data handling needs. The emissions factor library and carbon intelligence software market is responding with architectures that allow calculations, data custody, and reporting outputs to sit across more than one environment. Sweep’s 2026 launch of an AWS-integrated cloud emissions measurement solution showed how vendors are trying to unify cloud data flows within traceable reporting structures. This should help hybrid deployments expand further as assurance and data lineage requirements become stricter.
By Application:
Compliance Holds the Revenue Base While Factor Tools Expand FastestCarbon Accounting, Reporting, and Compliance held the largest application share at 34.23% in 2025, which placed the main spending focus of the emissions factor library and carbon intelligence software market on inventory building and disclosure workflows. This category remains the revenue anchor because most companies still start with the need to measure Scope 1, 2, and 3 emissions and produce reporting outputs for formal or investor-facing use. The emissions factor library and carbon intelligence software market continues to attract buyers first through compliance needs, then through broader data and planning use cases. Emissions Tracking and Monitoring and Sustainability Data Management also remain important because they help companies move from periodic reporting to more regular control over emissions-related records and activity flows.
Emissions Factor Library Management is projected to grow at a 23.77% CAGR through 2031, making it the fastest-growing application in the emissions factor library and carbon intelligence software market. That pace reflects rising demand for factor provenance, version history, and consistent linkage between calculation logic and disclosed values. The emissions factor library and carbon intelligence software market is also seeing stronger interest in analytics and modeling tools that can support scenario testing before operational decisions are made. SAP’s Footprint Optimization Agent and IBM’s Envizi Emissions API both point to that shift by linking calculations more closely to planning and operational systems.[3] As a result, application demand is broadening beyond disclosure output toward governed data infrastructure and decision support.

By End-User Industry:
Manufacturing Holds the Lead While BFSI Sets the Growth PaceManufacturing held 36.62% of revenue in 2025, which made it the largest end-user segment in the emissions factor library and carbon intelligence software market. Its leading position reflects complex direct emissions, broad upstream and downstream supply chain exposure, and the need for product-level carbon data in regulated trade and customer settings. The emissions factor library and carbon intelligence software market is especially relevant to manufacturers because carbon data often has to connect with production, sourcing, and logistics systems rather than sit in a separate reporting tool. That need is pushing vendors to position emissions management closer to plant and operational data.
BFSI is projected to grow at a 21.19% CAGR through 2031, making it the fastest-growing end-user segment in the emissions factor library and carbon intelligence software market. Financial institutions face a different challenge because financed emissions can far exceed their own operational footprint, which raises demand for portfolio-level methods and climate risk tooling. The carbon accounting software industry is also seeing growing interest from retail, healthcare, telecommunications, and public sector users as disclosure expectations widen and customer pressure becomes more formalized. IFS launched IFS Zero in 2026 to connect emissions measurement directly to operational systems in asset-intensive sectors, which shows how end-user solutions are becoming more specialized.[4] This should keep sector-specific product design important as the user base becomes broader and more varied.
Geography Analysis
North America Emissions Factor Library and Carbon Intelligence Software Market
North America held 36.44% revenue share in 2025, which made it the largest regional block in the emissions factor library and carbon intelligence software market. The region benefits from a high concentration of large enterprises that already run mature reporting, procurement, and finance systems, which makes platform integration easier. California’s disclosure timetable is also reinforcing near-term buying urgency among companies that need structured Scope 1 and Scope 2 reporting in 2026, with Scope 3 requirements following after that. In the emissions factor library and carbon intelligence software market, this gives North America a strong mix of compliance demand and enterprise readiness.
APAC Emissions Factor Library and Carbon Intelligence Software Market
Asia-Pacific is projected to grow at a 22.81% CAGR through 2031, which makes it the fastest-growing region in the emissions factor library and carbon intelligence software market. Growth is being supported by mandatory or phased disclosure moves in Japan, Australia, Singapore, South Korea, and China, which together widen the regional need for formal carbon data systems. The region also benefits from its role in global manufacturing supply chains because supplier-level emissions requests are moving deeper into Asia-Pacific production networks. This makes the emissions factor library and carbon intelligence software market relevant not only for large listed companies, but also for suppliers serving international customers with Scope 3 reporting needs. India is also adding momentum through its Business Responsibility and Sustainability Reporting framework, which is supporting more structured interest in GHG inventory tools.
EMEA and South America Emissions Factor Library and Carbon Intelligence Software Market
Europe remained the second-largest regional market in 2025, with demand centered on large enterprises that face more advanced climate reporting expectations and assurance needs. Even with the narrowed CSRD scope in 2026, the remaining in-scope companies represent the more procurement-capable part of the buyer base, which supports continued enterprise-grade spending. South America remains an emerging opportunity, with adoption concentrated in extractive, agricultural, and consumer-facing sectors that are tied to multinational reporting expectations. The Middle East and Africa remain earlier-stage parts of the emissions factor library and carbon intelligence software market, with adoption driven more by national net-zero programs, multinational subsidiaries, and externally linked disclosure needs than by fully mature local demand.
Competitive Landscape
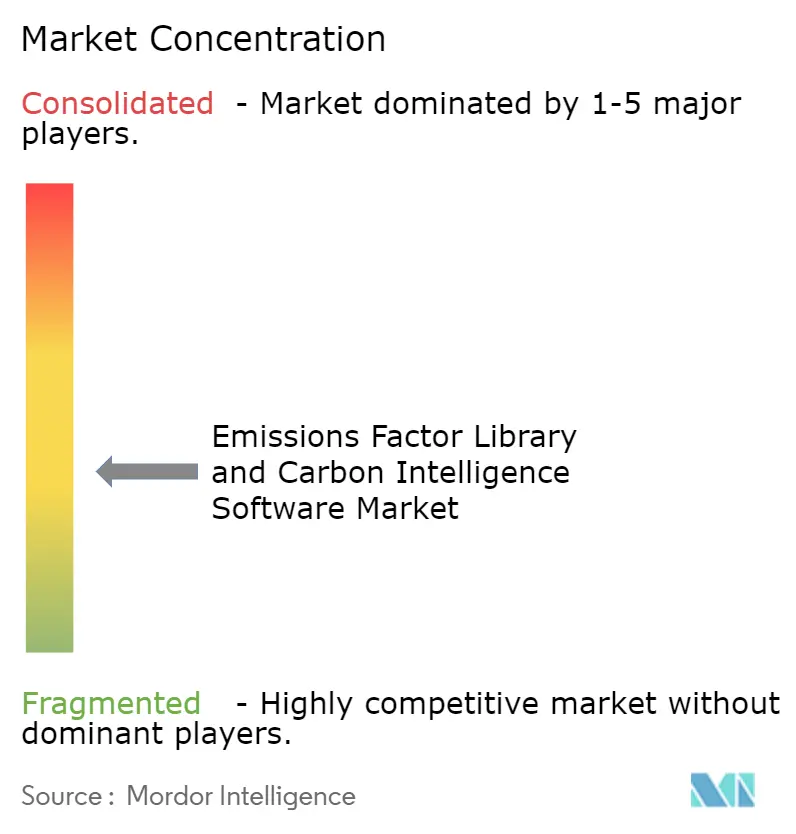
The emissions factor library and carbon intelligence software market remains moderatley fragmented, but competition is increasingly centering on a smaller group of vendors that can combine AI tools, factor governance, and deep enterprise integration. Large software providers are using existing relationships in ERP, finance, and operations to position carbon tools as an extension of systems customers already use. This lowers first-adoption friction and provides the emissions factor library and carbon intelligence software market with a broader route into established enterprise accounts. At the same time, specialist vendors continue to compete by offering faster deployment, stronger Scope 3 workflows, or more focused carbon expertise.
Strategic product moves in 2026 showed how the emissions factor library and carbon intelligence software market is shifting from basic reporting toward embedded operational use. IBM launched the Envizi Emissions API to enable emissions calculations and managed factor data to be embedded into third-party systems without a full platform migration. SAP introduced new sustainability AI agents, including a Footprint Optimization Agent aimed at faster carbon simulation and more direct use in procurement and production decisions. IFS launched IFS Zero as an emissions operating system for asset-intensive sectors, placing carbon measurement closer to production and field operations data. Watershed also pushed the emissions factor library and carbon intelligence software market toward AI-led workflows through new agents designed to reduce cleaning and analysis time for sustainability data.
The competitive pattern also reflects a move toward more complete workflow coverage, including supplier data collection, operational integrations, and factor traceability. The emissions factor library and carbon intelligence software market is rewarding vendors that can support both compliance delivery and ongoing decarbonization planning from a common database. Consolidation activity through 2025 and 2026 also suggests that vendors want broader product portfolios and stronger regional reach, especially in Europe and the midmarket segment. Overall, the emissions factor library and carbon intelligence software market is still open enough for specialists to grow, but the strongest positions are forming around platforms that can demonstrate audit readiness, deep integration, and practical automation at scale.
Emissions Factor Library and Carbon Intelligence Software Industry Leaders
-
Salesforce, Inc.
-
Workiva Inc.
-
Persefoni AI, Inc.
-
Watershed Technology, Inc.
-
SAP SE
- *Disclaimer: Major Players sorted in no particular order
Emissions Factor Library and Carbon Intelligence Software Market Companies Covered in this Report
- Salesforce, Inc.
- Workiva Inc.
- Persefoni AI, Inc.
- Watershed Technology, Inc.
- SAP SE
- IBM Corporation
- Microsoft Corporation
- ENGIE Impact
- Schneider Electric SE
- Sphera Solutions, Inc.
- Cority Software Inc.
- Normative AB
- Sweep SAS
- Position Green AB
- Greenly SAS
- Enablon North America Corporation
- Diligent Corporation
- IsoMetrix Software LLC
- Emitwise Ltd.
Recent Industry Developments in Emissions Factor Library and Carbon Intelligence Software Market
- June 2026: Sweep, an AWS ISV-Accelerate partner, built a cloud emissions measurement solution on the AWS Sustainability service, enabling enterprise customers to automatically consolidate cloud Scope 1, 2, and 3 emissions data within Sweep's sustainability intelligence platform alongside full operational data, with outputs routed directly to external audit processes under a single traceable methodology.
- May 2026: SAP announced at its Sapphire 2026 conference plans to make new sustainability AI agents generally available by end-2026, including a Footprint Optimization Agent that reduces carbon simulation time from approximately 1 day to 20 minutes and enables real-time "what-if" testing for procurement and production decarbonization decisions, ESG data derived from industry averages can vary by 30-40% from actual values, making simulation capability a material margin protection tool.
- May 2026: IFS launched IFS Zero, an agentic Emissions Operating System for asset-intensive industries including manufacturing, aerospace, oil and gas, and transport, natively integrated with IFS Cloud 26R1 and enabling Scope 1, 2, and 3 measurement with GHG Protocol-aligned audit trails drawn directly from operational systems without a separate extraction layer.
- April 2026: IBM announced general availability of the IBM Envizi Emissions API, enabling organizations, developers, and software providers to embed GHG Protocol-aligned emissions calculations, managed factor data, and Envizi methodologies into existing enterprise systems and third-party products without requiring full platform migration.
- April 2026: Watershed launched Watershed agents at San Francisco Climate Week, including AI-powered data cleaning and analysis agents that reduced time to actionable sustainability data by 80% across test customers and completed 5-hour data cleaning projects in approximately 20 minutes, Watershed also launched a Sustainability AI Fellowship, an 8-week program, to address the low AI adoption rate of 43% among sustainability practitioners.
Global Emissions Factor Library and Carbon Intelligence Software Market Report Scope
Emissions Factor Library and Carbon Intelligence Software are digital platforms designed to standardize emissions factors and provide advanced analytics. These tools enable businesses to measure, monitor, and manage greenhouse gas emissions across their operations, supply chains, and product lifecycles. By incorporating carbon accounting, emissions tracking, and sustainability data management into enterprise systems, they support regulatory compliance, ensure transparent reporting, and deliver AI-driven insights for scenario analysis and emissions reduction strategies.
The Emissions Factor Library and Carbon Intelligence Software Market Report is Segmented by Component (Software, and Services), Deployment (Cloud-Based, On-Premises, and Hybrid), Application (Carbon Accounting, Reporting, and Compliance, Emissions Tracking and Monitoring, Emissions Factor Library Management, and Sustainability Data Management), End User Industry (Manufacturing, Energy and Utilities, Transportation and Logistics, Banking, Financial Services, and Insurance (BFSI), Retail and Consumer Goods, Healthcare and Life Sciences, Information Technology and Telecommunications, Government and Public Sector, and Other End User Industries), and Geography (North America, South America, Europe, Asia-Pacific, and Middle East and Africa). The Market Forecasts are Provided in Terms of Value (USD).
Segmentation Overview
| Software |
| Services |
| Cloud-Based |
| On-Premises |
| Hybrid |
| Carbon Accounting, Reporting, and Compliance |
| Emissions Tracking and Monitoring |
| Emissions Factor Library Management |
| Sustainability Data Management |
| Carbon Intelligence and Analytics |
| Manufacturing |
| Energy and Utilities |
| Transportation and Logistics |
| Banking, Financial Services, and Insurance (BFSI) |
| Retail and Consumer Goods |
| Healthcare and Life Sciences |
| Information Technology and Telecommunications |
| Government and Public Sector |
| Other End User Industries |
| North America | United States |
| Canada | |
| Mexico | |
| South America | Brazil |
| Argentina | |
| Chile | |
| Rest of South America | |
| Europe | Germany |
| United Kingdom | |
| France | |
| Italy | |
| Spain | |
| Rest of Europe | |
| Asia-pacific | China |
| Japan | |
| India | |
| Australia | |
| South Korea | |
| Singapore | |
| Rest of Asia-pacific | |
| Middle East | Saudi Arabia |
| United Arab Emirates | |
| Turkey | |
| Rest of Middle East | |
| Africa | South Africa |
| Egypt | |
| Nigeria | |
| Rest of Africa |
| By Component | Software | |
| Services | ||
| By Deployment | Cloud-Based | |
| On-Premises | ||
| Hybrid | ||
| By Application | Carbon Accounting, Reporting, and Compliance | |
| Emissions Tracking and Monitoring | ||
| Emissions Factor Library Management | ||
| Sustainability Data Management | ||
| Carbon Intelligence and Analytics | ||
| By End User Industry | Manufacturing | |
| Energy and Utilities | ||
| Transportation and Logistics | ||
| Banking, Financial Services, and Insurance (BFSI) | ||
| Retail and Consumer Goods | ||
| Healthcare and Life Sciences | ||
| Information Technology and Telecommunications | ||
| Government and Public Sector | ||
| Other End User Industries | ||
| By Geography | North America | United States |
| Canada | ||
| Mexico | ||
| South America | Brazil | |
| Argentina | ||
| Chile | ||
| Rest of South America | ||
| Europe | Germany | |
| United Kingdom | ||
| France | ||
| Italy | ||
| Spain | ||
| Rest of Europe | ||
| Asia-pacific | China | |
| Japan | ||
| India | ||
| Australia | ||
| South Korea | ||
| Singapore | ||
| Rest of Asia-pacific | ||
| Middle East | Saudi Arabia | |
| United Arab Emirates | ||
| Turkey | ||
| Rest of Middle East | ||
| Africa | South Africa | |
| Egypt | ||
| Nigeria | ||
| Rest of Africa | ||
Key Questions Answered in the Report
What is the current size of the emissions factor library and carbon intelligence software space and where is it heading by 2031?
The emissions factor library and carbon intelligence software market size stood at USD 1.86 billion in 2025, reached USD 2.19 billion in 2026, and is forecast to reach USD 4.93 billion by 2031, at a CAGR of 17.62% over 2026 to 2031.
What is driving adoption of carbon accounting platforms in 2026?
The biggest drivers are mandatory climate disclosure, stronger audit readiness needs, and the move from spreadsheet-based emissions tracking to governed enterprise systems.
Which application area is expanding the fastest through 2031?
Emissions Factor Library Management is the fastest-growing application, with a projected 23.77% CAGR through 2031.
Which end-user group is growing the quickest?
BFSI is the fastest-growing end-user vertical, with a projected 21.19% CAGR through 2031 because financed emissions create a large reporting burden.
Which region leads today and which one is growing the fastest?
North America led with a 36.44% revenue share in 2025, while Asia-Pacific is projected to post the fastest growth at a 22.81% CAGR through 2031.
Why are emissions factor tools becoming more important?
Buyers increasingly need factor version control, lineage, and transparency because assurance and disclosure processes now require clearer evidence on how emissions figures were calculated.