Threat Modeling Tools Market Size and Share
Market Overview
| Study Period | 2020 - 2031 |
|---|---|
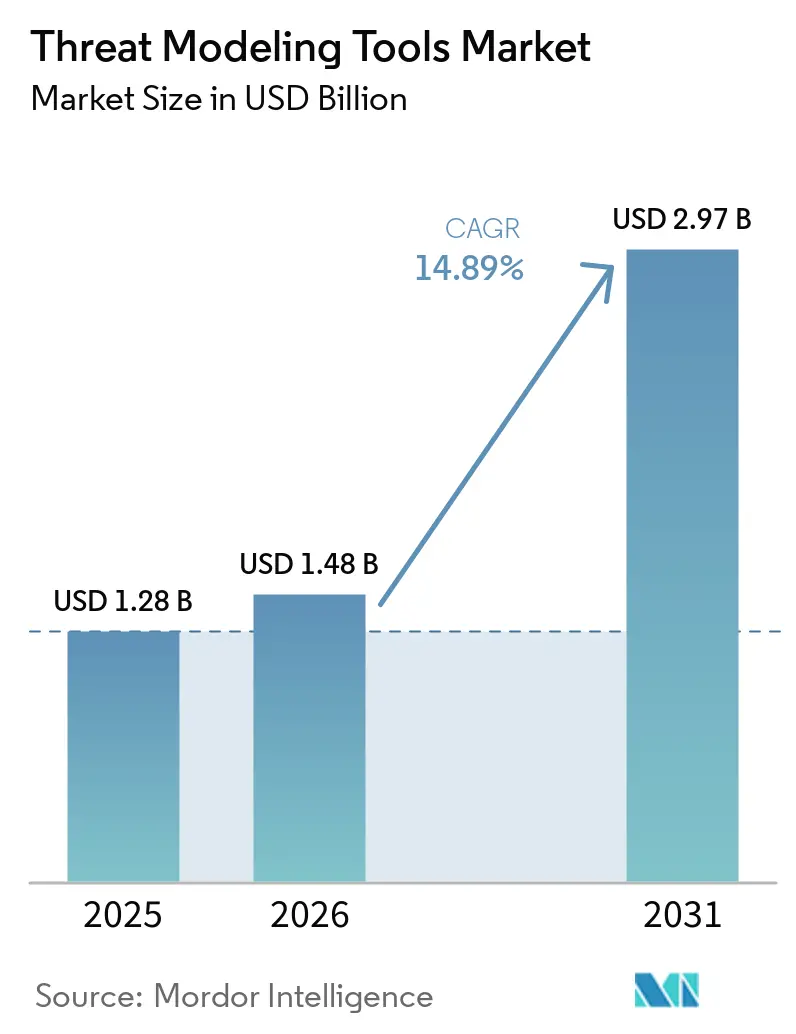
| Market Size (2026) | USD 1.48 Billion |
| Market Size (2031) | USD 2.97 Billion |
| Growth Rate (2026 - 2031) | 14.89% CAGR |
| Fastest Growing Market | Asia-Pacific |
| Largest Market | North America |
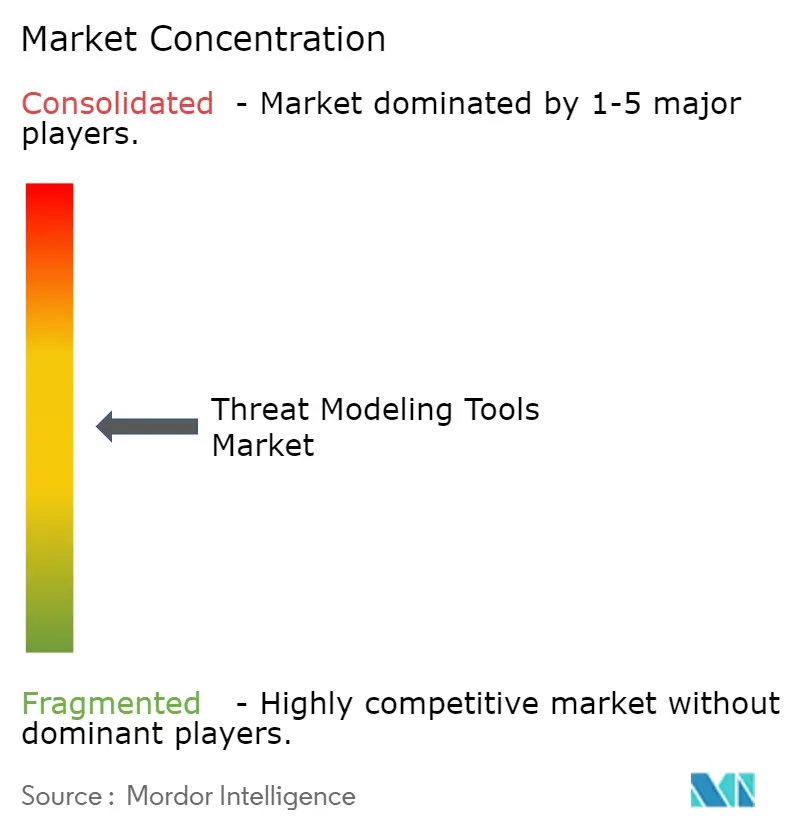
| Market Concentration | Medium |
Major Players *Disclaimer: Major Players sorted in no particular order Image © Mordor Intelligence. Reuse requires attribution under CC BY 4.0. | |
Threat Modeling Tools Market Analysis by Mordor Intelligence
The threat modeling tools market size was valued at USD 1.28 billion in 2025 and is estimated to grow from USD 1.48 billion in 2026 to reach USD 2.97 billion by 2031, at a CAGR of 14.89% during the forecast period (2026-2031). Regulatory deadlines in the European Union and the United States are shortening adoption cycles, so procurement is shifting from periodic consulting toward year-round platform subscriptions. Enterprises are embedding threat modeling earlier in software development workflows to satisfy self-attestation clauses, which is accelerating demand for continuous, automation-ready solutions. Cloud-native pipelines, rising DevSecOps maturity, and a sharp increase in software supply chain exploits are sustaining double-digit expansion even as spending on other application security categories plateaus. Competitive intensity is increasing as vendors add artificial-intelligence-driven discovery and real-time model validation to differentiate, while buyers that once favored on-premise audits now prioritize integrations with continuous integration and continuous deployment systems to reduce remediation cycle time.
Key Report Takeaways
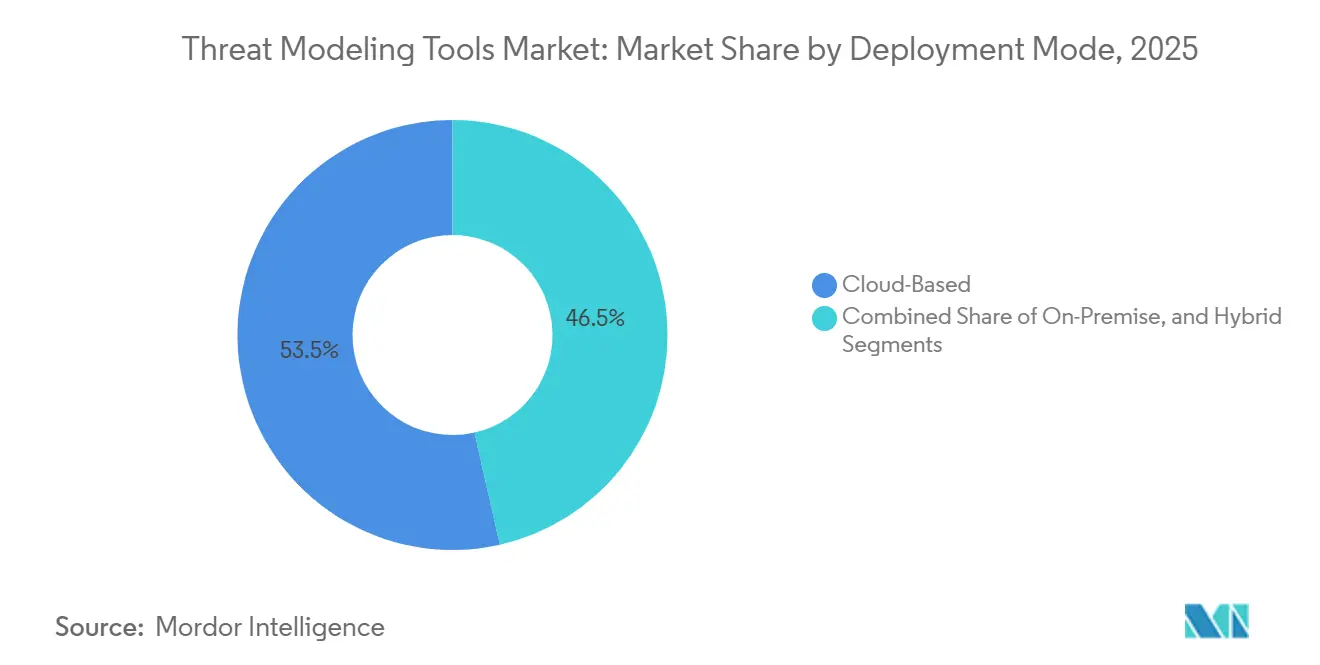
- By deployment mode, cloud-based delivery captured 53.52% of the 2025 revenue of the threat modeling tools market, while hybrid deployment is projected to advance at a 15.44% CAGR to 2031, reflecting regulated sectors’ move to balance sovereignty and agility.
- By tool type, enterprise commercial platforms led with 43.41% of the 2025 threat modeling tools market share, whereas threat-as-code and command-line tools are forecast to record a 15.32% CAGR through 2031.
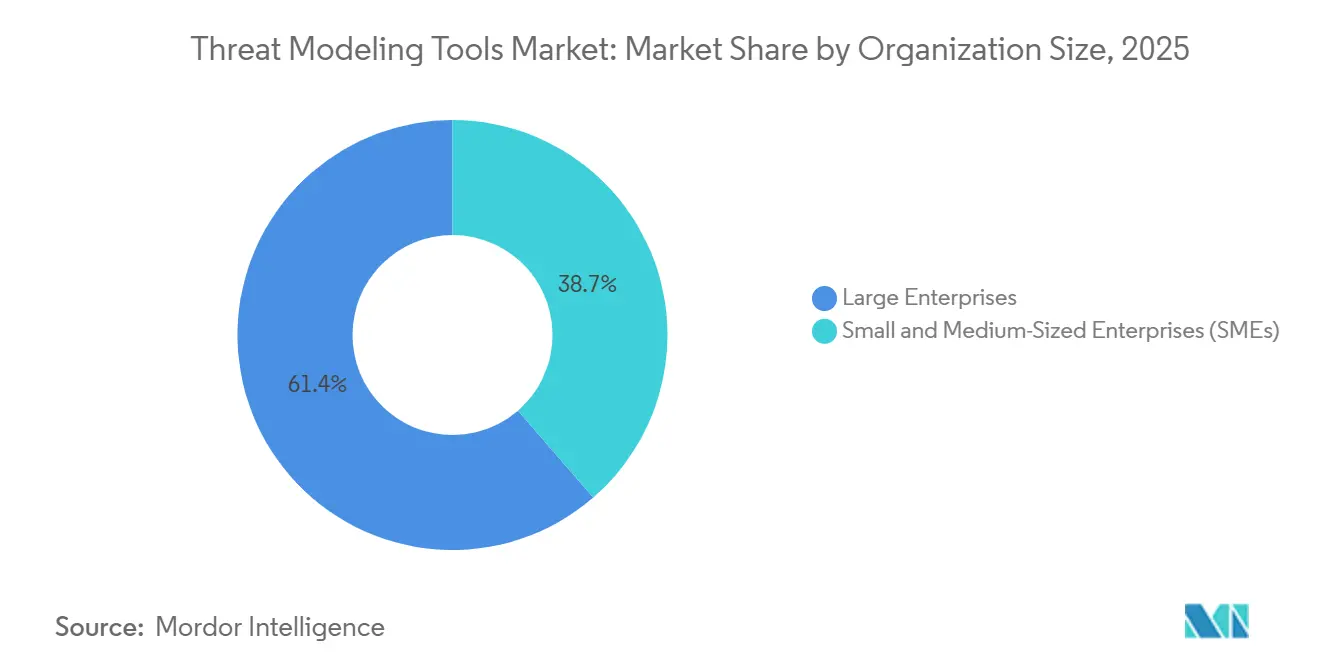
- By organization size, large enterprises generated 61.35% of 2025 sales of the threat modeling tools market, yet SMEs are expected to expand at a 16.02% CAGR as regulatory flow-down clauses reach smaller vendors.
- By end-user vertical, information technology and telecommunications held 27.40% of the 2025 threat modeling tools market size, while healthcare and life sciences are poised to grow at a 15.97% CAGR on the back of ransomware-driven modernization.
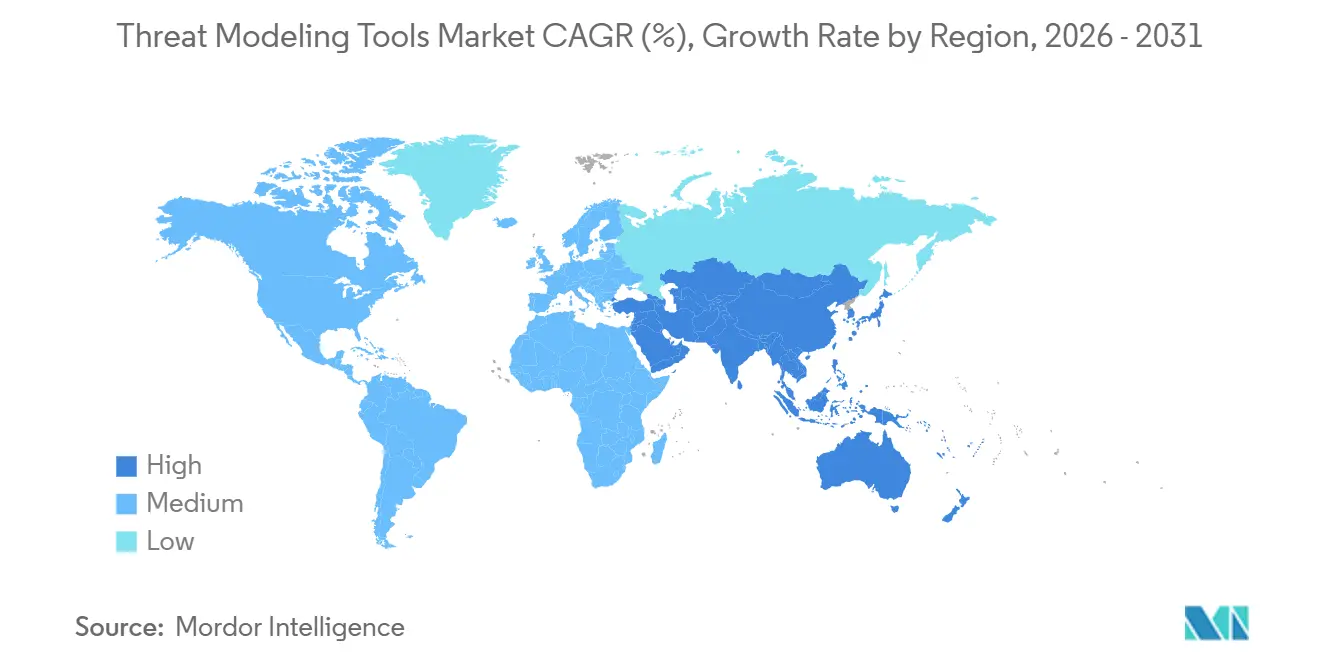
- By geography, North America commanded 39.11% of 2025 revenue of the threat modeling tools market, whereas Asia-Pacific is set to climb at a 16.13% CAGR amid new cybersecurity statutes in China, India, and Japan.
Note: Market size and forecast figures in this report are generated using Mordor Intelligence’s proprietary estimation framework, updated with the latest available data and insights as of January 2026.
Global Threat Modeling Tools Market Trends and Insights
Drivers Impact Analysis*
| Driver | (~) % Impact on CAGR Forecast | Geographic Relevance | Impact Timeline |
|---|---|---|---|
| Growing Regulatory Mandates for Secure Software Development | +3.2% | Global with early enforcement in EU and North America | Short term (≤ 2 years) |
| Surge in Cyberattacks Targeting Software Supply Chains | +2.8% | Global | Short term (≤ 2 years) |
| Shift-Left Security Adoption in DevSecOps Pipelines | +2.5% | North America and EU core, expanding to APAC | Medium term (2-4 years) |
| Increasing Integration with AI-Driven Code Generation Platforms | +2.1% | Global, concentrated in North America and APAC tech hubs | Medium term (2-4 years) |
| Rise of Infrastructure-as-Code Threat Modeling Demand | +1.8% | Global, led by cloud-native adopters | Medium term (2-4 years) |
| Adoption of Threat Modeling Standards in Safety-Critical IoT Systems | +1.4% | EU and APAC manufacturing clusters, North America automotive | Long term (≥ 4 years) |
| Source: Mordor Intelligence | |||
Growing Regulatory Mandates For Secure Software Development
Governments are converting voluntary best practices into binding procurement criteria. The European Union’s Cyber Resilience Act compels digital-product makers to document threat models across the product lifecycle, with full enforcement slated for September 2027. In the United States, Executive Order 14144 obliges federal software suppliers to self-attest against the NIST Secure Software Development Framework, elevating threat modeling to a baseline requirement. Brazil’s draft Cybersecurity Legal Framework would create a national authority empowered to bar non-conforming vendors from public contracts. Saudi Arabia’s Non-Critical National Infrastructure Cybersecurity Controls extend mandatory threat assessments to firms with as few as six employees. These statutes collectively expand the compliance-driven addressable base for the threat modeling tools market.
Surge In Cyberattacks Targeting Software Supply Chains
High-profile incidents prove that perimeter controls cannot contain transitive dependency risks. In March 2026, attackers back-doored the axios npm package, harvesting credentials from more than 18,000 downstream repositories. The TeamPCP campaign exploited trojanized Python artifacts to compromise build systems across multiple industries. The February 2024 Change Healthcare breach, triggered by compromised third-party credentials, disrupted prescription processing for over 100 million patients. These events are driving companies to adopt platforms that map dependencies, generate attack trees, and validate mitigations continuously, thereby fueling growth of the threat modeling tools market.
Shift-Left Security Adoption In DevSecOps Pipelines
Organizations practicing two-week sprints are embedding threat modeling into backlog grooming to cut rework time. Amazon Web Services released ThreatForest in 2026, an open-source project that uses autonomous agents to scan code, build attack graphs, and suggest mitigations in minutes.[1]AWS Samples, “ThreatForest Agentic Attack Tree Generator,” AWS.AMAZON.COM Cisco paired its Foundation-Sec-8B-1.1-Instruct language model with Splunk AI Assistant to translate alerts into MITRE ATT&CK context and remediation steps. Snyk, Codacy, and Cycode now surface insecure AI-generated code patterns inside developer environments. These integrations shorten feedback loops and make always-on threat modeling economically feasible, reinforcing demand within the threat modeling tools market.
Increasing Integration With AI-Driven Code Generation Platformsdels
Generative-AI coding assistants introduce fresh vulnerability classes and an unprecedented volume of code that requires review. Studies show large language models can replicate insecure patterns such as hard-coded credentials and SQL injection.[2]OpenAI, “Codex Security,” OPENAI.COM Tools like Snyk Studio combine static analysis with language-model remediation advice, giving developers threat-aware fixes in real time. Saudi Arabia’s AI Ethics Framework calls for model integrity and transparency, spurring requests for threat models that address data-poisoning and adversarial-input scenarios. As enterprises model machine-learning pipelines alongside traditional applications, platform vendors are broadening coverage, further enlarging the threat modeling tools market.
Restraints Impact Analysis*
| Restraint | (~) % Impact on CAGR Forecast | Geographic Relevance | Impact Timeline |
|---|---|---|---|
| Lack of Skilled Threat Modeling Professionals | -1.2% | Global, acute in APAC and Middle East | Short term (≤ 2 years) |
| High Initial Setup and Integration Costs | -0.9% | Global, especially SMEs | Medium term (2-4 years) |
| Limited Support for Emerging Edge Computing Architectures | -0.6% | Global, industrial and telecom sectors | Long term (≥ 4 years) |
| Fragmented Open-Source Alternatives Diluting Commercial Adoption | -0.5% | Global | Medium term (2-4 years) |
| Source: Mordor Intelligence | |||
Lack Of Skilled Threat Modeling Professionals
The worldwide cybersecurity talent gap exceeds 3.5 million roles, and practitioners who can translate system designs into attack trees are rarer still. Gulf-region employers report that 87% struggle to hire qualified staff, prompting Saudi Arabia to launch programs that aim to train 20,000 specialists by 2030. Because platform automation cannot fully replace expert judgment, staffing shortages dampen adoption velocity, especially for complex operational-technology environments, limiting penetration of the threat modeling tools market.
High Initial Setup And Integration Costs
Enterprises with undocumented monoliths must perform asset discovery, API mapping, and process re-engineering before threat modeling produces value. Brazil’s Central Bank Resolution 538/2025 obliges banks to model authentication flows and isolate PIX payment systems, but implementation demands multi-quarter investments in tooling and training. Small businesses face proportionally higher costs and often lack full-time security staff, so many delay platform purchases or adopt only freemium editions, curbing near-term revenue expansion for the threat modeling tools market.
*Our forecasts treat driver/restraint impacts as directional, not additive. The impact forecasts reflect baseline growth, mix effects, and variable interactions.
Segment Analysis
By Deployment Mode: Hybrid Models Balance Control And Flexibility
Hybrid installations are projected to grow at a 15.44% CAGR to 2031 as regulated entities combine on-premise data custodianship with cloud scalability. Although cloud delivery held 53.52% of the threat modeling tools market share in 2025, national sovereignty rules in Saudi Arabia and the United Arab Emirates are steering workloads toward sovereign-cloud configurations that still rely on remote analytics. The threat modeling tools market size is consequently shifting toward vendors that synchronize models across environments without duplicating data.
Hybrid demand is reinforced by multi-cloud adoption, where assets reside in AWS, Azure, and Google Cloud yet must be evaluated through a single risk lens. Cisco’s Splunk-anchored portfolio enables federated analytics across Amazon S3 and local log stores, illustrating how vendors capture spend when enterprises refuse to centralize sensitive telemetry. As such, hybrid capabilities are becoming a de-facto checklist item in large tenders, sustaining momentum for the threat modeling tools market.


By Tool Type: Declarative Threat-As-Code Meets Continuous Delivery
Enterprise commercial suites retained 43.41% revenue share in 2025, due to policy engines, visual dashboards, and audit trails, yet they face rapid erosion from threat-as-code products that slot directly into Git workflows. The threat modeling tools market size for threat-as-code is expanding because security teams prefer YAML or JSON definitions that evolve with pull requests, aligning governance with the pace of infrastructure-as-code releases.
Open-source initiatives such as Threagile and OWASP Threat Dragon reduce experimental friction, especially for SMEs, whereas paid offerings differentiate through probabilistic attack graphs and quantitative risk scoring.[3]Threagile, “Open-Source Threat Modeling,” THREAGILE.IO Simulation tools like securiCAD model cascading failures across converged information-technology and operational-technology networks, addressing gaps that generic diagramming products cannot. This variety keeps the threat modeling tools market moderately fragmented yet highly innovative.
By Organization Size: Regulatory Flow-Down Ignites SME Demand
Large enterprises accounted for 61.35% of revenue in 2025 due to existing DevSecOps maturity, but SMEs will outpace them with a 16.02% CAGR. Supply-chain clauses now require even six-person software vendors to submit documented threat models, pushing smaller firms toward low-cost or open-source tooling. While the threat modeling tools market share still tilts toward big buyers, bundled managed-service offerings and finance incentives, such as Brazil’s planned public-security fund, are leveling the field.
SMEs nevertheless confront skill shortages, so vendors that embed guided workflows and automated discovery gain traction. Freemium tiers function as land-and-expand vehicles, converting to paid subscriptions once compliance auditors demand granular reporting or role-based access. This upsell dynamic broadens the threat modeling tools market.
By End-User Vertical: Healthcare Converges Patient Safety And Cyber Hygiene
Information technology and telecommunications held 27.40% of 2025 sales, reflecting long-standing secure-development lifecycles. Yet healthcare will log the fastest 15.97% CAGR as ransomware disruptions elevate patient-care risks and regulators tighten HIPAA guidance. The threat modeling tools market size attributable to healthcare thus rises sharply as hospitals model third-party data flows and medical-device firmware.
Financial-services growth is propelled by resolutions mandating isolation of real-time payments and annual intrusion tests, prompting banks to embed threat modeling into risk-management frameworks. Manufacturing, energy, and utilities adopt platforms that integrate industrial-control-system libraries, while government and defense agencies emphasize zero-trust and supply-chain validation. Together, these segments diversify revenue streams across the threat modeling tools market.
Geography Analysis
North America topped revenue at 39.11% in 2025, underpinned by mandatory federal self-attestation forms that list threat modeling as a prerequisite. Most leading vendors are headquartered in the United States, creating a dense local ecosystem of partners and consultants that accelerates platform rollouts. Canada’s Critical Cyber Systems Protection Act extends similar obligations to telecommunications and energy operators, enlarging regional demand.[4]Government of Canada, “Critical Cyber Systems Protection Act,” CANADA.CA
Europe follows with widespread uptake after the Cyber Resilience Act entered into force. Automotive, industrial, and consumer-electronics manufacturers in Germany, France, and Italy now consider threat modeling non-negotiable when placing products on the European market. Conformity-assessment deadlines for 2027 are prompting multi-year platform deals, contributing substantial revenue to the threat modeling tools market.
Asia-Pacific is the fastest-growing territory at a 16.13% CAGR. China amended its Cybersecurity Law to impose secure-development reviews on vendors serving critical infrastructure, India’s Digital Personal Data Protection Act requires risk assessments for data fiduciaries, and Japan’s revamped Cybersecurity Strategy stresses supply-chain assurance. Collectively, these directives open large addressable pools for providers fluent in local compliance dialects.
The Middle East and Africa region is emerging as a hybrid-cloud showcase. Saudi Arabia’s SAR 203 million (USD 54.10 million) investment in DSShield and new licensing for managed security operations centers demonstrate national commitment to local expertise, while the United Arab Emirates earmarked over USD 2 billion for cybersecurity in its current budget. South America is following suit: Brazil’s Resolution 538/2025 and pending cybersecurity bill institutionalize threat modeling for financial and public-sector systems, nudging the threat modeling tools market into fresh territory.

Competitive Landscape
The threat modeling tools market remains moderately fragmented. Pure-play specialists such as ThreatModeler Software, IriusRisk, and Security Compass compete with platform giants Microsoft, Amazon Web Services, and Cisco. Cisco’s USD 28 billion purchase of Splunk in 2024 and its follow-on acquisition of SnapAttack in 2025 illustrate an appetite for end-to-end observability married to threat modeling.
Innovation clusters around artificial-intelligence augmentation. AWS’s open-source ThreatForest showcases autonomous attack-tree generation, while Cisco’s Foundation-Sec-8B-1.1-Instruct model accelerates alert triage and MITRE ATT&CK mapping. Open-source entrants OWASP Threat Dragon and Threagile grow mindshare among developers, forcing commercial vendors to offer free tiers or plug-ins to defend their share.
White-space opportunities include operational-technology threat modeling, where securiCAD’s probabilistic attack graphs outflank generic IT-centric tools. Vendors also race to address AI system risks, embedding modules that map data-poisoning or adversarial-input paths. Pricing is migrating from seat-based to usage-based, aligning with continuous-integration triggers and reinforcing subscription stickiness across the threat modeling tools market.
Threat Modeling Tools Industry Leaders
ThreatModeler Software Inc.
IriusRisk Limited
Security Compass Inc.
Aristiun Inc.
Microsoft Corporation
- *Disclaimer: Major Players sorted in no particular order

Recent Industry Developments
- January 2026: ThreatModeler acquired IriusRisk to create an integrated AI-driven threat modeling platform focused on secure-by-design software development. The transaction also included investment support from Invictus Growth Partners and Paladin Capital Group.
- October 2025: Amazon Web Services launched ThreatComposer Cloud, a fully managed service that translates AWS CloudFormation and Terraform templates into continuously updated threat models.
- August 2025: IriusRisk acquired Brazil-based Conviso AppSec to expand its Latin American presence and integrate advanced code-centric threat modeling features.
- May 2025: OWASP released Threat Modeling Methodology v2.0, standardizing guidance on AI system exposure analysis and infrastructure-as-code mapping.


Global Threat Modeling Tools Market Report Scope
The threat modeling tools market comprises software platforms and frameworks designed to identify, assess, visualize, and mitigate cybersecurity risks during application development, infrastructure design, and system architecture planning. These tools support secure-by-design practices by enabling organizations to detect potential attack paths, model threat scenarios, prioritize vulnerabilities, and strengthen security controls across cloud, on-premise, hybrid, and DevSecOps environments. Market growth is driven by rising cyber threats, increasing regulatory compliance requirements, accelerated cloud adoption, and the integration of security earlier in the software development lifecycle.
The Threat Modeling Tools Market Report is segmented by Deployment Mode (Cloud-Based, On-Premise, and Hybrid), Tool Type (Enterprise Commercial Platforms, Open-Source/Community Editions, Threat-as-Code/CLI Tools, Diagramming-Centric Tools, and Simulation and Attack-Graph Tools), Organization Size (Large Enterprises, and Small and Medium-Sized Enterprises (SMEs)), End-User Vertical (BFSI, IT and Telecom, Healthcare and Life Sciences, Government and Defense, Retail and E-Commerce, Energy and Utilities, Manufacturing, and Other End-User Verticals), and Geography (North America (United States, Canada, and Mexico), Europe (Germany, United Kingdom, France, Italy, and Rest of Europe), Asia-Pacific (China, Japan, India, South Korea, Australia, and Rest of Asia-Pacific), Middle East and Africa (Middle East (Saudi Arabia, United Arab Emirates, and Rest of the Middle East), and Africa (South Africa, Egypt, and Rest of Africa)), and South America (Brazil, Argentina, and Rest of South America)). The market forecasts are provided in terms of value (USD).
| Cloud-Based |
| On-Premise |
| Hybrid |
| Enterprise Commercial Platforms |
| Open-Source / Community Editions |
| Threat-as-Code / CLI Tools |
| Diagramming-Centric Tools |
| Simulation and Attack-Graph Tools |
| Large Enterprises |
| Small and Medium-Sized Enterprises (SMEs) |
| BFSI |
| IT and Telecom |
| Healthcare and Life Sciences |
| Government and Defense |
| Retail and E-Commerce |
| Energy and Utilities |
| Manufacturing |
| Other End-User Verticals |
| North America | United States | |
| Canada | ||
| Mexico | ||
| Europe | Germany | |
| United Kingdom | ||
| France | ||
| Italy | ||
| Rest of Europe | ||
| Asia-Pacific | China | |
| Japan | ||
| India | ||
| South Korea | ||
| Australia | ||
| Rest of Asia-Pacific | ||
| Middle East and Africa | Middle East | Saudi Arabia |
| United Arab Emirates | ||
| Rest of the Middle East | ||
| Africa | South Africa | |
| Egypt | ||
| Rest of Africa | ||
| South America | Brazil | |
| Argentina | ||
| Rest of South America | ||
| By Deployment Mode | Cloud-Based | ||
| On-Premise | |||
| Hybrid | |||
| By Tool Type | Enterprise Commercial Platforms | ||
| Open-Source / Community Editions | |||
| Threat-as-Code / CLI Tools | |||
| Diagramming-Centric Tools | |||
| Simulation and Attack-Graph Tools | |||
| By Organization Size | Large Enterprises | ||
| Small and Medium-Sized Enterprises (SMEs) | |||
| By End-User Vertical | BFSI | ||
| IT and Telecom | |||
| Healthcare and Life Sciences | |||
| Government and Defense | |||
| Retail and E-Commerce | |||
| Energy and Utilities | |||
| Manufacturing | |||
| Other End-User Verticals | |||
| By Geography | North America | United States | |
| Canada | |||
| Mexico | |||
| Europe | Germany | ||
| United Kingdom | |||
| France | |||
| Italy | |||
| Rest of Europe | |||
| Asia-Pacific | China | ||
| Japan | |||
| India | |||
| South Korea | |||
| Australia | |||
| Rest of Asia-Pacific | |||
| Middle East and Africa | Middle East | Saudi Arabia | |
| United Arab Emirates | |||
| Rest of the Middle East | |||
| Africa | South Africa | ||
| Egypt | |||
| Rest of Africa | |||
| South America | Brazil | ||
| Argentina | |||
| Rest of South America | |||


Key Questions Answered in the Report
What is the current size of the threat modeling tools market and how fast is it growing?
The threat modeling tools market size reached USD 1.48 billion in 2026 and is projected to climb to USD 2.97 billion by 2031 at a 14.89% CAGR, according to Mordor Intelligence.
Which deployment model is expanding fastest in threat modeling adoption?
Hybrid deployment is growing most quickly, forecast to post a 15.44% CAGR between 2026 and 2031 as organizations balance cloud scalability with data-sovereignty obligations.
Why are healthcare organizations accelerating investment in threat modeling?
Ransomware disruptions to patient-care systems and new HIPAA guidance on third-party data flows are pushing healthcare and life-sciences firms to adopt continuous modeling, driving a 15.97% CAGR for the segment.
How are AI code-generation tools affecting threat modeling requirements?
Generative-AI assistants introduce new vulnerability classes and vast code volumes, so platforms now integrate with integrated-development environments to flag insecure patterns during coding.
What skills gap is constraining market growth?
A shortage of cross-disciplinary professionals able to translate system architectures into attack trees is limiting adoption, especially in APAC and the Middle East, prompting automation and training initiatives.
Which regions will offer the highest future growth potential?
Asia-Pacific is expected to record the fastest 16.13% CAGR through 2031 as China, India, Japan, and South Korea enforce secure-development mandates that embed threat modeling in procurement and compliance workflows.
Page last updated on:


