
Threat Intelligence Security Services Market Size and Share
Market Overview
| Study Period | 2020 - 2031 |
|---|---|
| Market Size (2026) | USD 3.67 Billion |
| Market Size (2031) | USD 6.56 Billion |
| Growth Rate (2026 - 2031) | 12.31 % |
| Fastest Growing Market | Asia Pacific |
| Largest Market | North America |
| Market Concentration | Medium |
Major Players *Disclaimer: Major Players sorted in no particular order Image © Mordor Intelligence. Reuse requires attribution under CC BY 4.0. | |
Threat Intelligence Security Services Market Analysis by Mordor Intelligence
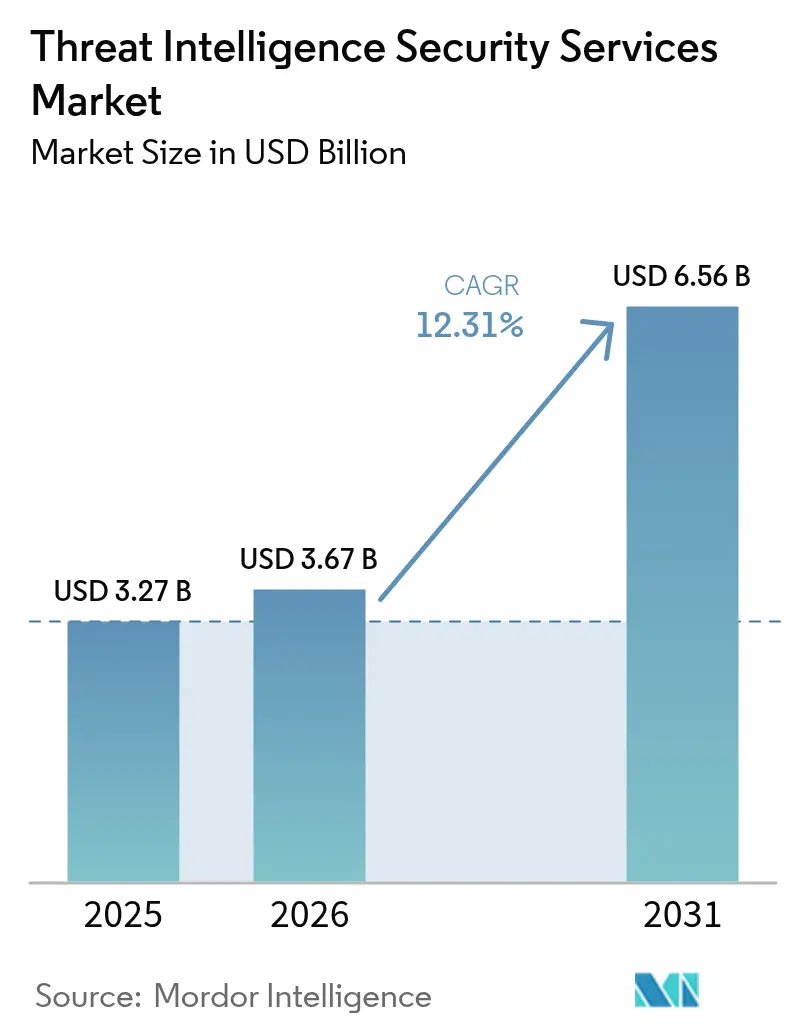
The threat intelligence security services market size was valued at USD 3.27 billion in 2025 and estimated to grow from USD 3.67 billion in 2026 to reach USD 6.56 billion by 2031, at a CAGR of 12.31% during the forecast period (2026-2031). The expansion reflects a decisive shift from reactive perimeter defense toward continuous threat hunting, exposure management, and predictive analytics. Escalating state-sponsored campaigns, a 65% rise in cloud security incidents, and mandatory breach-notification laws across major jurisdictions are amplifying demand for real-time, contextual threat data. Platform convergence, led by zero-trust and Extended Detection and Response (XDR) rollouts, is further accelerating investment as security teams seek unified visibility and automated response. At the same time, the proliferation of application programming interface attack surfaces and insider risks arising from generative AI code assistants have prompted organizations to reassess risk postures, energizing the threat intelligence security services market. [1]Cybersecurity and Infrastructure Security Agency, “Pre-Ransomware Notification Factsheet,” cisa.gov
Key Report Takeaways
- By deployment mode, cloud services captured 57.35% of the threat intelligence security services market share in 2025; on-premises and hybrid models trail, yet cloud is projected to expand at an 18.03% CAGR to 2031.
- By service type, Managed Detection and Response held 55.40% of the threat intelligence security services market share in 2025, while professional services are poised to record an 18.33% CAGR through 2031.
- By organization size, large enterprises accounted for 63.18% share of the threat intelligence security services market size in 2025, whereas SMEs are forecast to grow at a 17.32% CAGR.
- By end-user industry, banking and financial services led with 23.62% revenue share in 2025; healthcare is advancing at an 18.02% CAGR through 2031.
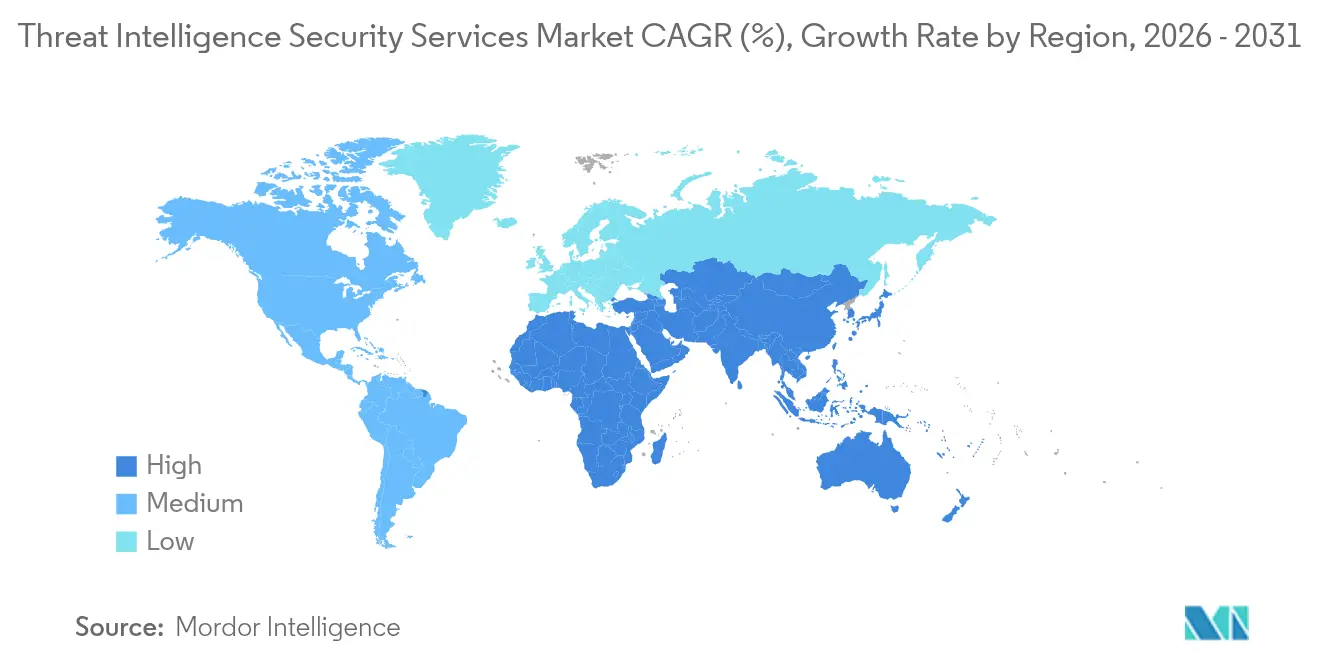
- By region, North America dominated with 37.60% share; Asia-Pacific is projected to lead growth at an 18.55% CAGR through 2031.
Note: Market size and forecast figures in this report are generated using Mordor Intelligence’s proprietary estimation framework, updated with the latest available data and insights as of 2026.
Market Trends and Insights
Drivers Impact Analysis of Threat Intelligence Security Services Market*
| Driver | (~) % Impact on CAGR Forecast | Geographic Relevance | Impact Timeline |
|---|---|---|---|
| Rapid escalation in state-sponsored APT campaigns | 3.20% | Global, with concentrated impact in North America & APAC | Medium term (2-4 years) |
| Proliferation of cloud workloads & API attack-surface | 2.80% | Global, led by North America & Europe | Long term (≥ 4 years) |
| Zero-trust & XDR platformisation by CISOs | 2.10% | North America & EU, expanding to APAC | Medium term (2-4 years) |
| Mandatory breach-notification laws (US, EU, APAC) | 1.90% | North America, Europe, APAC core | Short term (≤ 2 years) |
| Insider-risk from Gen-AI code-assistants (under-radar) | 1.40% | Global, concentrated in tech hubs | Long term (≥ 4 years) |
| Adoption of CTEM for continuous controls validation (under-radar) | 1.10% | North America & EU early adopters | Medium term (2-4 years) |
| Source: Mordor Intelligence | |||
Rapid Escalation in State-Sponsored APT Campaigns
Nation-state groups such as Volt Typhoon and Salt Typhoon have intensified operations against critical infrastructure, prompting organizations to prioritize tactical intelligence and pre-incident attribution capabilities. The Cybersecurity and Infrastructure Security Agency issued 3,368 pre-ransomware notifications in 2024, underscoring the volume of advanced intrusion attempts. Attacks now go beyond espionage to include destructive pre-positioning, which demands continuous monitoring and specialized hunting. Iranian actors are simultaneously targeting healthcare and financial services, turning threat intelligence into a strategic imperative across sectors. These developments have accelerated spending on managed detection, enriched malware analysis, and contextual attribution services.
Proliferation of Cloud Workloads & API Attack-Surface
Cloud migration has multiplied attack entry points, with organizations operating thousands of APIs across multi-cloud settings. API failures contributed to a majority of cloud breaches reported in 2024, revealing visibility gaps in east-west traffic. Traditional network monitoring lacks context for ephemeral workloads, fuelling adoption of cloud-native threat intelligence that can map dependencies in real time. Microservices architectures further complicate asset inventories, increasing reliance on automated discovery and continuous risk scoring. The outcome is sustained momentum for cloud-delivered analytics engines and exposure management modules tailored to serverless and container environments.
Zero-Trust & XDR Platformisation by CISOs
Zero-trust architecture has moved from concept to mandate. The United States allocated USD 13 billion for civilian cybersecurity in 2025, directing agencies to adopt zero-trust under Executive Order 14028. Commercial enterprises mirror this shift, integrating identity, endpoint, and network telemetry into unified XDR platforms that depend on high-fidelity threat intelligence feeds. CISOs are prioritizing solutions that consolidate alert pipelines, reduce manual triage, and automate statistical correlation. Vendors responding with packaged threat intelligence modules embedded into XDR stacks are securing long-term contracts, supporting sustained double-digit market growth. [2]U.S. Securities and Exchange Commission, “Cybersecurity Risk Management, Strategy, Governance, and Incident Disclosure,” sec.gov
Mandatory Breach-Notification Laws
Stricter disclosure frameworks—such as the U.S. Securities and Exchange Commission’s cybersecurity reporting rule—require near-real-time incident communication. Europe’s NIS2 directive expanded coverage to critical suppliers, driving companies to devote 9% of total IT spend to compliance and intelligence support. Asia-Pacific nations have enacted parallel statutes that heighten board-level accountability. The new obligations spur adoption of attribution, impact modelling, and regulatory workflow features within threat intelligence platforms.
Restraints Impact Analysis of Threat Intelligence Security Services Market*
| Restraint | (~) % Impact on CAGR Forecast | Geographic Relevance | Impact Timeline |
|---|---|---|---|
| Shortage of Tier-1 threat-hunters & analysts | -2.10% | Global, most acute in North America & Europe | Long term (≥ 4 years) |
| Budget compression in SME segment | -1.80% | Global, concentrated in emerging markets | Medium term (2-4 years) |
| Data-sovereignty barriers to cross-border telemetry sharing (under-radar) | -1.30% | Europe, APAC, with spillover to global operations | Long term (≥ 4 years) |
| Adversary abuse of spoofed TI feeds causing alert fatigue (under-radar) | -0.90% | Global, affecting all deployment models | Short term (≤ 2 years) |
| Source: Mordor Intelligence | |||
Shortage of Tier-1 Threat-Hunters & Analysts
Demand for deep forensics and malware reverse-engineering outpaces supply. Years of training are needed to master nation-state adversary tactics, yet security teams face attrition and wage inflation. The gap is driving consolidation as smaller vendors struggle to retain experts, and clients turn to Managed Detection and Response for turnkey coverage. Providers must now automate routine triage to free scarce specialists for higher-value pursuits, heightening interest in AI-assisted analysis modules.
Budget Compression in SME Segment
Small and medium enterprises experience 40% of cyber incidents yet often view threat intelligence as discretionary. Capital constraints in emerging markets amplify the challenge, limiting uptake of enterprise-grade platforms. Vendors experimenting with tiered licensing and consumption-based billing are finding traction, but profitability remains thin. Failure to close this affordability gap could slow penetration, particularly where macroeconomic pressures remain high.
*Our forecasts treat driver/restraint impacts as directional, not additive. The impact forecasts reflect baseline growth, mix effects, and variable interactions.
Threat Intelligence Security Services Market Segment Analysis
By Deployment Mode:
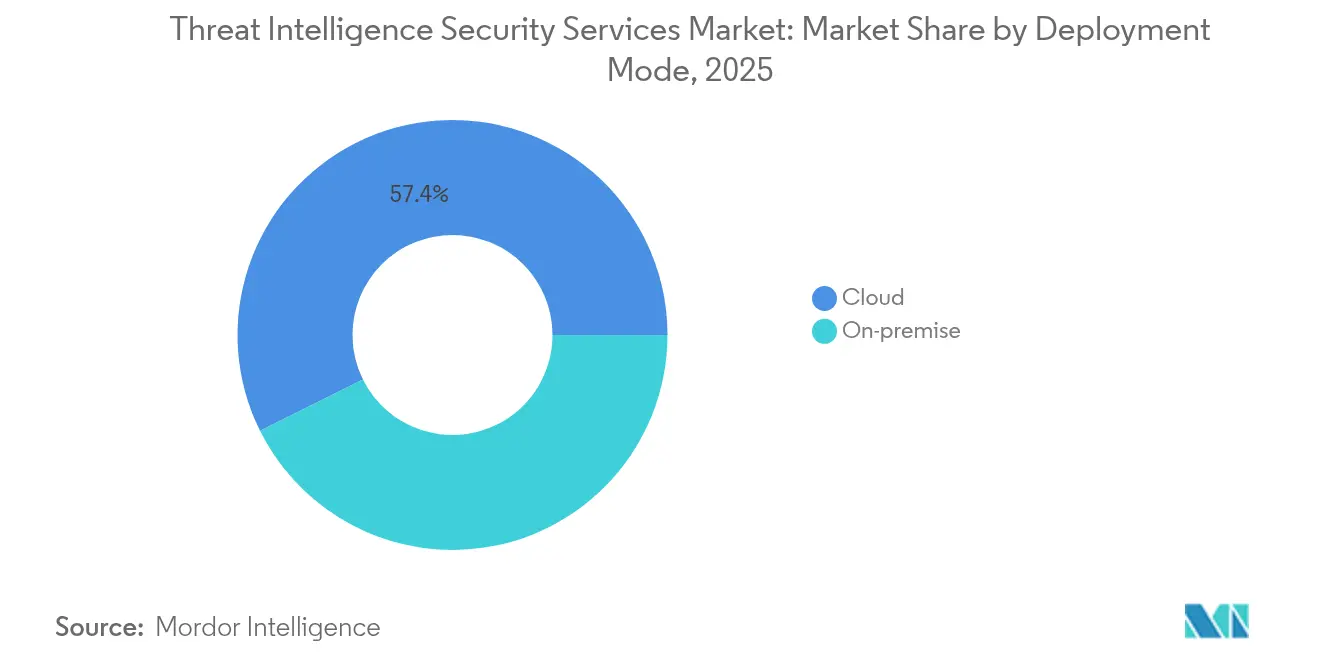
Cloud Dominance AcceleratesCloud deployment already commands 57.35% of the threat intelligence security services market share. The segment is projected to expand at an 18.03% CAGR through 2031, reinforcing the centrality of cloud-native analytics engines. Elastic compute and distributed storage enable providers to process petabytes of telemetry without customer-side hardware, which is critical as threat intelligence security services market size grows to USD 6.56 billion in 2031. On-premises deployments persist in sovereign cloud and defense contexts that require local data processing, although development roadmaps now prioritize hybrid connectors rather than standalone appliances. Hybrid adoption is rising among regulated firms that embrace the cloud for scale yet retain select data sets in country for compliance. API-centric attack vectors accentuate cloud resonance since traditional sensors lack context for container traffic. Palo Alto Networks reported AI-centric Annual Recurring Revenue above USD 200 million with 4x year-over-year growth, validating appetite for cloud-delivered machine learning modules. Cloud superiority is therefore entrenched, but vendors must address latency, encryption, and locality factors to accelerate further penetration.



By Service Type:
MDR Services Lead Market EvolutionManaged Detection and Response own 55.40% of the threat intelligence security services market share as of 2025 and are forecast to grow 18.12% annually. Enterprises favour MDR because it fuses technology, telemetry, and human expertise, reducing mean time to detect without staffing burdens. The surge in MDR contracts underlines how the threat intelligence security services market pivots toward outcome-based delivery. Professional services remain vital for maturity assessments, framework design, and Continuous Threat Exposure Management rollouts.
Subscription feeds form a commodity base but are evolving toward context-rich packages with actor profiling and risk scoring. Fortinet posted Security Operations ARR of USD 434.5 million in Q1 2025, up 30.3% year on year, signalling that integrated MDR plus orchestration gains momentum. Vendors blending curated telemetry with automated containment workflows are building defensible differentiation as tool consolidation continues.
By Organization Size:
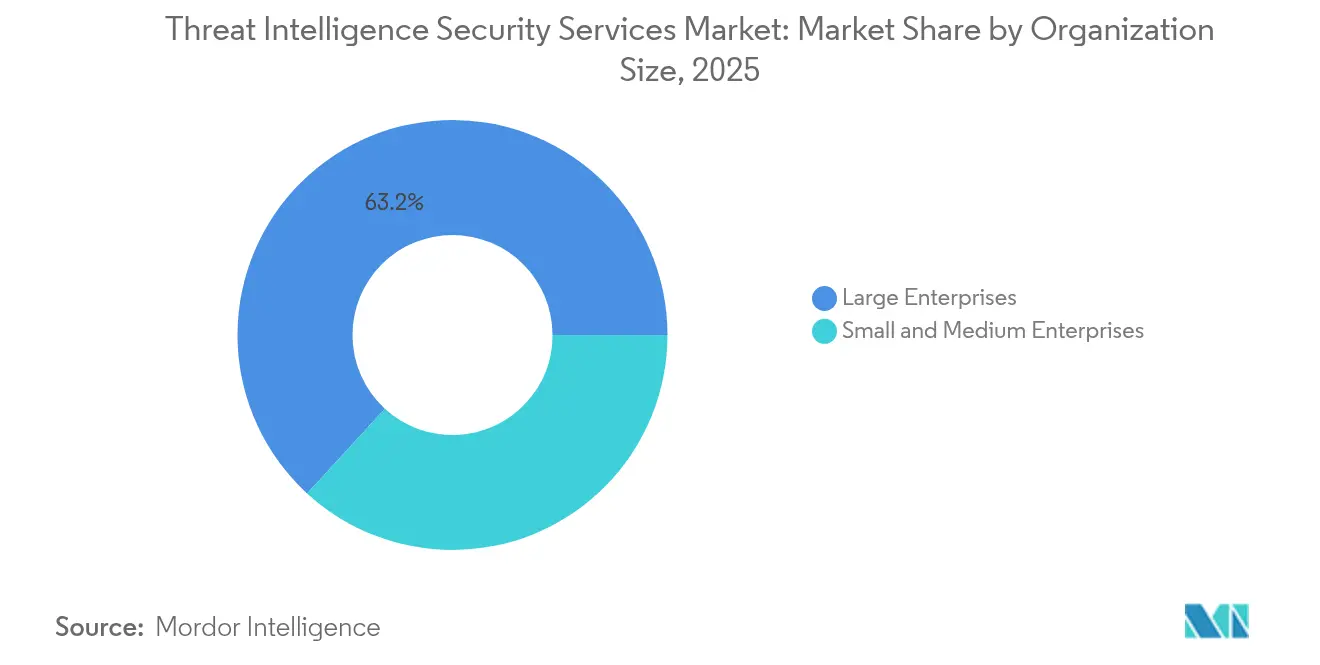
Enterprise Dominance with SME AccelerationLarge enterprises contributed 63.18% to 2025 revenue, reflecting budgets big enough to support multilayered intelligence stacks. These organizations demand vendor integration with security information and event management, vulnerability management, and governance platforms. The threat intelligence security services market size for large organizations is projected to rise steadily due to executive-level recognition of systemic cyber risk. SMEs, while historically underserved, are projected to register a 17.32% CAGR to 2031.
Supply-chain attacks have elevated SMEs from peripheral victims to high-value targets, fostering demand for subscription-based, managed intelligence tailored to limited resources. CrowdStrike ended fiscal 2025 with USD 3.94 billion in ARR, much of it sourced from mid-market contracts that leverage cloud-native multitenancy economies. Providers adopting automated onboarding, templated reporting, and fractional analyst services will unlock this volume segment while preserving margin.
By End-User Industry:
Financial Services Lead, Healthcare AcceleratesBanking and financial services hold 23.62% revenue share, driven by obligatory incident disclosure, payment fraud mitigation, and nation-state interest in economic disruption. The threat intelligence security services market size for financial institutions is forecast to widen as real-time payment rails and open banking APIs expand the attack surface.
Healthcare exhibits the fastest trajectory with an 18.02% CAGR. Ransomware hit 725 healthcare organizations in 2024, compromising data for 120 million individuals, catalysing urgent spending on predictive threat modelling and secure medical device telemetry. Change Healthcare alone experienced USD 2 million in daily outage losses, underlining operational risk. Life sciences firms face similar pressures due to intellectual-property theft, while government mandates heighten compliance costs. Providers able to fuse sector-specific indicators with patient-safety impact analysis are capturing share.
Geography Analysis
North America Threat Intelligence Security Services Market
North America controls 37.60% of global revenue, supported by the United States’ USD 27.5 billion cybersecurity allocation for 2025, which includes USD 3 billion for CISA grants that expand intelligence sharing networks. High adoption of zero-trust, robust venture funding, and an ecosystem of cloud-native vendors sustain regional leadership. Federal Executive Order 14028 compels government agencies to integrate threat intelligence into security operations, and adjacent industries replicate the model for supply-chain assurance. Canada is harmonizing with U.S. disclosure norms, while Mexico’s financial regulator extends incident reporting to fintech, adding new demand vectors.
APAC Threat Intelligence Security Services Market
Asia-Pacific is projected to grow at an 18.55% CAGR, the fastest worldwide. China’s cybersecurity market is on track to reach USD 23.66 billion by 2029 as government programs enforce in-country security controls. Japan’s strategic documents call for tripling domestic cybersecurity sales and boosting national budgets by 50%, which elevates appetite for industry-grade threat intelligence. India continues rapid digitization; its CERT‐IN directives oblige real-time reporting for specified incidents, driving service uptake. Australia’s AUD 586 million cyber resilience package underpins managed intelligence demand, and regional telecom providers are investing in cross-border telemetry exchanges.
Europe Threat Intelligence Security Services Market
Europe maintains steady growth propelled by the NIS2 directive and local data protection mandates. Germany expects cybersecurity spending beyond €10 billion in 2025 to shield industrial automation from sabotage. The United Kingdom earmarked an extra £600 million for intelligence agencies and plans to devote 5% of GDP to national security by 2035 reinforce long-term visibility for vendors. Data-sovereignty requirements stimulate growth of regional security operations centers capable of processing telemetry within national borders. Providers offering residency-aware cloud fabrics and multilingual analyst support are therefore preferred.

Regulatory Landscape
Regulation is tightening around intelligence-led risk management and faster incident reporting, which is increasing demand for operationalized threat intelligence services. In the European Union, Commission Implementing Regulation (EU) 2024/2690 (October 2024) set technical and methodological requirements for cybersecurity risk management and explicitly calls for analyzing risks using cyber threat intelligence, while Regulation (EU) 2024/2847 (Cyber Resilience Act, adopted October 2024) introduced obligations for manufacturers of products with digital elements to notify actively exploited vulnerabilities to designated CSIRTs and ENISA.
Reporting expectations are also being standardized for major ICT incidents and significant cyber threats. Commission Delegated Regulation (EU) 2025/301 defined regulatory technical standards for the content and time limits of such reporting, and Regulation (EU) 2025/38 (Cyber Solidarity Act, December 2024) established a pan-European framework for National and Cross-Border Cyber Hubs to support threat detection, threat intelligence production, and information sharing. Globally, NIST Cybersecurity Framework 2.0 continues to act as a benchmark that pushes enterprises to connect threat intelligence to risk assessment and governance, shaping vendor requirements for evidence, telemetry handling, and reporting workflows.
Value Chain Analysis
The value chain begins with telemetry and intelligence sources (endpoint, network, identity, cloud, and OT data; vulnerability and exploit intelligence; open-source and closed communities), followed by collection, enrichment, and normalization. Providers fuse indicators, TTP mapping, malware analysis, and attribution into intelligence products delivered as subscription feeds, MDR-led outcomes, and professional services such as incident response, threat hunting, and CTEM programs. Distribution is increasingly routed through cloud marketplaces, channel partners, and global system integrators that package intelligence into broader security operations, particularly for enterprises consolidating tools into XDR-centric workflows.
Service delivery relies on specialized analysts, automated correlation, and integration into customer environments (SIEM, SOAR, EDR/XDR, vulnerability management, and ticketing), which creates switching costs tied to playbooks and detection content. Key bottlenecks include analyst scarcity, data-sovereignty constraints that restrict cross-border telemetry sharing, and third-party risk exposure from complex supplier ecosystems. Government and industry bodies influence upstream and midstream practices through intelligence sharing and supply-chain security initiatives, including the CISA ICT Supply Chain Risk Management Task Force, which has emphasized emerging AI-related threats and mitigation considerations for ICT supply chains.
Competitive Landscape
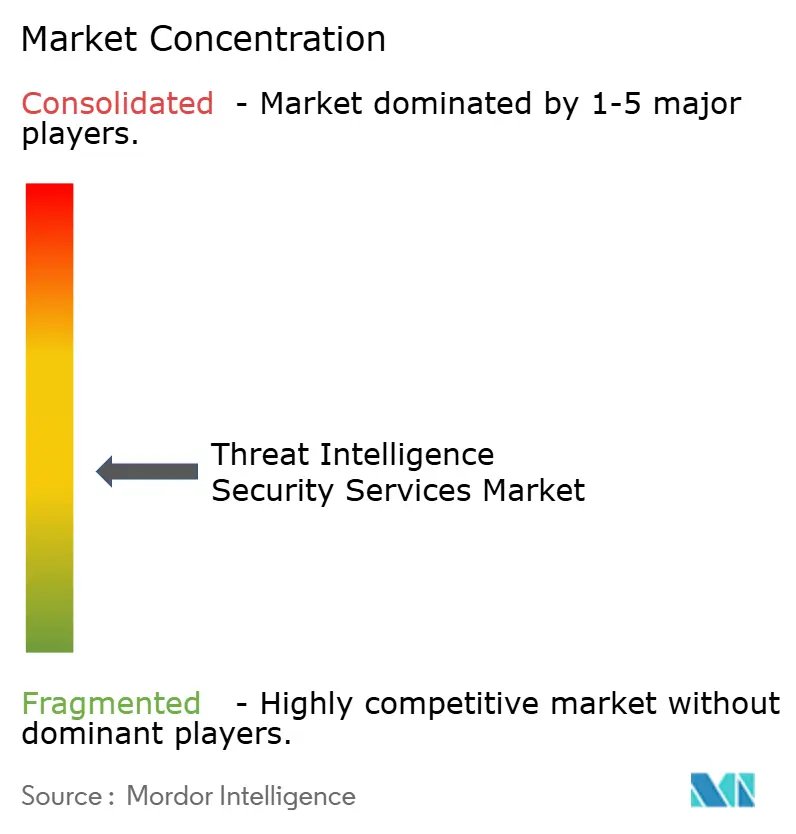
The threat intelligence security services industry demonstrates moderate consolidation as platform vendors acquire niche specialists to shore up coverage gaps. CyberArk’s USD 1.54 billion acquisition of Venafi adds machine identity intelligence, while Sophos paid USD 859 million for Secureworks to fold in managed detection expertise. Bitsight’s USD 115 million purchase of Cybersixgill signals appetite for dark-web monitoring. Palo Alto Networks targets USD 15 billion in Next-Generation Security ARR by 2030 using a platform model that unites network, cloud, and threat intelligence modules.
Emerging disruptors emphasize artificial intelligence and graph analytics to automate threat correlation, challenging incumbents that rely on manual curation. Start-ups offer predictive scoring that assesses exploit likelihood before proof-of-concept code becomes public. White-space opportunities include Continuous Threat Exposure Management, supply-chain risk intelligence, and OT-specific telemetry for critical infrastructure. Cloud hyperscalers also expand managed security portfolios, leveraging global points of presence for latency-optimized intelligence delivery.
Competitive intensity encourages specialization as vendors differentiate on data quality, integration breadth, and automated response depth. Companies that supply ingest-ready intelligence for XDR pipelines gain stickiness because switching costs grow with orchestration complexity. Partnerships with cloud service providers, endpoint vendors, and industry information sharing bodies enhance scale, while certification under FedRAMP or ISO 27001 remains a purchase prerequisite for governments and highly regulated verticals.
Threat Intelligence Security Services Industry Leaders
Google LLC (Mandiant)
Recorded Future Inc.
CrowdStrike Holdings Inc.
Fortinet Inc.
Cisco Systems Inc.
- *Disclaimer: Major Players sorted in no particular order
Threat Intelligence Security Services Market Companies Covered in this Report
- Google LLC (Mandiant)
- Recorded Future Inc.
- CrowdStrike Holdings Inc.
- Fortinet Inc.
- Cisco Systems Inc.
- International Business Machines Corporation
- Palo Alto Networks Inc.
- Dell Technologies Inc.
- Check Point Software Technologies Ltd.
- Trellix LLC (McAfee Enterprise)
- Broadcom Inc. (Symantec)
- LogRhythm Inc.
- Juniper Networks Inc.
- F-Secure Corporation
- LookingGlass Cyber Solutions Inc.
- Rapid7 Inc.
- Arctic Wolf Networks Inc.
- Trend Micro Incorporated
- Elastic N.V. (Security)
- Kaspersky Lab JSC
Read Analysis of Threat Intelligence Security Services Companies

Market Opportunities and Future Outlook
Critical infrastructure and OT-focused threat intelligence is a key whitespace as operators seek end-to-end visibility spanning IT, OT, and exposed asset inventories. Accenture's June 2026 agreements to acquire a majority stake in Dragos, and to acquire runZero and NetRise, reinforce this direction by combining OT security with asset discovery and software supply-chain intelligence. For managed security providers and platform vendors, these moves support sector-specific detection content (energy, manufacturing, transportation) alongside incident response retainers and continuous exposure management.
Automation and vulnerability coordination are also broadening threat intelligence beyond indicators into decision support and workflow execution. In the United States, the July 2026 White House launch of the Gold Eagle initiative created a vulnerability coordination clearinghouse for critical infrastructure, aligning public-private processes around vulnerability intake, triage, and dissemination. In Europe, the Cyber Solidarity Act (Regulation (EU) 2025/38) establishes National and Cross-Border Cyber Hubs that formalize intelligence production and sharing, supporting demand for residency-aware services, interoperability with national ecosystems, and reporting-grade intelligence outputs. Company activity further indicates momentum in AI-native threat operations, including Intrusion's June 2026 acquisition of VigilAigent to integrate an agentic AI engine with its threat intelligence database, aimed at reducing manual triage and accelerating hunting workflows.
Recent Industry Developments in Threat Intelligence Security Services Market
- June 2026: Recorded Future and Wipro announced a strategic partnership to deliver managed intelligence services and AI-powered threat intelligence at global enterprise scale. The partnership positions a major systems integrator as a distribution channel for operationalized intelligence embedded into security operations and managed services. It also reinforces the shift from stand-alone feeds toward workflow-integrated intelligence for detection, investigation, and response.
- March 2026: Recorded Future highlighted rapid adoption of its Autonomous Threat Operations (ATO) capabilities, framing a move toward automated threat hunting and operational execution rather than analyst-only workflows. The emphasis on autonomy reflects buyer pressure from threat-hunter shortages and alert backlog reductions. It also raises competitive expectations for intelligence providers to deliver action-oriented outputs that integrate into MDR and XDR pipelines.
- October 2024: CrowdStrike and Fortinet announced an expanded integration to deliver joint protection across endpoints, networks, and security operations workflows. The alliance connects telemetry and response actions across two widely deployed platforms, improving cross-domain visibility and coordinated containment. Such integrations increase ecosystem stickiness and accelerate platform consolidation in enterprise security stacks.


Threat Intelligence Security Services Market Report Scope and Research Methodology
Market Definition and Coverage
This market covers outsourced and advisory services that help organizations collect, analyze, and apply cyber threat intelligence so they can prevent, detect, and respond to attacks. The sizing is done in revenue terms for service delivery across major industries and regions.
Scope exclusions: Excludes standalone threat intelligence software platforms sold as product licenses, unless they are bundled and billed as part of an ongoing service engagement.
Segments Covered in This Report
- By Deployment Mode
- Cloud
- On-premise
- By Service Type
- Managed Detection and Response
- Professional / Consulting
- Subscription Data-feeds
- By Organization Size
- Large Enterprises
- Small and Medium Enterprises
- By End-user Industry
- Banking and Financial Services
- Healthcare
- IT and Telecom
- Retail and e-Commerce
- Life Sciences / Pharma
- Government and Defense
- By Geography
- North America
- United States
- Canada
- Mexico
- Europe
- United Kingdom
- Germany
- France
- Italy
- Rest of Europe
- Asia-Pacific
- China
- Japan
- India
- South Korea
- Rest of Asia-Pacific
- Middle East
- Israel
- Saudi Arabia
- United Arab Emirates
- Turkey
- Rest of Middle East
- Africa
- South Africa
- Egypt
- Rest of Africa
- South America
- Brazil
- Argentina
- Rest of South America
- North America
Data Sources, Market Sizing, and Validation
Desk Research
Desk work starts with building a clean view of the demand environment and the service landscape, and then we map it into a simple model that can be checked. We leaned on public sources such as NIST publications, CISA alerts and annual summaries, ENISA threat landscape reports, OECD digital security documents, and ITU cybersecurity statistics and indexes to understand incident patterns and control adoption.
To anchor spending signals, we also reviewed sources such as SEC filings and annual reports, investor presentations, and cybersecurity practice pages from service providers, along with coverage from reputed press and association websites. For cross-checking company revenue scale and major contract signals, we used paid subscriptions for company financials and intelligence, news and financials, and global contracts and tenders where it helped validate deal activity. These examples are not exhaustive, and many other public sources were also used to collect data, validate assumptions, and clarify open questions.
Primary Interviews and Surveys
Primary inputs were taken from interviews and structured surveys with service providers, cybersecurity leaders in end user organizations, and advisory participants who see buying behavior. We used these discussions to confirm what gets contracted as a service, typical contract lengths, cloud versus on-prem delivery mix, and how pricing moves with threat volumes and regulatory pressure across major regions.
Distribution of primary research fieldwork respondents
| Company type | Respondent position | Region |
|---|---|---|
| Top tier: 26% | CXOs: 13% | APAC: 46% |
| Mid tier: 56% | Functional/Unit leaders: 33% | EMEA: 36% |
| Smaller Players: 18% | Managers: 54% | Americas: 18% |
Market-Sizing & Forecasting
Sizing starts with a top-down build where cybersecurity services spend is reconstructed into a threat-intelligence service pool using adoption and attach-rate assumptions by industry and region, and then it is spread across service types and deployment preferences. Once that structure is in place, we corroborate totals with selective bottom-up approximations, such as sampled price-per-engagement checks, channel feedback on typical deal sizes, and limited supplier roll-ups where public revenue cues exist.
Inputs used in the model include the share of managed detection and response within service demand, cloud security operations penetration, reported breach and incident trends, compliance-driven monitoring requirements, and typical contract renewal patterns. When a bottom-up proxy is thin for smaller providers, gaps are handled by using conservative ranges from interview benchmarks and then normalizing back to the top-line demand pool so the total stays realistic.
For forecasting, scenario analysis is used, because security budgets can shift quickly after major incidents, regulatory changes, and macro conditions. Assumptions for growth in cloud-first delivery, increased outsourcing of 24x7 monitoring, and pricing progression are reviewed with experts, and then applied consistently across regions before the final numbers are locked.
Data Validation & Update Cycle
Validation is done in steps so the output does not rely on one data series. We compare model results against independent signals, including provider commentary on security services growth, public incident and advisory volumes, and observed shifts in MDR adoption, and then variances are investigated before sign-off.
Outliers are flagged when growth, regional splits, or service shares move beyond what interviews and public indicators can reasonably support, and the assumptions are rechecked with follow-up outreach when needed. The report is refreshed annually, with interim updates triggered by material events such as major regulatory changes, large breaches that reset budgets, or notable changes in service packaging. Before delivery, a fresh analyst pass is completed so clients receive the most current view available at that time.
Mordor Intelligence's Threat Intelligence Security Services Market Size Compared Against Other Published Estimates
Published market sizes for threat intelligence can look far apart because the category name is used in different ways across studies. Differences usually come from what is counted as a service versus a product, the year selected as the base, and how cloud and managed offerings are treated when they are bundled.
Solutions revenue is the biggest gap driver in this space, because some estimates mix platform subscription value with service delivery fees and then label the total as services. Currency timing and the use of aggressive versus base-case price progression can widen the spread further, especially when incident-response led demand spikes are assumed to persist without being revalidated.
Benchmark comparison
| Source | Market Size | Gaps in Research Methodology |
|---|---|---|
| Mordor Intelligence | USD 3.27 B (2025) | |
| Global Consultancy A | USD 10.19 B (2024) | Often sized as a combined threat intelligence market that includes solutions and services, so platform subscriptions and tool revenues can inflate what looks like a services-only total, and the base year is different. |
| Regional Consultancy B | USD 12.06 B (2024) | Tends to include a broader component scope (solutions plus services) and application-led categories, which can overlap with adjacent cybersecurity software spend and lift the market value beyond pure service revenues. |
Standalone threat intelligence platform subscriptions sit outside Mordor Intelligence's scope, which is why the services-only number looks smaller than broader studies that combine solutions with services. When scope is kept consistent and then checked against MDR mix, cloud delivery penetration, and deal-size signals, the resulting estimate is easier to trace and repeat year after year.


Key Questions Answered in the Report
What is the current size of the threat intelligence security services market?
The market is valued at USD 3.67 billion in 2026 and is projected to hit USD 6.56 billion by 2031.
Which segment holds the largest share of the threat intelligence security services market?
Cloud deployment leads with 57.35% share, reflecting widespread migration to scalable security analytics.
Why are Managed Detection and Response services growing rapidly?
MDR integrates technology and analyst expertise, allowing organizations to outsource threat hunting amid a skills shortage, which drives an 18.12% forecast CAGR.
Which region is expected to grow the fastest?
Asia-Pacific is projected to expand at an 18.55% CAGR because of aggressive digital transformation and regulatory initiatives.
What is the biggest challenge restraining market growth?
A severe shortage of experienced threat hunters’ limits capacity, reducing the effective rollout of advanced intelligence services.
How concentrated is the competitive landscape?
The top five providers collectively account for roughly 60% of revenue, indicating moderate consolidation.
Page last updated on:





