Vulnerability Assessment Services Market Size and Share
Market Overview
| Study Period | 2019 - 2030 |
|---|---|
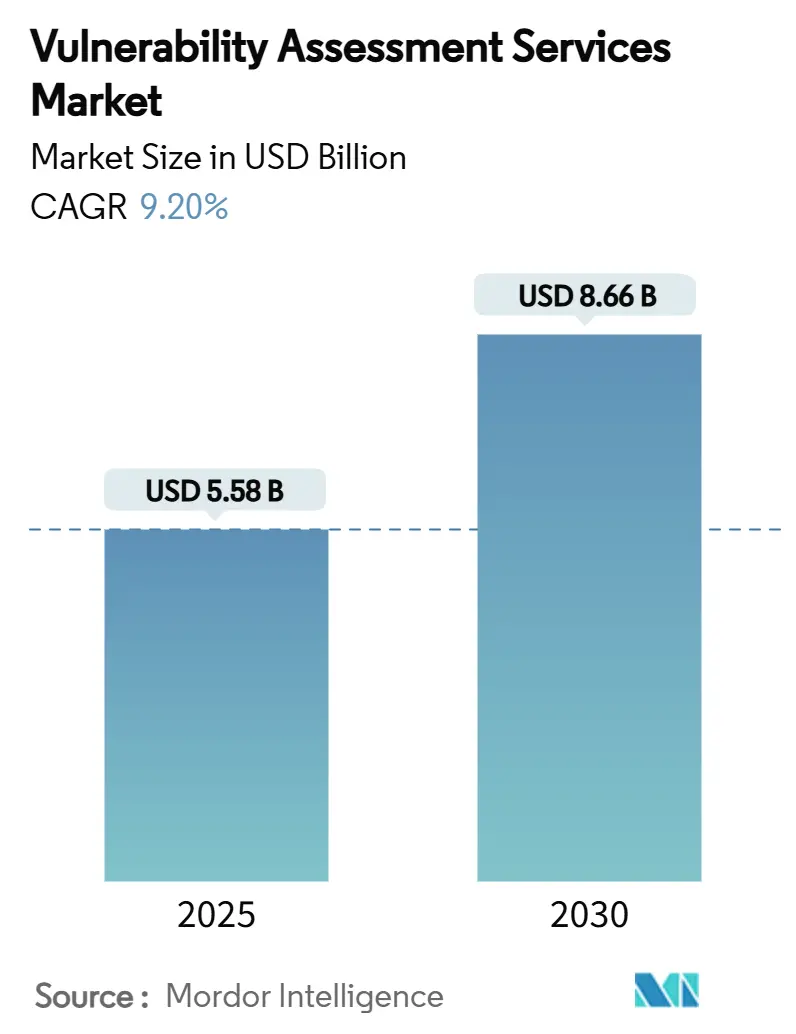
| Market Size (2025) | USD 5.58 Billion |
| Market Size (2030) | USD 8.66 Billion |
| Growth Rate (2025 - 2030) | 9.20% CAGR |
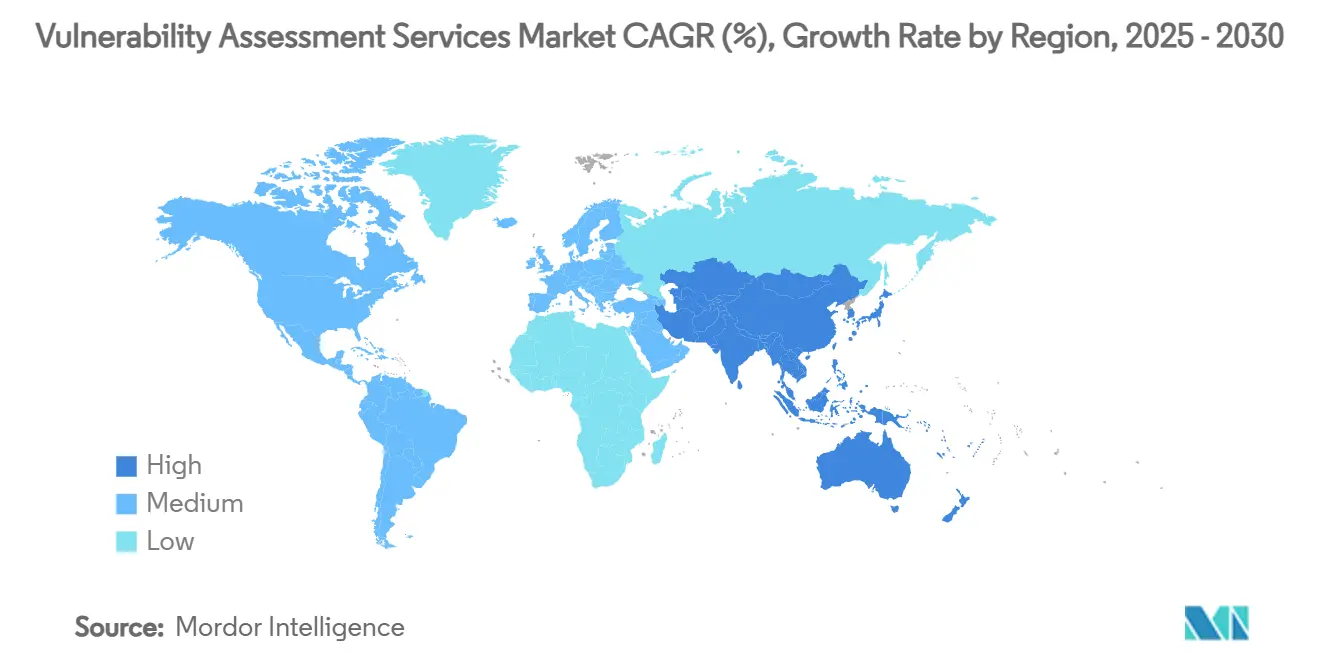
| Fastest Growing Market | Asia Pacific |
| Largest Market | North America |
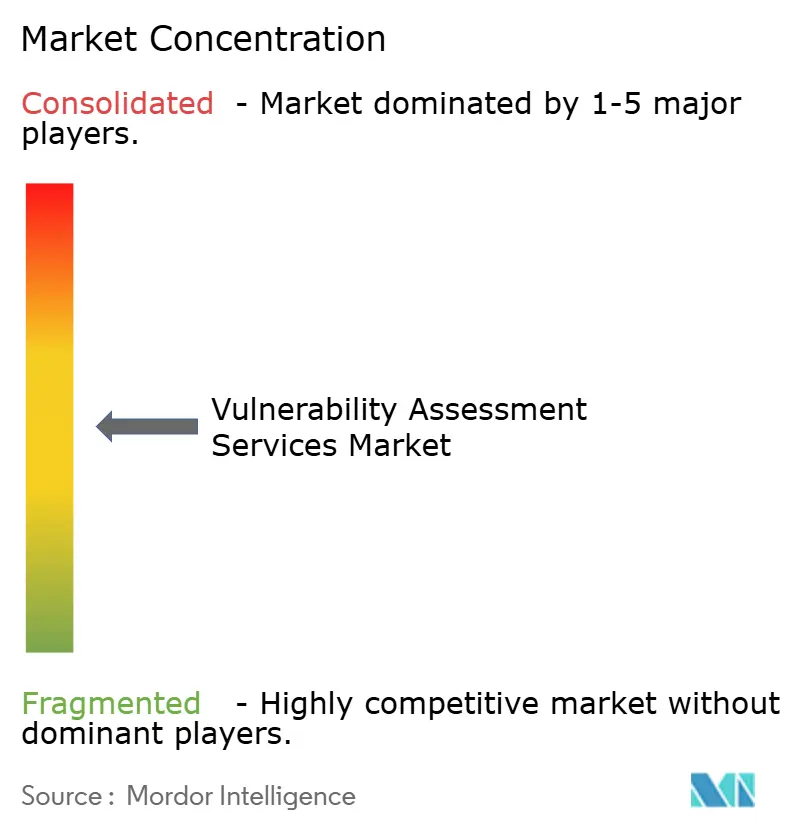
| Market Concentration | Medium |
Major Players *Disclaimer: Major Players sorted in no particular order Image © Mordor Intelligence. Reuse requires attribution under CC BY 4.0. | |
Vulnerability Assessment Services Market Analysis by Mordor Intelligence
The vulnerability assessment services market size reached USD 5.58 billion in 2025 and is forecast to attain USD 8.66 billion in 2030 while expanding at a 9.2% CAGR. Regulatory mandates such as the Digital Operational Resilience Act, rapid cloud-native adoption, and artificial intelligence integration are reshaping how enterprises detect and remediate security gaps across hybrid infrastructures. Large enterprises dominate present spending, yet small and medium enterprises are turning to managed offerings, accelerating demand for automated platforms with embedded remediation workflows. Network-based scanning still anchors most programs, although cloud assessment solutions are scaling faster as containerized workloads and multi-cloud estates outpace legacy perimeter models. Vendors able to merge vulnerability intelligence with risk-based prioritization and workflow automation are capturing share as users pivot from raw vulnerability counts to actionable exposure insights.
Key Report Takeaways
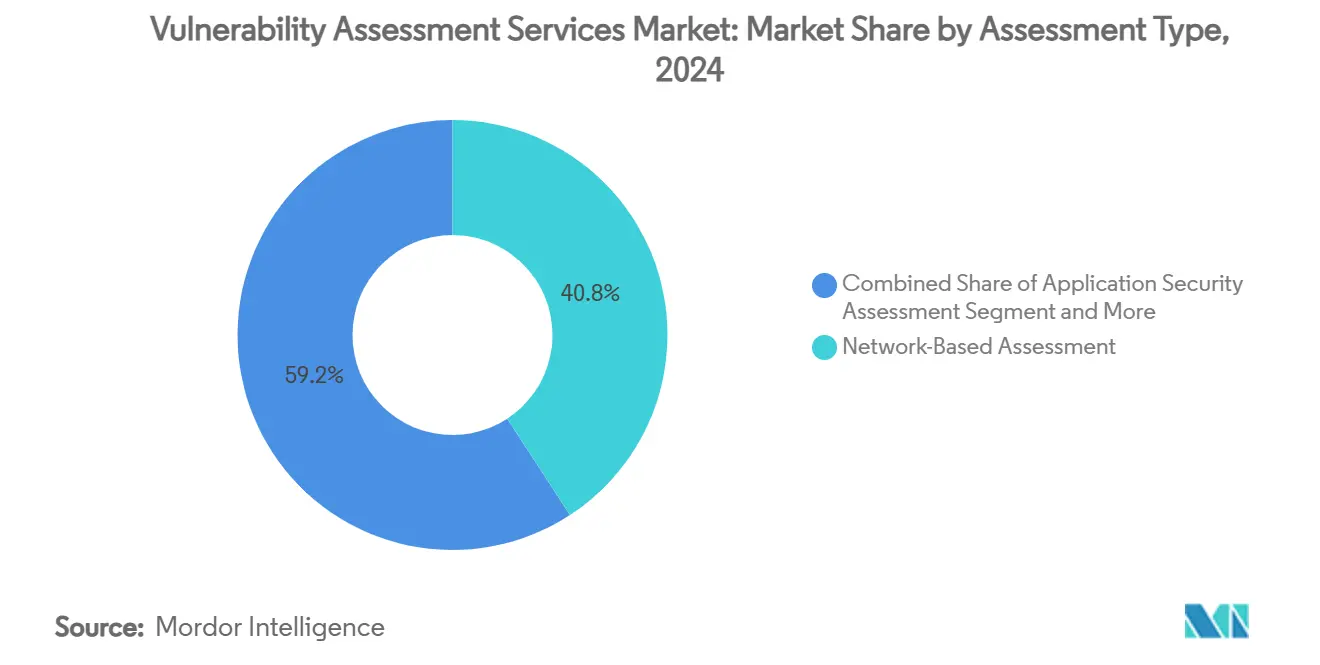
- By assessment type, network-based scanners held 40.8% of the vulnerability assessment services market share in 2024, whereas cloud security assessment is poised to record the fastest 10.5% CAGR to 2030.
- By deployment mode, on-premise implementations accounted for 50.3% of the vulnerability assessment services market size in 2024; cloud-based offerings are projected to rise at a 10.9% CAGR through 2030.
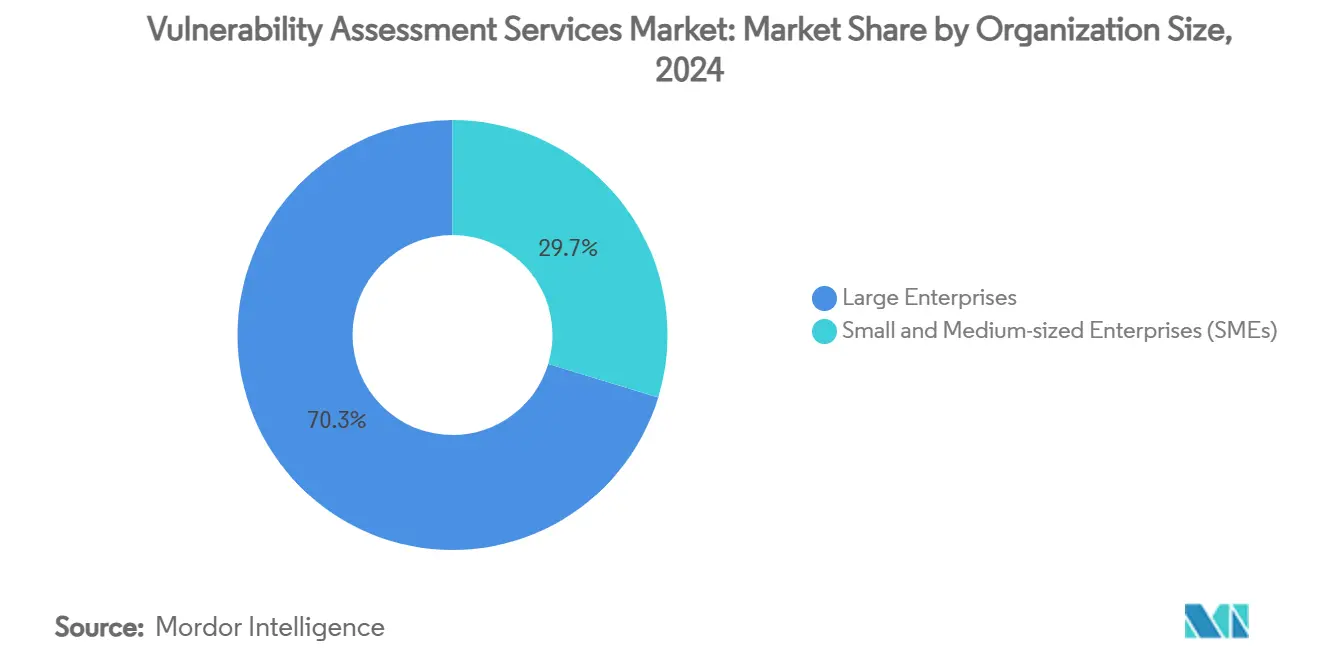
- By organization size, large enterprises contributed 70.3% revenue of the vulnerability assessment services market in 2024, while the SME segment is expected to post an 11.0% CAGR between 2025-2030.
- By end-use industry, IT and telecom represented 30.1% of the vulnerability assessment services market size in 2024; healthcare and life sciences is forecast to expand at 10.3% CAGR to 2030.
- By geography, North America led with a 38.2% share in 2024, yet Asia-Pacific is set to achieve the strongest 10.8% CAGR through 2030.
Global Vulnerability Assessment Services Market Trends and Insights
Drivers Impact Analysis*
| Driver | (~) % Impact on CAGR Forecast | Geographic Relevance | Impact Timeline |
|---|---|---|---|
| Escalating cloud-native application adoption | +2.1% | Global, with APAC leading digital transformation | Medium term (2-4 years) |
| Proliferation of API-centric software architectures | +1.8% | North America and EU, expanding to APAC | Short term (≤ 2 years) |
| Mandatory cyber-insurance prerequisites | +1.5% | North America and EU regulatory frameworks | Medium term (2-4 years) |
| Convergence of DevSecOps into CI/CD pipelines | +1.9% | Global, led by technology-forward enterprises | Short term (≤ 2 years) |
| Rapid roll-out of edge/IoT devices in OT networks | +1.3% | Global, with manufacturing and energy focus | Long term (≥ 4 years) |
| AI-powered automated scanning and triage tools | +2.2% | Global, early adoption in North America | Short term (≤ 2 years) |
| Source: Mordor Intelligence | |||
Escalating Cloud-Native Application Adoption
Migration to container orchestration and serverless architectures is redefining asset boundaries. Continuous monitoring that covers registries, ephemeral workloads, and IaC templates is replacing scheduled scans, reducing dwell time for exploitable flaws. Iron Mountain achieved a 30% boost in operational efficiency after consolidating seven tools into a single cloud-native platform. [1]Palo Alto Networks, “Iron Mountain Customer Case Study,” PALOALTONETWORKS.COM Agentless discovery now delivers deep visibility without degrading workload performance, while embedding scanners into CI pipelines shortens remediation cycles and curbs production rollbacks.
Proliferation of API-Centric Software Architectures
Modern applications rely on REST and GraphQL endpoints whose logic resides outside traditional web interfaces. Vulnerabilities such as broken object-level authorization and excessive data exposure require tools that parse OpenAPI files and exercise complex authentication flows. BugDazz and Pentest Tools illustrate the pivot to continuous API scanning with real-time risk scoring and compliance mapping for PCI DSS and HIPAA. [2]SecureLayer7, “BugDazz API Security Scanner,” SECURELAYER7.NET Integration with API gateways provides inventory awareness, closing blind spots that perimeter scanners cannot reach.
Mandatory Cyber-Insurance Prerequisites
Underwriters increasingly demand documented vulnerability scans, penetration tests, and proof of timely remediation before issuing policies or renewing coverage. Organizations unable to validate disciplined vulnerability management incur higher premiums or reduced coverage limits. Insurers now prefer monthly scanning cadences and quarterly penetration testing for critical segments, pushing budget-constrained SMEs toward managed service providers that bundle scanning with compliance reporting. Platforms delivering insurer-aligned dashboards are therefore gaining traction.
Convergence of DevSecOps into CI/CD Pipelines
Embedding security checkpoints inside automated build pipelines shifts detection earlier in the lifecycle, slashing remediation costs. Stelligent demonstrated container security scans that align with AWS ECS deployments without impeding release velocity. Microsoft Defender CSPM integrates with GitHub and Azure DevOps, providing pull-request security gates and policy enforcement. Enterprises adopting DevSecOps report shorter mean-time-to-remediate and improved cross-team accountability as developers gain actionable feedback within familiar workflows.
Restraints Impact Analysis*
| Restraint | (~) % Impact on CAGR Forecast | Geographic Relevance | Impact Timeline |
|---|---|---|---|
| Shortage of certified vulnerability analysts | -1.7% | Global, acute in APAC and emerging markets | Long term (≥ 4 years) |
| Alert fatigue from false positives in large estates | -1.4% | Global, particularly affecting large enterprises | Medium term (2-4 years) |
| Data-sovereignty barriers to cross-border scanning | -0.8% | EU, China, Russia with spillover to regulated sectors globally | Medium term (2-4 years) |
| Budget cannibalisation by XDR/zero-trust projects | -0.9% | North America and EU, expanding to APAC enterprises | Short term (≤ 2 years) |
| Source: Mordor Intelligence | |||
Shortage of Certified Vulnerability Analysts
More than half of large organizations cite limited specialist availability as the main obstacle to effective vulnerability response. SMEs are disproportionately affected as salary competition restricts access to scarce talent. Managed services and AI-driven workflows partially bridge the gap, yet concerns about losing contextual insight persist. Nordic Defender positions its 360° platform as an expertise extender, promising cost control and accelerated implementation.
Alert Fatigue from False Positives in Large Estates
Legacy scanners generate excessive low-value alerts that overwhelm teams responsible for thousands of assets. Duplicate findings across multi-cloud estates further muddy prioritization. Wiz’s visualization capabilities helped Assent reduce blind spots and streamline remediation workflows. AI-enhanced correlation engines such as VulnWatch cut noise and surface exploitable weaknesses first, restoring focus to high-impact vulnerabilities.
*Our forecasts treat driver/restraint impacts as directional, not additive. The impact forecasts reflect baseline growth, mix effects, and variable interactions.
Segment Analysis
By Assessment Type: Cloud Assessment Gains Velocity
Network-based scanning held 40.8% revenue share in 2024, underscoring regulatory reliance on perimeter assessments for legacy infrastructure. The vulnerability assessment services market size for cloud security assessment is projected to expand at a 10.5% CAGR through 2030 as containerized and serverless workloads proliferate. [3]NetRise, “Limitations of Traditional Network-Based Vulnerability Scanning,” NETRISE.IO Traditional network tools underreport software exposure by up to 200×, steering budgets toward agentless cloud scanners that reveal misconfigurations, drift, and hidden dependencies. Unified exposure management that correlates network, application, and container findings within a single dashboard is emerging as the benchmark for enterprise risk governance. Vendors embedding software bill-of-materials analytics into these platforms are shifting buyer expectations from episodic scans to continuous validation.
Rising adoption of application and API scanners complements the transition, since business logic now resides at the application layer rather than port-based boundaries. As a result, enterprises consider integrating SAST, DAST, and API fuzzing as part of a consolidated exposure lifecycle conducted alongside infrastructure scans. The expanding role of cloud-native security platforms signals reduced tolerance for fragmented tooling and opens pathways for strategic consolidation among market leaders.


By Deployment Mode: Hybrid Pragmatism Prevails
On-premise deployments captured 50.3% of the vulnerability assessment services market share in 2024 because regulated sectors continue to mandate local data residency and direct control over scanning frequency. Cloud-based delivery will grow at a 10.9% CAGR to 2030 as organizations pivot toward elasticity and simplified upkeep. Hybrid models have surfaced as the practical compromise, enabling centralized policy control while preserving on-premise scanners for air-gapped networks. Enterprises evaluating migration cite automatic threat-intelligence updates and global data correlation as core advantages that cloud platforms deliver.
Lower total cost of ownership and faster feature rollouts are converting cautious adopters, especially where multi-cloud estates outnumber on-premise assets. Agentless posture-management is therefore becoming standard for public cloud fleets, while containerized scanners are backhauling findings to unified SaaS dashboards. The vulnerability assessment services market is expected to continue blending local and hosted engines, particularly where data sovereignty clauses restrict wholesale cloud shift.
By Organization Size: SME Momentum Accelerates
Large enterprises generated 70.3% revenue in 2024 driven by extensive infrastructure footprints and mature risk-management programs. Yet small and medium enterprises will post the highest 11.0% CAGR between 2025-2030 as cyber-insurance and supply-chain requirements push smaller firms to adopt formal vulnerability workflows. Managed service providers and low-touch SaaS scanners democratize access to enterprise-grade capabilities, emphasizing guided remediation and simplified dashboards.
Budget sensitivity and limited staff compel SMEs to favor subscription models over on-premise investments. Platforms offering auto-prioritized findings and compliance templates for ISO 27001 or SOC 2 provide immediate value without deep expertise. The vulnerability assessment services industry, therefore, sees rising competition around packaging, pricing, and onboarding speed to capture this long-tail growth segment.
By End-Use Industry: Healthcare Risk Escalates
IT and telecom held a 30.1% stake in 2024 due to mature cyber postures and continuous uptime demands. However, healthcare and life sciences are predicted to grow at a 10.3% CAGR, given ransomware’s growing impact on patient data and connected devices. Regulatory scrutiny from HIPAA and the FDA’s Software Bill of Materials guidance amplifies urgency for continuous assessment across electronic health records, diagnostic equipment, and IoMT endpoints.
Legacy systems and limited patch windows impede timely remediation, making risk-based prioritization essential. Vendors offering healthcare-specific device fingerprints and FDA-aligned reporting are differentiating themselves. In parallel, critical infrastructure sectors such as energy and manufacturing ramp up assessments to protect operational technology after incidents like Norsk Hydro’s ransomware losses exceeding USD 67 million. Sector-specific compliance and safety mandates thus diversify demand profiles within the vulnerability assessment services market.
Geography Analysis
North America sustained its leadership by capturing 38.2% of global revenue in 2024. Federal guidance, sectoral mandates, and robust incident-sharing structures encourage continuous scanning, while AI-enabled exposure platforms support lean security teams. The regional outlook remains positive as organizations modernize legacy estates and integrate OT with IT, necessitating unified visibility to maintain compliance and minimize breach impact.
Europe follows closely, propelled by DORA and NIS2 enforcement that extend vulnerability assessment obligations beyond financial services into energy, healthcare, and transportation. Data residency and privacy regulations influence vendor selection, favoring solutions with in-region processing centers and granular role-based access. Recent findings of 40 critical vulnerabilities across Swiss hospitals spotlight systemic gaps and reinforce the need for specialized healthcare scanners.
The vulnerability assessment services market size in Asia-Pacific is forecast to rise at a 10.8% CAGR through 2030, fuelled by rapid digitization, regulatory catch-up, and growing threat awareness. Japan reports 97.2% board-level recognition of vulnerability management importance yet confronts acute talent constraints, indicating an opportunity for automation and managed offerings. Asia-Pacific is poised for the quickest expansion. Investment accelerates within manufacturing, e-commerce, and public sectors as high-profile attacks prompt executives to treat vulnerability management as revenue protection. Regional service providers increasingly partner with global vendors to deliver localized exposure analytics, while governments promote baselines such as Singapore’s Cybersecurity Code of Practice for Critical Information Infrastructure. Talent shortages and heterogeneous infrastructure remain challenges, amplifying demand for managed services and AI-driven triage that compress detection-to-patch timelines.

Competitive Landscape
The vulnerability assessment services market is moderately fragmented. Tenable, Qualys, and Rapid7 continue consolidating capabilities through targeted acquisitions such as Tenable’s USD 147 million purchase of Vulcan Cyber and Rapid7’s acquisition of Noetic Cyber. These moves aim to deliver holistic exposure platforms combining asset inventory, contextual risk scoring, and automated remediation.
Artificial intelligence differentiation is rising. Databricks leveraged large-scale data processing to refine criticality prediction, while Google’s proactive Big Sleep agent highlighted AI’s potential in zero-day containment. Patent activity led by IBM secures intellectual property around machine-learning-based vulnerability detection, influencing licensing and partnership dynamics. [4]PatentPC, “IBM’s Patent Strategy for AI-Powered Cybersecurity,” PATENTPC.COM
Specialist challengers focus on unresolved pain points. Orca Security advances agentless cloud coverage, Wiz visualizes blast-radius context, and Intruder packages streamlined scans for SMEs. Vertical solutions address healthcare IoMT, OT environments, and API security gaps. Vendors that integrate compliance evidence, threat intelligence, and orchestration into one workflow are gaining preference as buyers consolidate toolchains to offset analyst shortages and budget pressure.
Vulnerability Assessment Services Industry Leaders
Rapid7 Inc.
Qualys, Inc.
Tenable Holdings, Inc.
Trustwave Holdings, Inc.
Positive Technologies PJSC
- *Disclaimer: Major Players sorted in no particular order

Recent Industry Developments
- July 2025: Google’s Big Sleep AI neutralized a critical SQLite vulnerability pre-exploitation, showcasing preventive AI potential.
- June 2025: Qualys posted USD 159.9 million Q1 2025 revenue, highlighting AI-driven platform momentum.
- May 2025: Rapid7 acquired Noetic Cyber, extending attack-surface visibility across assets.
- February 2025: Tenable completed its Vulcan Cyber acquisition for USD 147 million, enhancing unified exposure management.
- January 2025: Bitsight and Moody’s formed a USD 250 million partnership to deepen cyber-risk quantification capabilities.


Global Vulnerability Assessment Services Market Report Scope
| Network-Based Assessment |
| Application Security Assessment |
| Cloud Security Assessment |
| Endpoint/Device Assessment |
| Database Assessment |
| On-Premise |
| Cloud-Based |
| Hybrid |
| Small and Medium Enterprises (SMEs) |
| Large Enterprises |
| BFSI |
| IT and Telecom |
| Healthcare and Life Sciences |
| Government and Defense |
| Retail and E-commerce |
| Energy and Utilities |
| Manufacturing |
| Other End-use Industries |
| North America | United States | |
| Canada | ||
| Mexico | ||
| South America | Brazil | |
| Argentina | ||
| Chile | ||
| Rest of South America | ||
| Europe | Germany | |
| United Kingdom | ||
| France | ||
| Italy | ||
| Spain | ||
| Rest of Europe | ||
| Asia-Pacific | China | |
| Japan | ||
| India | ||
| South Korea | ||
| Australia | ||
| Singapore | ||
| Malaysia | ||
| Rest of Asia-Pacific | ||
| Middle East and Africa | Middle East | Saudi Arabia |
| United Arab Emirates | ||
| Turkey | ||
| Rest of Middle East | ||
| Africa | South Africa | |
| Nigeria | ||
| Rest of Africa | ||
| By Assessment Type | Network-Based Assessment | ||
| Application Security Assessment | |||
| Cloud Security Assessment | |||
| Endpoint/Device Assessment | |||
| Database Assessment | |||
| By Deployment Mode | On-Premise | ||
| Cloud-Based | |||
| Hybrid | |||
| By Organization Size | Small and Medium Enterprises (SMEs) | ||
| Large Enterprises | |||
| By End-use Industry | BFSI | ||
| IT and Telecom | |||
| Healthcare and Life Sciences | |||
| Government and Defense | |||
| Retail and E-commerce | |||
| Energy and Utilities | |||
| Manufacturing | |||
| Other End-use Industries | |||
| By Geography | North America | United States | |
| Canada | |||
| Mexico | |||
| South America | Brazil | ||
| Argentina | |||
| Chile | |||
| Rest of South America | |||
| Europe | Germany | ||
| United Kingdom | |||
| France | |||
| Italy | |||
| Spain | |||
| Rest of Europe | |||
| Asia-Pacific | China | ||
| Japan | |||
| India | |||
| South Korea | |||
| Australia | |||
| Singapore | |||
| Malaysia | |||
| Rest of Asia-Pacific | |||
| Middle East and Africa | Middle East | Saudi Arabia | |
| United Arab Emirates | |||
| Turkey | |||
| Rest of Middle East | |||
| Africa | South Africa | ||
| Nigeria | |||
| Rest of Africa | |||


Key Questions Answered in the Report
How big is the vulnerability assessment services market in 2025?
It stood at USD 5.58 billion in 2025 with a 9.2% forecast CAGR toward 2030.
Which assessment type is growing the fastest?
Cloud security assessment is projected to rise at 10.5% CAGR as enterprises migrate workloads to multi-cloud environments.
What drives SME adoption of vulnerability assessment?
Cyber-insurance prerequisites and affordable managed SaaS scanners are propelling SMEs toward formal vulnerability management at an 11.0% CAGR.
Why is healthcare investment accelerating?
Escalating ransomware attacks and stricter HIPAA enforcement push the sector to grow at 10.3% CAGR through 2030.
Which region shows the highest growth momentum?
Asia-Pacific is expected to record a 10.8% CAGR through 2030 due to digitization and evolving regulatory frameworks.
How are vendors addressing analyst shortages?
Providers embed AI-powered prioritization and automated remediation workflows that cut manual triage by up to 95%.
Page last updated on:


