Threat Detection Systems Market Size and Share
Market Overview
| Study Period | 2020 - 2031 |
|---|---|
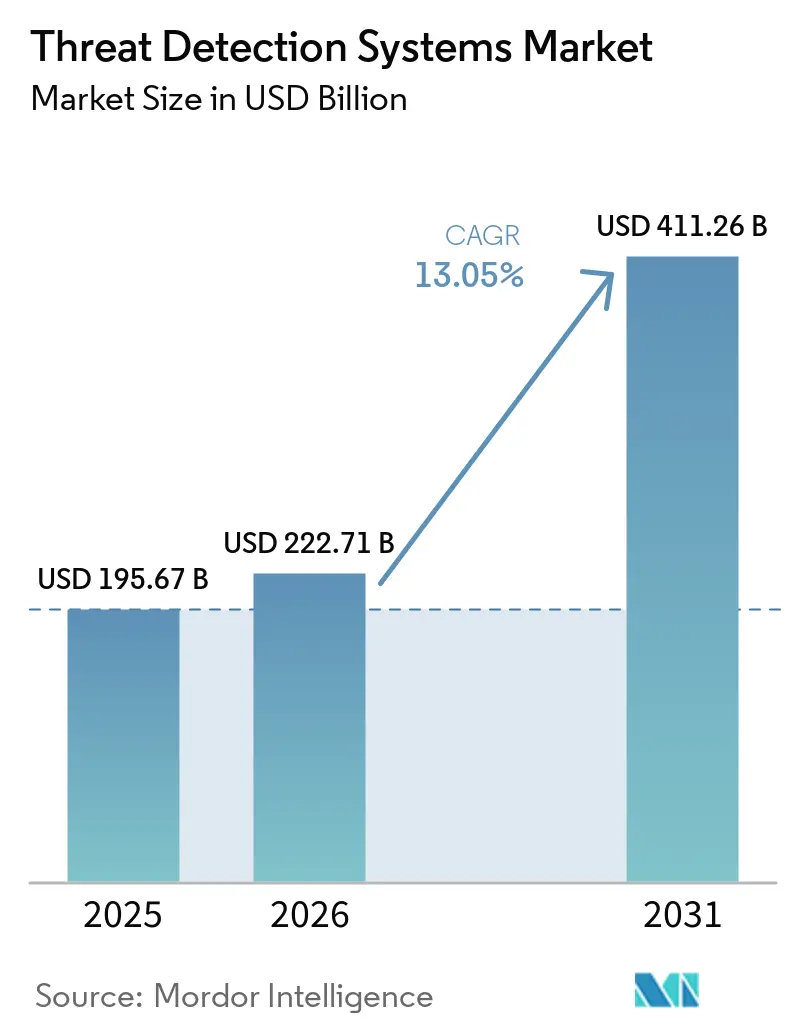
| Market Size (2026) | USD 222.71 Billion |
| Market Size (2031) | USD 411.26 Billion |
| Growth Rate (2026 - 2031) | 13.05% CAGR |
| Fastest Growing Market | Asia Pacific |
| Largest Market | North America |
| Market Concentration | Medium |
Major Players *Disclaimer: Major Players sorted in no particular order Image © Mordor Intelligence. Reuse requires attribution under CC BY 4.0. | |
Threat Detection Systems Market Analysis by Mordor Intelligence
The threat detection systems market size was valued at USD 195.67 billion in 2025 and estimated to grow from USD 222.71 billion in 2026 to reach USD 411.26 billion by 2031, at a CAGR of 13.05% during the forecast period (2026-2031). Three converging forces are accelerating this expansion. Operational-technology and information-technology networks are blending across critical infrastructure, exposing legacy assets to internet-facing threats. Zero-day exploits are rising faster than patch cycles, forcing buyers to favor behavior-based analytics that spot malicious activity without signature updates. At the same time, cloud-native detection stacks are displacing on-premises appliances, allowing elastic compute to process petabyte-scale telemetry in real time. These trends collectively reinforce the purchasing priority for unified platforms able to ingest diverse data, baseline normal behavior, and automate triage. Vendors that couple advanced analytics with managed services are positioned to capture heightened demand as organizations confront talent shortages and rising compliance burdens.
Key Report Takeaways
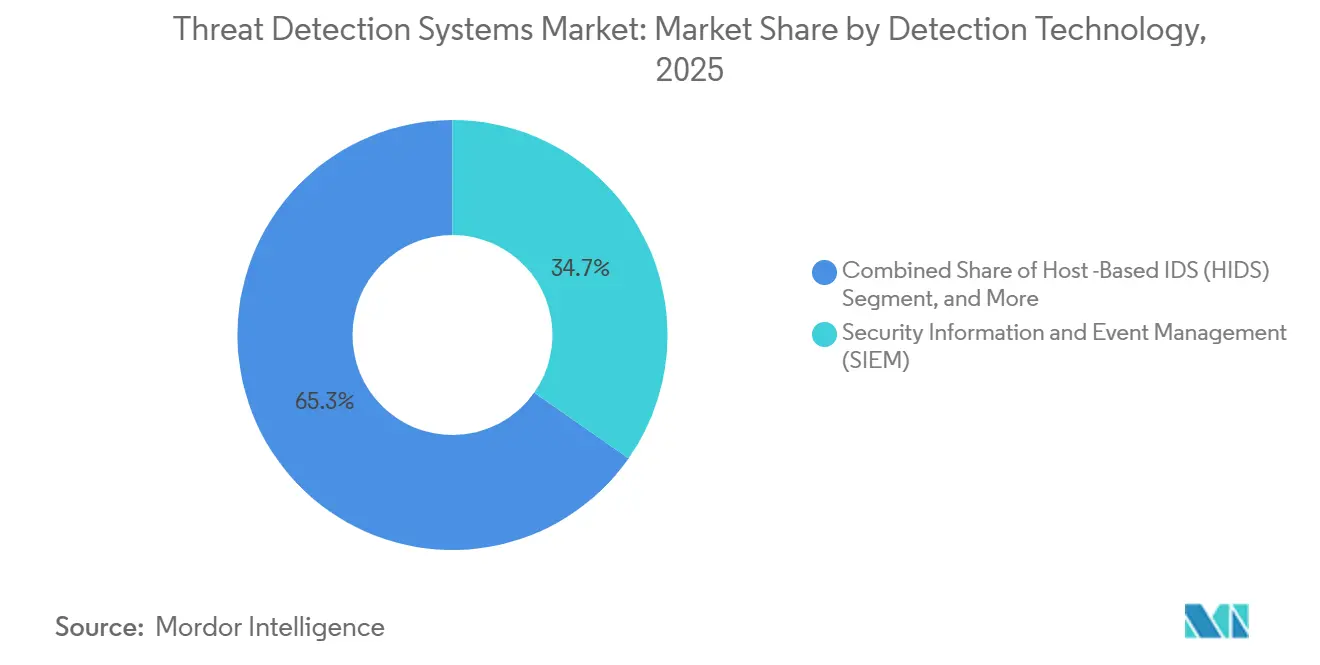
- By detection technology, Security Information and Event Management platforms led with 34.74% of the threat detection systems market share in 2025, while behavioral analytics is on track to post a 13.74% CAGR through 2031.
- By deployment mode, on-premises architectures accounted for 51.19% of revenue share in 2025, but cloud-based models are projected to expand at a 13.64% CAGR through 2031.
- By component, software accounted for 47.78% of the threat detection systems market in 2025; services are advancing at a 13.84% CAGR over 2026-2031.
- By end-user industry, the BFSI segment accounted for 29.73% of 2025 spending, whereas healthcare is forecast to register the fastest CAGR of 13.91% to 2031.
- By geography, North America accounted for 38.91% of 2025 revenue; Asia-Pacific is set to deliver the fastest 13.88% CAGR during the outlook period.
Note: Market size and forecast figures in this report are generated using Mordor Intelligence’s proprietary estimation framework, updated with the latest available data and insights as of January 2026.
Global Threat Detection Systems Market Trends and Insights
Drivers Impact Analysis*
| Driver | (~) % Impact on CAGR Forecast | Geographic Relevance | Impact Timeline |
|---|---|---|---|
| Escalating Zero-Day Exploit Activity | +2.8% | North America and Europe, with global spillover | Short term (≤ 2 years) |
| Rapid Convergence of OT and IT in Critical Infrastructure | +2.5% | North America, Europe, and Asia‑Pacific | Medium term (2-4 years) |
| Shift Toward Cloud-Native Threat Detection Stacks | +2.3% | North America, Europe, and Asia‑Pacific | Medium term (2-4 years) |
| Proliferation of LLM-Generated Malware Variants | +1.9% | Global; early concentration in North America and Europe | Short term (≤ 2 years) |
| Mandatory Quantum-Readiness Audits Across Supply Chains | +1.4% | North America, Europe, and Asia‑Pacific | Long term (≥ 4 years) |
| Emergence of 6G-Enabled Micro-Segmentation for Critical Assets | +1.2% | Asia‑Pacific pilot programs; standards development in North America and Europe | Long term (≥ 4 years) |
| Source: Mordor Intelligence | |||
Escalating Zero-Day Exploits
Ninety previously unknown vulnerabilities were weaponized during 2025, forcing enterprises to pivot from signature-driven tools to behavioral methods that flag post-exploitation tactics such as lateral movement and data staging.[1]Rapid7, “2025 Vulnerability Intelligence Report,” rapid7.com The median lag between public disclosure and mass exploitation shrank to five days, compressing response windows and lifting demand for solutions that learn new patterns autonomously. Ransomware crews leveraged zero-day flaws as the entry vector in 38% of all incidents, accounting for USD 12.5 billion in reported losses. As a result, procurement teams now benchmark platforms on their ability to surface unknown techniques rather than match known indicators.
Rapid OT-IT Convergence in Critical Infrastructure
Digitization of industrial control systems is dissolving formerly air-gapped perimeters, merging programmable-logic controllers with cloud dashboards that support predictive maintenance.[2]Cybersecurity and Infrastructure Security Agency, “Known Exploited Vulnerabilities Catalog,” cisa.gov The EU’s NIS2 directive and FERC Order 918 require intrusion detection even on low-impact assets, pushing utilities to deploy protocol-aware monitoring able to parse Modbus, DNP3, and OPC-UA traffic. In Asia-Pacific, governments are funding large-scale pilots to protect manufacturing hubs, yet fewer than 30% of plants have compliant solutions. Vendors offering tailored OT visibility stand to gain as convergence accelerates.
Shift to Cloud-Native Detection Stacks
Enterprises increasingly offload log ingestion and correlation to hyperscale clouds, where elastic compute completes analytics that on-premises appliances cannot handle cost-effectively. A Forrester study found that a leading cloud-native SIEM lowered total cost of ownership by 44% and cut false positives by 79%.[3]Microsoft, “Sentinel Total Economic Impact Study,” microsoft.com Agentless integrations simplify rollouts; a single provider ingests telemetry across Amazon Web Services, Microsoft Azure, and Google Cloud without requiring sensors. Hybrid configurations keep regulated data on-premises while harnessing cloud analytics, widening the addressable base for vendors.
Proliferation of LLM-Generated Malware Variants
Attackers now exploit large language models to produce polymorphic code and personalized phishing lures in hours. Google researchers linked new families such as QuietVault and FruitShell to AI-generated source patterns. Behavioral engines detected one AI-crafted exploit in customer traffic before public disclosure, underscoring the edge that anomaly baselining provides. Defensive platforms respond by using their own LLMs to auto-write Sigma rules from raw threat reports, shrinking response cycles from days to minutes.
Restraints Impact Analysis*
| Restraint | (~) % Impact on CAGR Forecast | Geographic Relevance | Impact Timeline |
|---|---|---|---|
| High False-Positive Fatigue Among Security Operations Center (SOC) Teams | -1.6% | North America and Europe; mature SOC environments globally | Short term (≤ 2 years) |
| Shortage of Skilled Threat-Hunting Talent | -1.4% | North America, Europe, and Asia‑Pacific | Medium term (2-4 years) |
| Legacy System Integration Complexity | -0.9% | Global; most acute in manufacturing, energy, and utilities sectors | Medium term (2-4 years) |
| Data-Sovereignty Restrictions Limiting Telemetry Sharing | -0.7% | Europe, China, Russia, Middle East, and Africa | Long term (≥ 4 years) |
| Source: Mordor Intelligence | |||
High False-Positive Fatigue among SOC Teams
Analysts processed 4,484 alerts per week in 2025, discarding 67% as false positives, which left 42% of remaining alerts unreviewed. Burnout reached 67% and churn risk hit 56%, inflating labor costs and eroding institutional knowledge. Organizations lose roughly one-quarter of SOC hours to benign noise, and complex hybrid environments exacerbate tuning challenges. Platforms that extend look-back periods and correlate identity, endpoint, and network anomalies have trimmed false positives by 79%, making alert quality an urgent buying criterion.
Shortage of Threat-Hunting Talent Pool
A global workforce gap of 4 million positions persisted in 2025, including 225,000 vacancies in the United States. Median threat-hunter pay climbed to USD 120,000, yet supply still trails demand because mastery of network forensics, reverse engineering, and scripting takes years. Asia-Pacific faces the steepest deficit, with Japan alone short 190,000 specialists despite a USD 3.8 billion federal cyber budget. Buyers increasingly outsource detection and response or adopt autonomous platforms that generate correlation logic without human input, but the talent shortfall is expected to trim 1.4 percentage points from long-term growth.
*Our forecasts treat driver/restraint impacts as directional, not additive. The impact forecasts reflect baseline growth, mix effects, and variable interactions.
Segment Analysis
By Detection Technology: Behavioral Analytics Gains as SIEM Matures
Behavioral analytics posted a 13.74% CAGR, outpacing the overall threat detection systems market. SIEM retained 34.74% revenue in 2025, but its dominance now hinges on embedded machine learning modules that raise detection accuracy from 78-85% to 95-98%. The market for behavioral analytics is projected to grow sharply, as 89% of Fortune 500 companies have adopted baselining tools. Meanwhile, network intrusion detection remains essential for packet-level inspection, and unified threat management appeals to midsize firms that seek an all-in-one stack. Emerging deception and sandbox techniques account for a modest yet growing slice of the threat detection systems market.
Demand for threat intelligence platforms has intensified; 85% of major information-sharing centers now automate STIX 2.1 indicator exchanges on one leading platform. Vendors that fuse real-time feeds with internal telemetry deliver higher-confidence alerts that reduce triage burden. As SIEM data lakes swell, buyers scrutinize ingestion pricing, retention policies, and AI explainability. The competitive focus is shifting toward analytics depth rather than simple log aggregation, underpinning the steady growth of advanced behavior engines across the market.


By Deployment Mode: Cloud Architectures Narrow the On-Premises Lead
On-premises options still accounted for 51.19% of 2025 revenue, as critical infrastructure operators and sovereign entities continue to keep sensitive logs on-premises. Yet cloud models, growing at a 13.64% CAGR, are closing the gap by offering elastic compute for bursty workloads and advanced analytics that exceed appliance capacity. The threat detection systems market share tilted toward hybrid in 2026, as utilities retained on-site operational telemetry while shipping identity logs to hyperscale analytics. Solutions that synchronize policies across both realms, such as hybrid web application firewalls, satisfy sovereignty rules while tapping cloud-native efficiencies.
Seven pain points hinder hybrid rollouts, including misaligned identities, shadow IT, and compliance drift. Providers that abstract complexity through agentless connectors win faster adoption. In latency-critical setups, for example, factory floors that monitor millisecond control loops, on-prem will persist. Still, macro trends favor cloud expansion, as pricing and storage flexibility offset regulatory hurdles, broadening the market for threat detection systems. As pricing and storage flexibility offset regulatory hurdles, broadening the market for threat detection systems that monitor millisecond control loops, on-premise growing, are closing the gap by offering elastic compute for burstworkloads, accounting for a major share of revenue because critical infrastructure operators and sovereign entities keep sensitive logs on-premises, as utilities retain on-site operational telemetry while shipping on-premises.
By End-User Industry: Healthcare Surges as Ransomware Intensifies
Healthcare is on course for a 13.91% CAGR to 2031, the quickest among tracked sectors, as ransomware crews hit hospitals and laboratories, encrypting patient data and disrupting clinical workflows. In 2025, 460 incidents affected more than 2 million patients, and 4 of the 10 largest breaches occurred at healthcare providers. Legacy devices running outdated operating systems expand the attack surface, driving hospitals to invest in lateral-movement detection and segmentation tools. The threat detection systems market size allotted to healthcare is therefore growing faster than budget averages in other verticals.
BFSI-led spending in 2025, with 29.73% share, owing to strict regulations such as the EU Digital Operational Resilience Act. Average ransomware costs reached USD 6.08 million per incident, incentivizing banks to deploy behavior analytics that spot credential stuffing and synthetic identity fraud. Government and defense, energy and utilities, manufacturing, retail, and transportation each exhibit unique threat patterns, supply-chain compromise, point-of-sale malware, or SCADA tampering that spur specialized purchases. Collectively, these dynamics maintain healthy market diversification.

By Component: Services Outpace Software as Complexity Rises
Software licenses captured 47.78% of 2025 spending, but service engagements, managed detection and response, integration, and training, are growing at 13.84% CAGR as organizations fill skill gaps with third-party expertise. The threat detection systems market size for services expands whenever enterprises lack headcount to tune detection logic or conduct 24/7 hunting. Managed providers deliver continuous monitoring under subscription contracts that scale with log volume, turning capital expense into operating expenditure.
Vendors embed automation to reduce the burden on services; an AI SOC engine can automatically generate correlation rules and suggest fixes, cutting operationalization time from days to minutes. Even so, regulated verticals value external validation, so advisory and incident response retain significance. Hardware outlays continue to decline as virtual sensors replace taps, but purpose-built appliances endure where 100-gigabit inspection or air-gapped operations are required.
Geography Analysis
North America accounted for 38.91% of 2025 revenue, driven by financial hubs, cloud service providers, and defense primes. Order 918, effective January 2026, extends intrusion detection to low-impact grid assets, broadening the customer pool. CISA added eight exploited vulnerabilities to its catalog in April 2026, prompting patching across federal agencies and critical infrastructure operators. The United States Department of Defense earmarked USD 20.5 billion for cyberspace activities in its fiscal 2027 budget, reinforcing domestic demand. Canada and Mexico mirror this trajectory through power-sector regulations and cross-border data-sharing accords that raise the baseline for investment in the market.
Asia-Pacific is the fastest-growing region at a 13.88% CAGR. Governments there unveiled multibillion-dollar cyber budgets, and 79% of security leaders plan to increase threat intelligence spending in 2026. Japan allocated USD 3.8 billion to bolster supply-chain resilience and train cyber talent to address a 190,000-person shortfall. China, India, South Korea, and Australia are safeguarding state-run enterprises, telcos, and payment systems as 27% of global state-backed campaigns now target the region. Local data-residency laws shape architecture choices, nudging firms toward in-country clouds or hybrid builds.
Europe tightens corporate obligations through the Network and Information Security Directive 2 and the forthcoming Cyber Resilience Act, which will require quantum-safe cryptography in connected devices by 2027. Middle East, Africa, and South America remain early-stage yet promising, as critical infrastructure protections emerge and cloud adoption accelerates. Data-sovereignty limits and skills gaps temper near-term revenue, but multilateral cyber accords and rising insurance premiums are increasing buyer urgency, expanding the long-run addressable share of the threat detection systems market.


Competitive Landscape
The threat detection systems market is moderately fragmented, with the top 10 suppliers accounting for roughly 45% of 2025 revenue. Established networking vendors integrate intrusion detection with secure access service edge offerings, while cloud-native challengers differentiate through agentless ingestion and consumption pricing. M&A centers on folding behavioral analytics and threat intelligence into broader platforms; Palo Alto Networks’ January 2025 migration of UEBA customers to an integrated Behavior Threats module typifies portfolio consolidation.[4]Palo Alto Networks, “Platform Explorer,” paloaltonetworks.com
White-space opens where OT meets IT. Fewer than 30% of manufacturing sites fully parse industrial protocols, creating headroom for vendors fluent in IEC 62443 controls. Autonomous detection powered by large language models is another frontier; platforms can now draft correlation rules, assemble incident timelines, and suggest mitigations without analyst input. Competitive intensity is fiercest in SIEM, where Microsoft, Splunk, IBM, and Elastic battle on analytics depth and ingestion economics. Behavior analytics and threat intelligence niches remain more moderately fragmented, giving nimble entrants room to innovate around vertical-specific datasets.
Second-tier players capitalize on deployment friction. An agentless system that connects to five major clouds reduces mean deployment time and appeals to companies wary of sensor sprawl. Similarly, an eBPF-based runtime monitor avoids the need for kernel modules, easing security within container fleets. As customers prioritize operational simplicity, vendors able to deliver seamless integrations, transparent pricing, and demonstrable reductions in false positives are likely to rise in the market's revenue rankings.
Threat Detection Systems Industry Leaders
Cisco Systems, Inc.
Palo Alto Networks, Inc.
Fortinet, Inc.
Check Point Software Technologies Ltd.
IBM Corporation
- *Disclaimer: Major Players sorted in no particular order


Recent Industry Developments
- April 2026: CISA added eight vulnerabilities to its Known Exploited Vulnerabilities catalog and issued binding directives requiring federal agencies to remediate within 21 days.
- March 2026: Wiz released its 2026 Threat Intelligence Platform Buyer’s Guide, evaluating ten leading providers on data breadth and automation.
- January 2026: FERC Order 918 took effect, mandating intrusion detection on low-impact bulk electric system assets.
- October 2025: Cyware launched bi-directional threat-intelligence sharing with Microsoft Sentinel, cutting operationalization time from hours to minutes.


Global Threat Detection Systems Market Report Scope
The Threat Detection Systems Market encompasses the development and deployment of technologies designed to identify, monitor, and mitigate potential security threats across digital, physical, and networked environments. These systems utilize advanced tools, including artificial intelligence, machine learning, big data analytics, and behavioral monitoring, to detect anomalies, cyberattacks, malware, and unauthorized activities in real time, thereby strengthening cybersecurity and risk management strategies.
The Threat Detection Systems Market Report is Segmented by Detection Technology (Network Intrusion Detection Systems, Host-Based IDS, SIEM, Unified Threat Management, Threat Intelligence Platforms, Behavior Analytics, and Other Detection Technologies), Deployment Mode (On-Premises, Cloud-Based, and Hybrid), End-User Industry (BFSI, Government and Defense, Healthcare, IT and Telecom, Energy and Utilities, Manufacturing, Retail, Transportation and Logistics, and Other End-User Industries), Component (Hardware, Software, and Services), and Geography (North America, Europe, Asia-Pacific, Middle East, Africa, and South America). The Market Forecasts are Provided in Terms of Value (USD).
| Network Intrusion Detection Systems (NIDS) |
| Host-Based IDS (HIDS) |
| Security Information and Event Management (SIEM) |
| Unified Threat Management (UTM) |
| Threat Intelligence Platforms |
| Behavior Analytics |
| Other Detection Technologies |
| On-Premises |
| Cloud-Based |
| Hybrid |
| Banking, Financial Services and Insurance (BFSI) |
| Government and Defense |
| Healthcare |
| IT and Telecom |
| Energy and Utilities |
| Manufacturing |
| Retail |
| Transportation and Logistics |
| Other End-User Industries |
| Hardware |
| Software |
| Services |
| North America | United States |
| Canada | |
| Mexico | |
| Europe | Germany |
| United Kingdom | |
| France | |
| Russia | |
| Rest of Europe | |
| Asia-Pacific | China |
| Japan | |
| India | |
| South Korea | |
| Australia | |
| Rest of Asia-Pacific | |
| Middle East | Saudi Arabia |
| United Arab Emirates | |
| Rest of Middle East | |
| Africa | South Africa |
| Egypt | |
| Rest of Africa | |
| South America | Brazil |
| Argentina | |
| Rest of South America |
| By Detection Technology | Network Intrusion Detection Systems (NIDS) | |
| Host-Based IDS (HIDS) | ||
| Security Information and Event Management (SIEM) | ||
| Unified Threat Management (UTM) | ||
| Threat Intelligence Platforms | ||
| Behavior Analytics | ||
| Other Detection Technologies | ||
| By Deployment Mode | On-Premises | |
| Cloud-Based | ||
| Hybrid | ||
| By End-User Industry | Banking, Financial Services and Insurance (BFSI) | |
| Government and Defense | ||
| Healthcare | ||
| IT and Telecom | ||
| Energy and Utilities | ||
| Manufacturing | ||
| Retail | ||
| Transportation and Logistics | ||
| Other End-User Industries | ||
| By Component | Hardware | |
| Software | ||
| Services | ||
| By Geography | North America | United States |
| Canada | ||
| Mexico | ||
| Europe | Germany | |
| United Kingdom | ||
| France | ||
| Russia | ||
| Rest of Europe | ||
| Asia-Pacific | China | |
| Japan | ||
| India | ||
| South Korea | ||
| Australia | ||
| Rest of Asia-Pacific | ||
| Middle East | Saudi Arabia | |
| United Arab Emirates | ||
| Rest of Middle East | ||
| Africa | South Africa | |
| Egypt | ||
| Rest of Africa | ||
| South America | Brazil | |
| Argentina | ||
| Rest of South America | ||


Key Questions Answered in the Report
How large is global spending on threat detection systems in 2026?
The global threat detection systems market is estimated at USD 222.71 billion in 2026 and is projected to reach USD 411.26 billion by 2031.
Which deployment mode is growing the fastest?
Cloud-based deployments are growing at a 13.64% CAGR through 2031, driven by the migration of analytics workloads to hyperscale cloud platforms.
What segment leads by revenue?
Security Information and Event Management (SIEM) platforms accounted for 34.74% of market revenue in 2025, maintaining the largest share among threat detection technologies.
Why is healthcare spending accelerating?
Healthcare is experiencing the highest ransomware attack frequency, with security investments forecast to grow at a 13.91% CAGR to protect patient data and legacy medical devices.
Which region shows the strongest growth momentum?
Asia-Pacific is expected to register a 13.88% CAGR through 2031, supported by expanding sovereign cybersecurity budgets and rapid enterprise digitization.
How are zero-day exploits influencing procurement decisions?
The weaponization of 90 zero-day vulnerabilities in 2025 has pushed buyers toward behavior-based detection platforms that identify attacks without relying solely on signature databases.
Page last updated on:


