Advanced Persistent Threat Protection Market Size and Share
Market Overview
| Study Period | 2020 - 2031 |
|---|---|
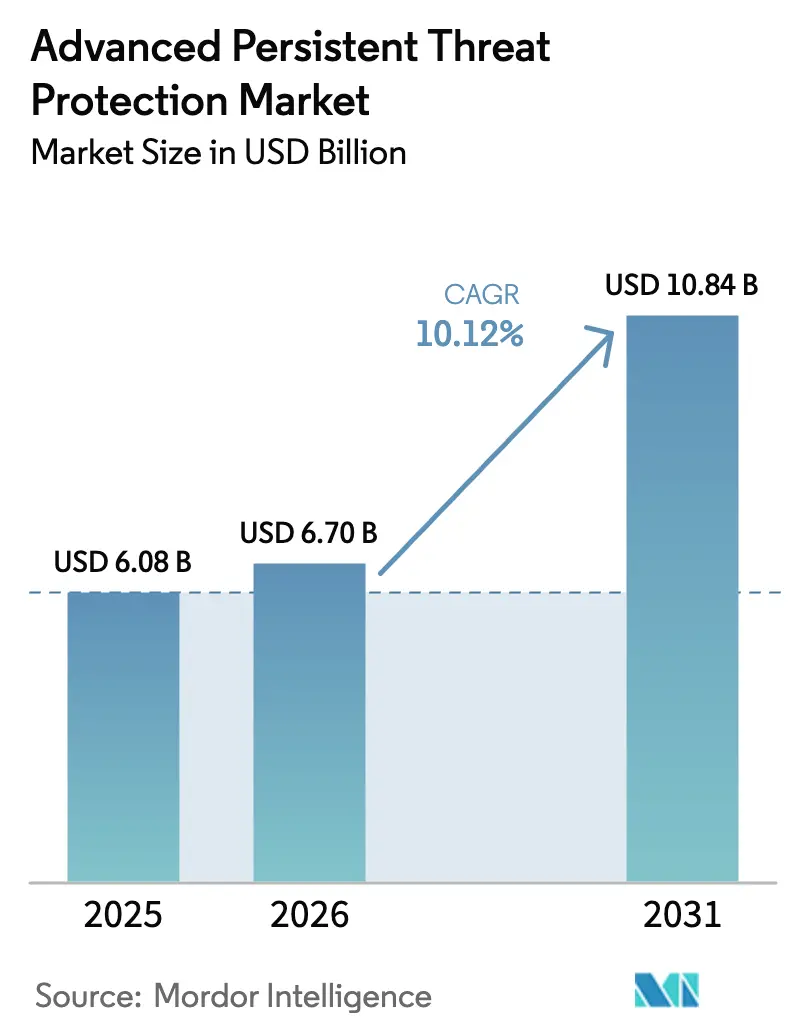
| Market Size (2026) | USD 6.7 Billion |
| Market Size (2031) | USD 10.84 Billion |
| Growth Rate (2026 - 2031) | 10.12% CAGR |
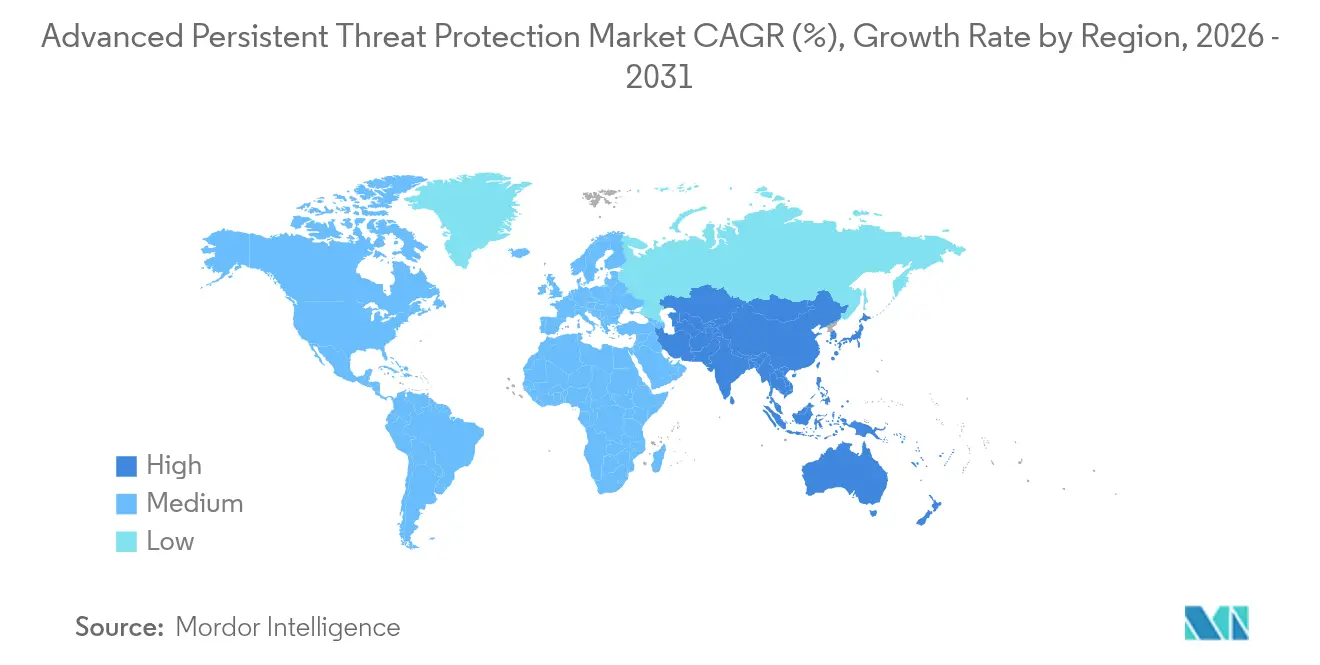
| Fastest Growing Market | Asia Pacific |
| Largest Market | North America |
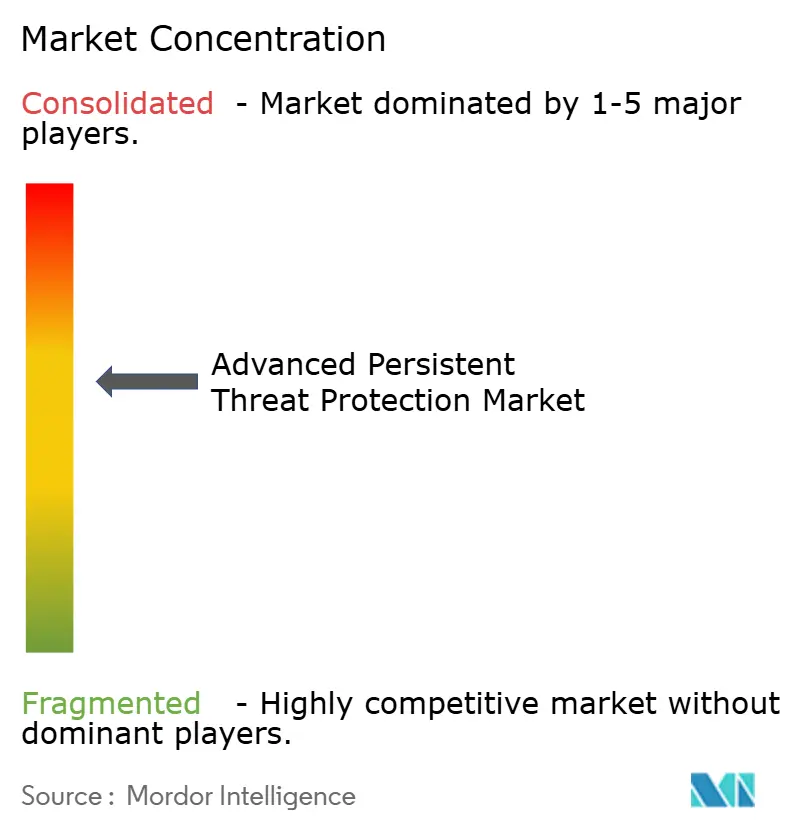
| Market Concentration | Medium |
Major Players *Disclaimer: Major Players sorted in no particular order Image © Mordor Intelligence. Reuse requires attribution under CC BY 4.0. | |
Advanced Persistent Threat Protection Market Analysis by Mordor Intelligence
The Advanced Persistent Threat Protection market size is expected to grow from USD 6.08 billion in 2025 to USD 6.7 billion in 2026 and is forecast to reach USD 10.84 billion by 2031 at 10.12% CAGR over 2026-2031. This trajectory mirrors an up-tick in multi-stage cyber-attacks on critical infrastructure, tighter regulatory mandates, and the widening enterprise attack surface created by accelerated digital transformation. Geopolitical tension and supply-chain fragility amplify board-level focus on resilience, while Zero Trust adoption, AI-driven analytics, and platform consolidation shape vendor roadmaps. Heightened compliance pressure from NIS2 in Europe, FDA rules in the United States, and similar frameworks in Asia Pacific reinforce demand for integrated, cloud-centric defenses. In parallel, managed service uptake is rising as organizations confront talent shortages and seek outcome-based protection.
Key Report Takeaways
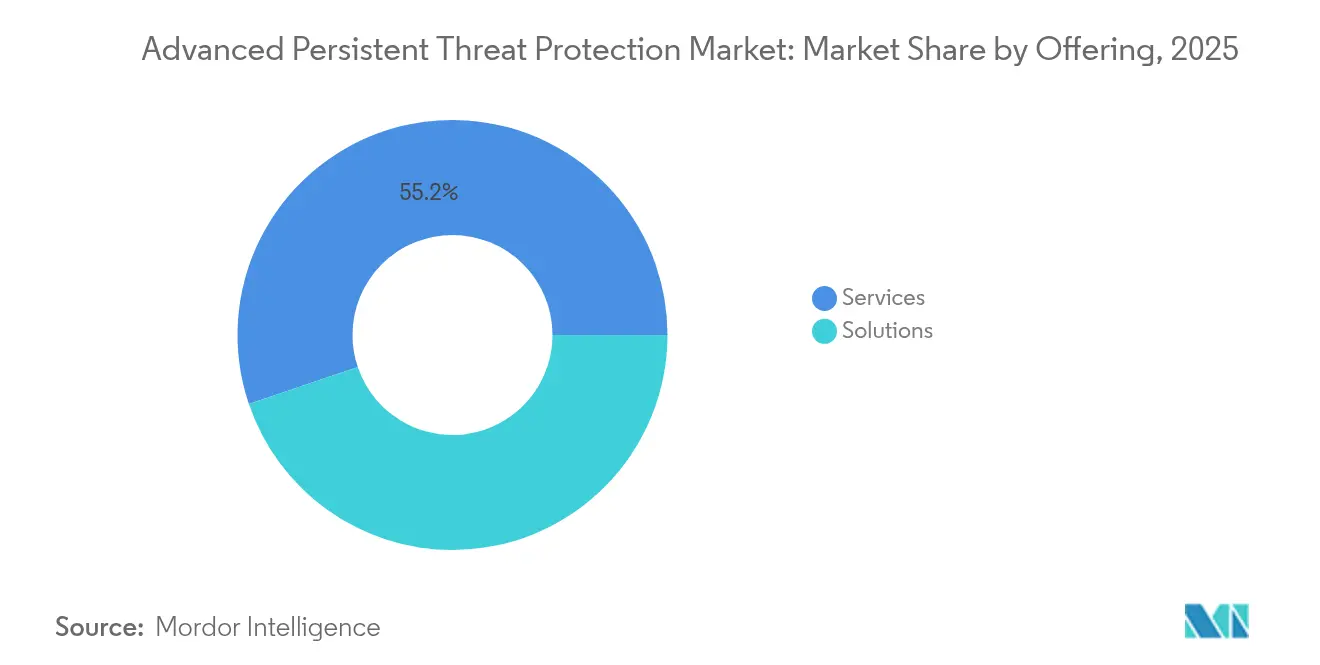
- By offering, services contributed 55.20% of 2025 revenue, whereas solutions posted the highest projected CAGR at 10.74% to 2031.
- By solution type, endpoint protection led with 22.05% of Advanced Persistent Threat Protection market share in 2025; threat intelligence platforms are poised for a 12.2% CAGR through 2031.
- By service type, integration and deployment held 37.6% share of the Advanced Persistent Threat Protection market size in 2025, while managed security services are set to advance at 12.68% CAGR.
- By deployment mode, on-premise accounted for 59.70% revenue in 2025; cloud is expected to expand at 12.31% CAGR.
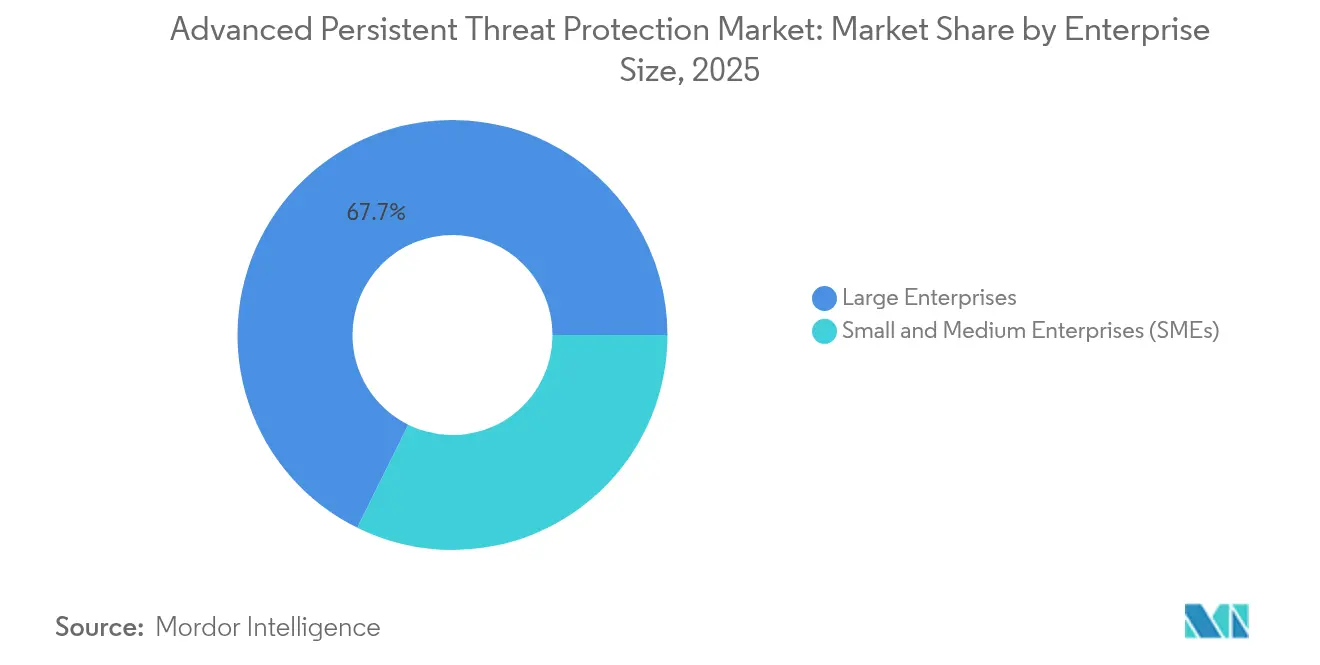
- By enterprise size, large enterprises captured 67.70% revenue in 2025; SMEs will see an estimated 10.39% CAGR.
- By vertical, BFSI retained 25.15% share in 2025; retail & e-commerce will accelerate at 10.86% CAGR.
- By geography, North America represented 31.95% revenue in 2025, while Asia Pacific is projected to grow at 12.18% CAGR.
Note: Market size and forecast figures in this report are generated using Mordor Intelligence’s proprietary estimation framework, updated with the latest available data and insights as of 2026.
Global Advanced Persistent Threat Protection Market Trends and Insights
Drivers Impact Analysis*
| Driver | (~) % Impact on CAGR Forecast | Geographic Relevance | Impact Timeline |
|---|---|---|---|
| Escalating Multi-Stage Ransomware and Supply-Chain Attacks Targeting BFSI in NA and EU | +2.1% | North America and EU | Medium term (2-4 years) |
| Zero-Trust and NIS2 Mandates Fueling Spend by EU Telecom Operators | +1.8% | Europe | Short term (≤ 2 years) |
| Cloud-Native Adoption in APAC Accelerating CSPM and CNAPP Uptake | +1.6% | Asia-Pacific core, spill-over to MEA | Medium term (2-4 years) |
| AI-Powered MITRE ATTandCK Correlation Engines Boosting MSSP Demand | +1.4% | Global | Long term (≥ 4 years) |
| SOAR-Driven MTTR Reduction in Fortune-500 Enterprises | +1.2% | North America and EU | Medium term (2-4 years) |
| FDA HIoT Cyber Rules Amplifying US Hospital Investments | +0.9% | North America | Short term (≤ 2 years) |
| Source: Mordor Intelligence | |||
Escalating Multi-Stage Ransomware and Supply-Chain Attacks Targeting BFSI in NA and EU
Financial institutions experienced sophisticated, multi-stage ransomware episodes in 2025 that exploited third-party providers, typified by the Toppan Next Tech breach that exposed data at several major banks. [1]Monetary Authority of Singapore, “Ransomware Attack on Toppan Next Tech,” mas.gov.sgSupply-chain footholds enabled lateral movement across interconnected payment ecosystems, driving regulators to tighten vendor-risk protocols. Penalties, prolonged service disruption, and customer attrition sharpened the purchasing focus on real-time threat hunting, anomaly detection across core banking workflows, and automated response. Consequently, banks increased capital expenditure on AI-enabled platforms that map adversary techniques to MITRE ATT&CK and run continuous stress testing of controls.
Zero Trust and NIS2 Mandates Fueling Spend by EU Telecom Operators
The NIS2 Directive, enforced from October 2024, compels telecom providers to implement measures such as multi-factor authentication, segmentation, and continuous monitoring, with fines up to EUR 10 million (USD 10.9 million) for non-compliance.[2]European Union Agency for Cybersecurity, “NIS2 Technical Implementation Guidance,” enisa.europa.eu Operators must also audit vendor cybersecurity posture, propelling uptake of integrated threat-protection suites and managed detection services. Zero Trust roll-outs aim to curb lateral movement in 5G and legacy networks without degrading uptime, and reciprocal compliance obligations cascade to enterprise customers, expanding the services addressable market.
Cloud-Native Adoption in APAC Accelerating CSPM and CNAPP Uptake
Asia Pacific enterprises are migrating workloads at record pace, spurring demand for cloud-security posture management and application-protection platforms that unify workload, identity, and compliance control. Regulatory expectations in Singapore and China require 24/7 visibility and automated remediation, stimulating investment in AI-driven CNAPP solutions.[3]MITRE, “MITRE Launches AI Incident Sharing Initiative,” mitre.org The region’s acute talent gap elevates managed service adoption, while containerized and serverless environments expose gaps that traditional tools cannot address.
AI-Powered MITRE ATT&CK Correlation Engines Boosting MSSP Demand
MITRE’s October 2024 AI Incident Sharing initiative standardized adversary tactic reporting, accelerating the integration of AI correlation engines that cut false positives and predict attack progression. Academic work shows these engines reduce detection latency by 75% in critical infrastructure scenarios. Managed security providers harness these gains to offset analyst shortages, offering outcome-based contracts that bundle threat hunting, automation, and cross-client intelligence sharing.
Restraints Impact Analysis*
| Restraint | (~) % Impact on CAGR Forecast | Geographic Relevance | Impact Timeline |
|---|---|---|---|
| High TCO Hindering SME Adoption in LATAM and Africa | -1.3% | LATAM and Africa | Medium term (2-4 years) |
| Shortage of Threat-Hunting Talent in Middle-East Enterprises | -0.8% | Middle East | Long term (≥ 4 years) |
| Data-Residency Laws Limiting Cloud Forensic Telemetry (China, India) | -0.7% | China and India | Medium term (2-4 years) |
| Legacy OT Integration Complexity in Energy and Utilities | -0.6% | Global, concentrated in North America and Europe | Long term (≥ 4 years) |
| Source: Mordor Intelligence | |||
High TCO Hindering SME Adoption in LATAM and Africa
The region suffers more than 1,600 cyberattacks every second, yet only 7 of 32 Latin American nations possess a comprehensive critical-infrastructure plan. SMEs allocate under 5% of their IT spend to security, and advanced persistent threat protection platforms require 24/7 monitoring, expert tuning, and recurring licensing, making ownership costs prohibitive. Added consultancy, skills training, and incident-response retainer fees elevate break-even thresholds beyond the cash-flow of small manufacturers and retailers, stalling uptake despite escalating risk.
Shortage of Threat-Hunting Talent in Middle-East Enterprises
Gulf economies digitalize under Vision 2030 but struggle with analyst scarcity, prompting dependence on foreign services and raising sovereignty concerns. Universities lag in specialized curricula, and professionals migrate to higher-paying Western markets. Consequently, enterprises postpone AI-driven deployments or accept reduced security maturity, suppressing the overall spend curve in the region.
*Our forecasts treat driver/restraint impacts as directional, not additive. The impact forecasts reflect baseline growth, mix effects, and variable interactions.
Segment Analysis
By Offering: Services Dominance Reflects Implementation Complexity
Services represented 55.20% of 2025 revenue, underscoring the deployment and tuning complexity inherent in the Advanced Persistent Threat Protection market. Integration and deployment engagements, commanding 37.6% share, involve calibrating platforms to existing tech stacks, mapping MITRE ATT&CK techniques, and validating zero-trust policies without operational disruption. Support contracts remain sticky because signature updates, ML model retraining, and cloud API integrations are continuous. Vendor roadmaps emphasize outcome-based offerings that guarantee dwell-time reduction metrics, appealing to enterprises seeking predictable risk offsets.
Managed security services are expanding at 12.68% CAGR as buyers shift from staff augmentation to turnkey detection-and-response. 24/7 monitoring, automated orchestration, and shared intelligence lower total cost of ownership for mid-size firms. Consulting assignments address compliance alignment with frameworks like NIST and ISO 27001, while training programs mitigate the human-factor gap. As multi-cloud footprints grow, migration and optimization engagements accelerate, further entrenching the service-heavy revenue mix.


By Solution Type: Endpoint Protection Leads Despite Intelligence Platform Surge
Endpoint protection retained 22.05% revenue share in 2025, driven by remote-work proliferation and IoT sprawl. Modern agents leverage behavioral AI to hunt for advanced tactics, yet still integrate with centralized orchestration hubs that flag credential misuse. Threat intelligence platforms are scaling fastest at 12.2% CAGR because enterprises crave curated, real-time feeds that map to ATT&CK, enrich SIEM alerts, and prioritize response.
SIEM tools evolve into cloud-native data fabrics that ingest petabyte-scale telemetry while analytics engines highlight living-off-the-land activity. Intrusion prevention systems now embed ML detection of zero-day techniques. Sandboxes integrate detonation output with intelligence repositories to shorten malware triage. CSPM modules safeguard misconfiguration drift in multi-cloud estates, and SOAR playbooks automate containment. Forensic analysis suites embed timeline reconstruction and hash correlation to expedite root-cause identification.
By Service Type: Managed Services Accelerate Amid Talent Shortage
Integration and deployment still hold the largest slice at 37.6%, yet managed services are the growth engine given the 2.8-million-person global cyber-talent deficit. Vendors guarantee response service-level-agreements, bundle run-books, and leverage AI-driven analytics to scale analyst coverage. Support agreements remain durable revenue, covering patch cadence, feature activation, and compliance reporting modules. Consulting engagements continue as boards demand strategy alignment with risk appetite and regulatory benchmarks.
Training has shifted from episodic workshops to continuous micro-learning portals that reinforce secure-coding and incident triage skills. Automation inside managed services cuts repetitive tier-1 workloads, freeing scarce experts for threat hunting. Providers specialize by vertical—healthcare IoT, financial services compliance, or industrial OT—positioning as outcome partners rather than pure head-count substitutes.
By Deployment Mode: Cloud Gains Momentum Despite On-Premise Dominance
On-premise deployments held 59.70% revenue in 2025 as data-sovereignty and latency needs prevail. Still, cloud models will record a 12.31% CAGR because shared-responsibility frameworks, near-infinite scalability, and consumption-based pricing appeal to cost-sensitive adopters. Hybrid architectures dominate design conversations, blending local control for regulated workloads with cloud analytics for burst processing and AI enrichment.
Edge compute growth demands distributed policy enforcement across industrial plants and branch offices. Cloud-native security services offer integrated telemetry pipelines, continuous integration/continuous deployment instrumentation, and auto-scaling defenses. Zero-trust principles necessitate identity-centred security, reinforcing cloud adoption as perimeter boundaries dissolve. Vendors embed granular segmentation gateways and policy engines that extend control to containers and serverless instances.
By Enterprise Size: Large Enterprises Dominate While SMEs Accelerate
Large organizations accounted for 67.70% of 2025 revenue, reflecting budget depth, heightened compliance exposure, and advanced adversary targeting. They favor platform consolidation to collapse endpoint, cloud, and identity security into a single agent and console, thus lowering operational burden. Meanwhile, SMEs are projected to grow at 10.39% CAGR, aided by SaaS-delivered detection-and-response and pay-as-you-use licensing.
SMEs prioritize ease of deployment and require solutions that auto-configure baselines without deep in-house expertise. AI-guided investigation assists limited staff, while subscription models align expense with cash flow. Regulatory pressure under GDPR and sector-specific mandates compels SMEs to raise protection levels comparable to larger peers, shrinking the adoption gap.
By Vertical: BFSI Leads While Retail & E-Commerce Surges
The BFSI segment contributed 25.15% revenue in 2025 because financial infrastructure remains a prime ransomware target and faces strict supervisory scrutiny. Institutions invest in advanced analytics to protect real-time payments and open-banking APIs. Retail & e-commerce, scaling at 10.86% CAGR, must secure omnichannel platforms and supply-chain nodes that house customer-payment data and third-party scripts.
Healthcare and life sciences adoption rate rises with FDA directives and IoT infusion into clinical workflows. Government and defence remain stalwarts due to nation-state threat pressure. IT and telecom operators juggle dual lifecycles of protecting customer traffic and their own networks under NIS2 oversight. Energy, utilities, and manufacturing focus on converged IT-OT visibility to thwart sabotage of industrial control systems.
Geography Analysis
North America captured 31.95% revenue in 2025, benefiting from mature procurement cycles, active threat intelligence communities, and prescriptive frameworks such as the NSA’s Zero-Trust guidelines. Enterprises emphasize AI-powered analytics, automated containment, and cloud interoperability, boosting platform-consolidation deals. Federal and sectoral mandates sustain spending across energy, finance, and healthcare.
Europe’s growth is anchored in NIS2 adoption, data-sovereignty prioritization, and investment acceleration in telecom and critical infrastructure. Technical implementation guidance published in June 2025 provides a clear roadmap, triggering procurement of segmentation gateways and continuous-monitoring platforms.
Asia Pacific is forecast to advance at 12.18% CAGR, propelled by widespread cloud migration, regulatory tightness, and cyber-insurance uptake. National programs in China, India, and ASEAN states mandate disclosure and incident-response readiness, catalyzing vendor expansion. Latin America endures heavy attack volume yet budget constraints slow uptake; local integrators partner with global vendors to offer cost-optimized bundles. Middle East and Africa steadily allocate funds to protect oil-and-gas infrastructure and government services, though analyst scarcity caps implementation velocity

Competitive Landscape
The Advanced Persistent Threat Protection market is moderately fragmented, with leaders leveraging cloud-native design and unified agent architectures to merge endpoint, identity, and cloud telemetry. Platform consolidation removes swivel-chair overhead and raises detection fidelity through cross-surface correlation. Established vendors extend portfolios organically and through tuck-in acquisitions that fortify supply chain and IoT modules.
CrowdStrike’s AI-native Falcon platform exemplifies a single-agent strategy and posted USD 3.86 billion annual recurring revenue in FY 2024, up 32% year over year. Palo Alto Networks, Fortinet, and Microsoft integrate SOAR and cloud-security posture tooling to retain wallet share. Cloud hyperscalers embed threat-protection controls within infrastructure-as-a-service, altering competitive dynamics as buyers assess native versus best-of-breed. Emerging specialists focus on AI-driven correlation, OT defense, or verticalized regulatory content.
Strategic alliances between security vendors and telecom carriers broaden the go-to-market for 5G-edge security suites. Vendors differentiate via low-latency sensor networks, access to curated MITRE techniques, and transparent AI explainability modules that satisfy auditors. Competitive intensity is further shaped by subscription pricing, bundled training, and outcome-based service guarantees.
Advanced Persistent Threat Protection Industry Leaders
Palo Alto Networks Inc.
Broadcom Inc. (Symantec Enterprise)
Fortinet Inc.
Microsoft Corp.
CrowdStrike Holdings Inc.
- *Disclaimer: Major Players sorted in no particular order

Recent Industry Developments
- June 2025: The FDA finalized guidance mandating cybersecurity management plans for all connected medical devices, escalating hospital investment needs.
- June 2025: ENISA issued technical implementation guidance to operationalize NIS2 controls across 18 critical sectors.
- April 2025: The Toppan Next Tech ransomware attack breached financial data at DBS Bank and others, prompting tighter vendor-risk rules in Singapore.
- March 2025: The FDA released draft AI-and-cybersecurity guidance for medical devices, introducing validation and lifecycle-risk standards.


Global Advanced Persistent Threat Protection Market Report Scope
Advanced persistent threat (APT) protection serves as a robust defense for networks, shielding them from sophisticated and relentless cyberattacks. Tailored to counteract these advanced threats, this solution fortifies computer systems and networks alike. The research also examines underlying growth influencers and significant industry vendors, all of which help to support market estimates and growth rates throughout the anticipated period. The market estimates and projections are based on the base year factors and arrived at top-down and bottom-up approaches.
Advanced Persistent Threat Protection Market is segmented by offering (Solutions and Services), by solutions (Security Information and Event Management, Endpoint Protection, Intrusion Detection System, Sandboxing, Forensic Analysis and Other Solutions), by services (Integration and Deployment, Support and Maintenance, and Consulting), by vertical (BFSI, Construction and Engineering, Healthcare, Retail & E-Commerce, Media & Entertainment, Telecom and Other Verticals) and by geography (North America, Europe, Asia Pacific, South America and Middle East & Africa). The market sizing and forecasts are provided in terms of value (USD) for all the above segments.
| Solutions |
| Services |
| Endpoint Protection |
| Security Information and Event Management (SIEM) |
| Intrusion Detection and Prevention System (IDPS) |
| Sandboxing |
| Forensic Analysis |
| Threat Intelligence Platform |
| Security Orchestration, Automation and Response (SOAR) |
| Cloud Security Posture Management (CSPM) |
| Integration and Deployment |
| Support and Maintenance |
| Consulting |
| Managed Security Services |
| Training and Education |
| On-Premise |
| Cloud |
| Hybrid |
| Small and Medium Enterprises (SMEs) |
| Large Enterprises |
| BFSI |
| Government and Defense |
| Healthcare and Life Sciences |
| IT and Telecom |
| Retail and E-Commerce |
| Energy and Utilities |
| Manufacturing |
| Media and Entertainment |
| Construction and Engineering |
| North America | United States | |
| Canada | ||
| Mexico | ||
| South America | Brazil | |
| Argentina | ||
| Rest of South America | ||
| Europe | United Kingdom | |
| Germany | ||
| France | ||
| Italy | ||
| Spain | ||
| Rest of Europe | ||
| Asia-Pacific | China | |
| Japan | ||
| India | ||
| South Korea | ||
| ASEAN | ||
| Australia | ||
| New Zealand | ||
| Rest of Asia-Pacific | ||
| Middle East and Africa | Middle East | GCC |
| Turkey | ||
| Israel | ||
| Rest of Middle East | ||
| Africa | South Africa | |
| Nigeria | ||
| Egypt | ||
| Rest of Africa | ||
| By Offering | Solutions | ||
| Services | |||
| By Solution Type | Endpoint Protection | ||
| Security Information and Event Management (SIEM) | |||
| Intrusion Detection and Prevention System (IDPS) | |||
| Sandboxing | |||
| Forensic Analysis | |||
| Threat Intelligence Platform | |||
| Security Orchestration, Automation and Response (SOAR) | |||
| Cloud Security Posture Management (CSPM) | |||
| By Service Type | Integration and Deployment | ||
| Support and Maintenance | |||
| Consulting | |||
| Managed Security Services | |||
| Training and Education | |||
| By Deployment Mode | On-Premise | ||
| Cloud | |||
| Hybrid | |||
| By Enterprise Size | Small and Medium Enterprises (SMEs) | ||
| Large Enterprises | |||
| By Vertical | BFSI | ||
| Government and Defense | |||
| Healthcare and Life Sciences | |||
| IT and Telecom | |||
| Retail and E-Commerce | |||
| Energy and Utilities | |||
| Manufacturing | |||
| Media and Entertainment | |||
| Construction and Engineering | |||
| By Geography | North America | United States | |
| Canada | |||
| Mexico | |||
| South America | Brazil | ||
| Argentina | |||
| Rest of South America | |||
| Europe | United Kingdom | ||
| Germany | |||
| France | |||
| Italy | |||
| Spain | |||
| Rest of Europe | |||
| Asia-Pacific | China | ||
| Japan | |||
| India | |||
| South Korea | |||
| ASEAN | |||
| Australia | |||
| New Zealand | |||
| Rest of Asia-Pacific | |||
| Middle East and Africa | Middle East | GCC | |
| Turkey | |||
| Israel | |||
| Rest of Middle East | |||
| Africa | South Africa | ||
| Nigeria | |||
| Egypt | |||
| Rest of Africa | |||


Key Questions Answered in the Report
What is the projected value of the Advanced Persistent Threat Protection market by 2031?
The market is forecast to reach USD 10.84 billion by 2031, implying a 10.12% CAGR.
Which segment holds the largest share within the Advanced Persistent Threat Protection market?
Services dominate with 55.20% of 2025 revenue, led by integration and deployment engagements.
Why is Asia Pacific the fastest-growing region?
Rapid cloud adoption, strict national regulations, and cyber-insurance uptake drive the region’s 12.18% CAGR.
How do NIS2 regulations influence European investment?
Telecom and critical-sector operators must implement ten mandated controls, spurring immediate spending to avoid fines of up to EUR 10 million (USD 10.9 million).
Page last updated on:


