Threat Hunting Market Size and Share
Market Overview
| Study Period | 2019 - 2030 |
|---|---|
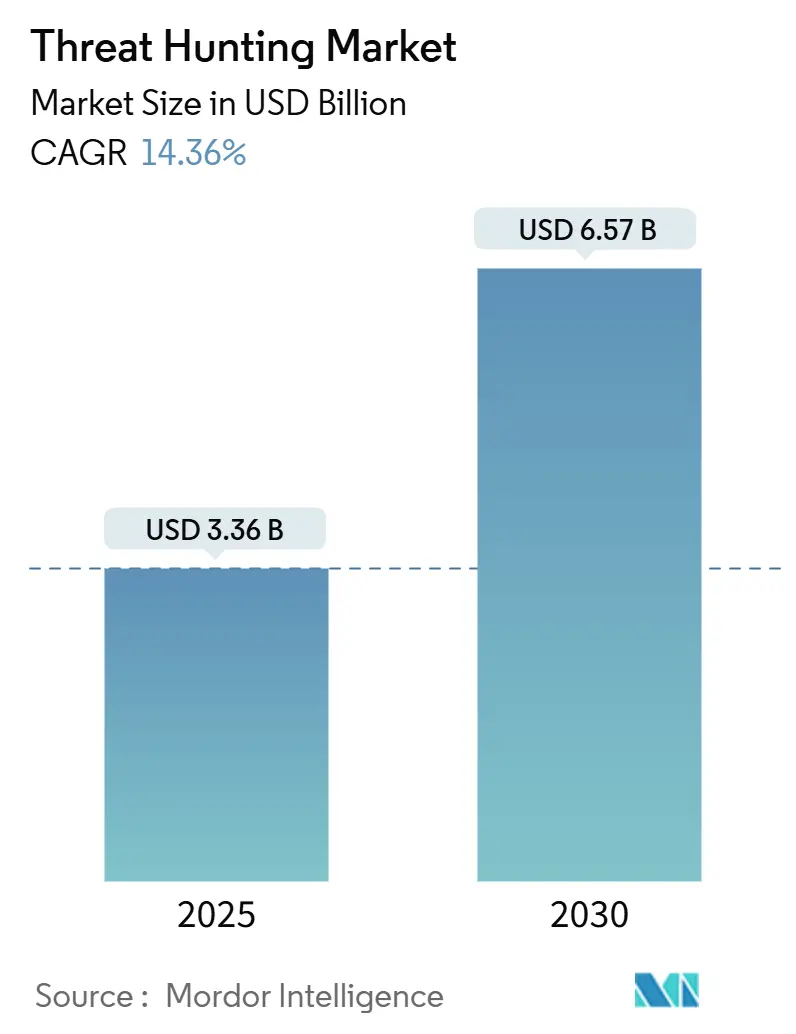
| Market Size (2025) | USD 3.36 Billion |
| Market Size (2030) | USD 6.57 Billion |
| Growth Rate (2025 - 2030) | 14.36% CAGR |
| Fastest Growing Market | Asia Pacific |
| Largest Market | North America |
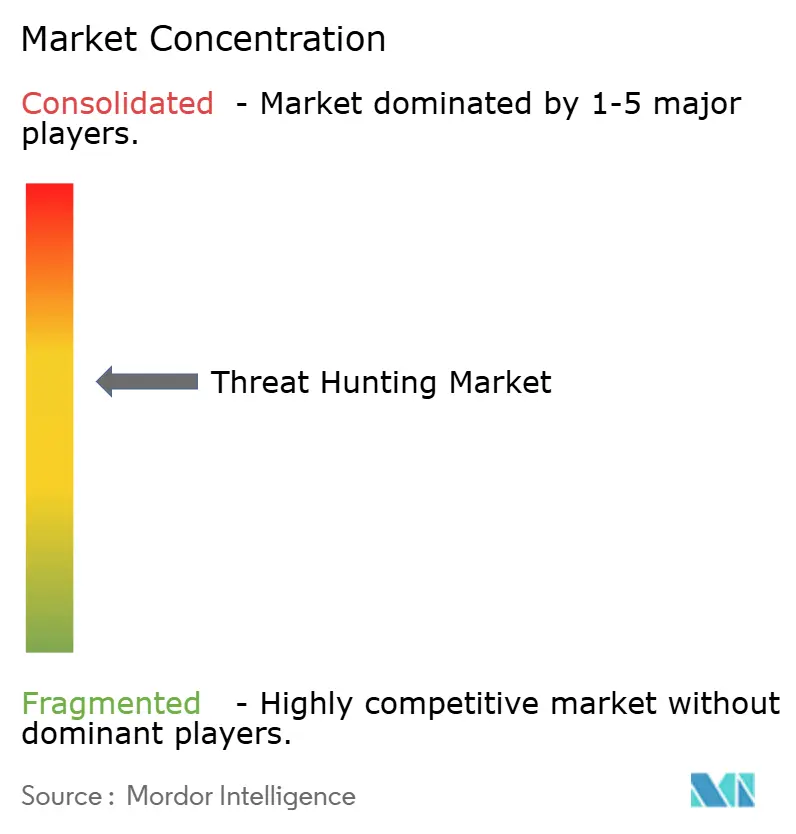
| Market Concentration | Medium |
Major Players *Disclaimer: Major Players sorted in no particular order Image © Mordor Intelligence. Reuse requires attribution under CC BY 4.0. | |
Threat Hunting Market Analysis by Mordor Intelligence
The threat hunting market size stood at USD 3.36 billion in 2025 and is forecast to climb to USD 6.57 billion by 2030, advancing at a 14.36% CAGR during the period . Enterprises are reallocating budgets from reactive defenses toward proactive threat discovery as generative-AI-enabled adversaries, expanding cloud attack surfaces, and stringent regulations heighten risk exposure. Financial entities face new rules such as the EU Digital Operational Resilience Act, motivating higher spending on continuous monitoring and incident response. At the same time, large-scale supply-chain attacks and polymorphic malware are eroding confidence in signature-based detection, encouraging adoption of AI-driven analytics. Vendor strategies now revolve around unifying SIEM and XDR in single platforms to curtail tool sprawl, while managed detection providers fill workforce gaps by offering turnkey hunting expertise. Mergers such as Cisco–Splunk and Palo Alto Networks–QRadar indicate a race to control the next-generation security operations stack.
Key Report Takeaways
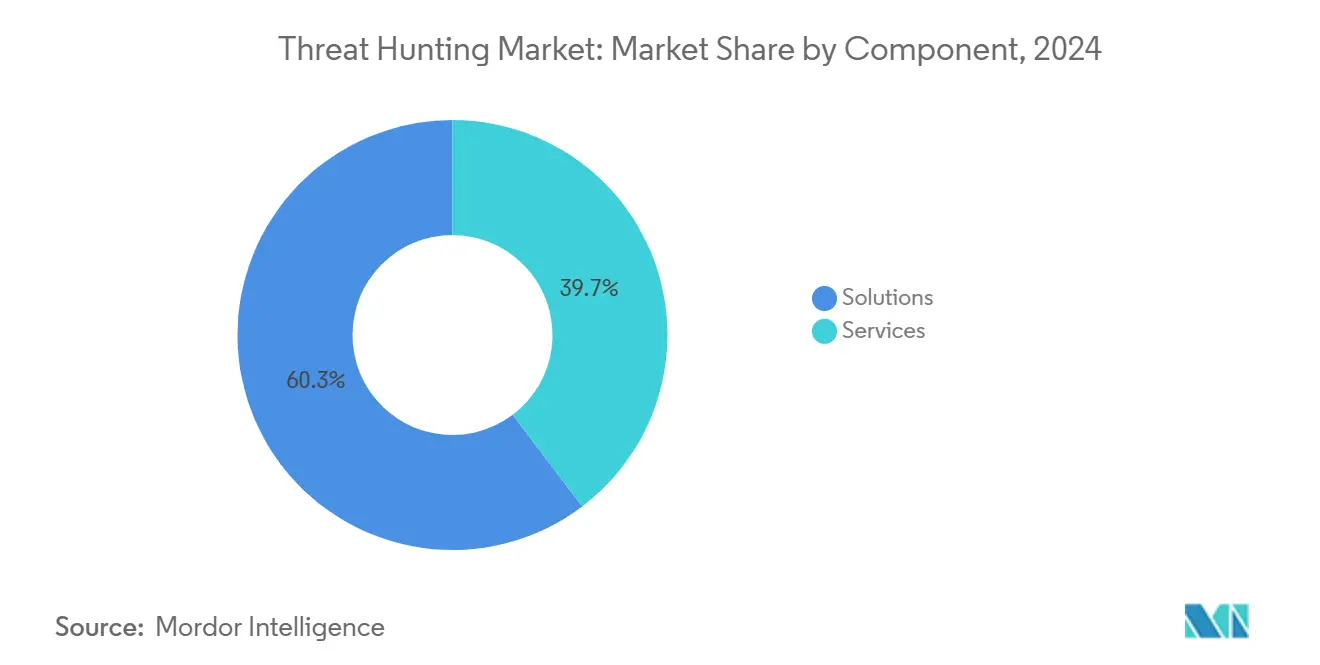
- By component, solutions held 60.3% of the threat hunting market share in 2024, whereas services are projected to expand at a 15.5% CAGR through 2030.
- By deployment mode, cloud accounted for 54.5% of the threat hunting market size in 2024 and is forecast to grow at a 15.8% CAGR by 2030.
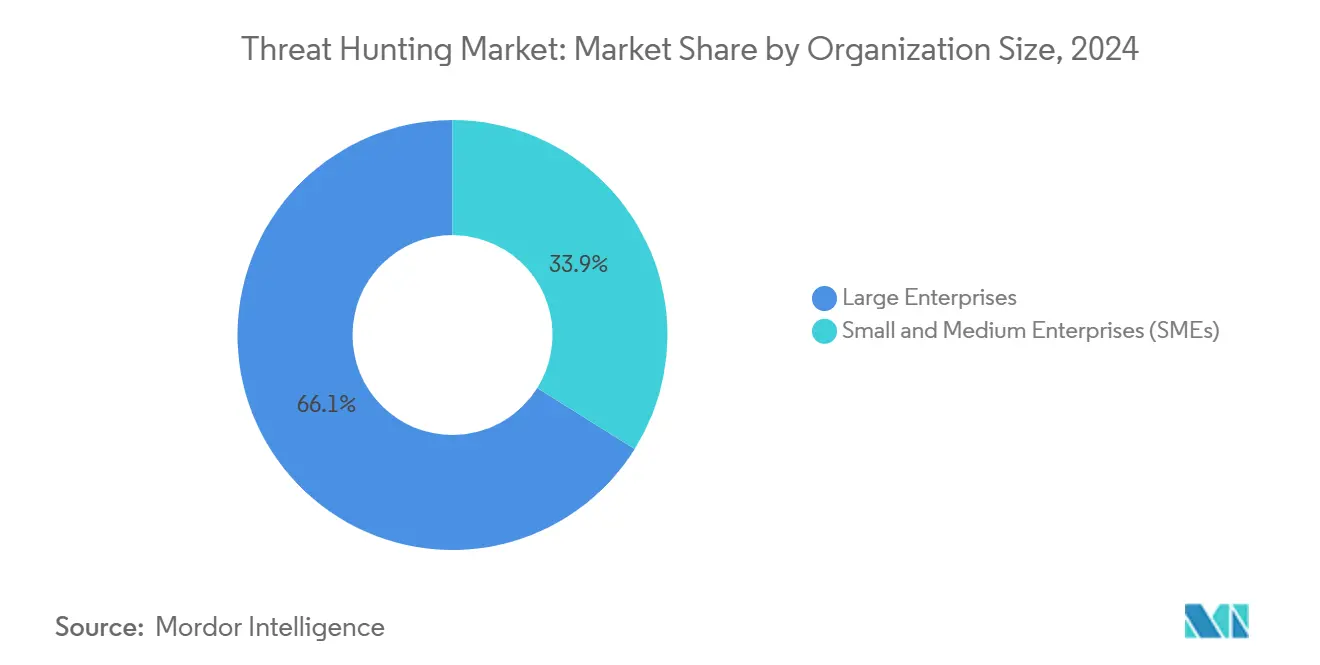
- By organization size, large enterprises captured 66.1% of the threat hunting market size in 2024, while SMEs are advancing at a 16.2% CAGR through 2030.
- By industry vertical, BFSI led with 29.8% threat hunting market share in 2024 and is growing at a 15.3% CAGR to 2030.
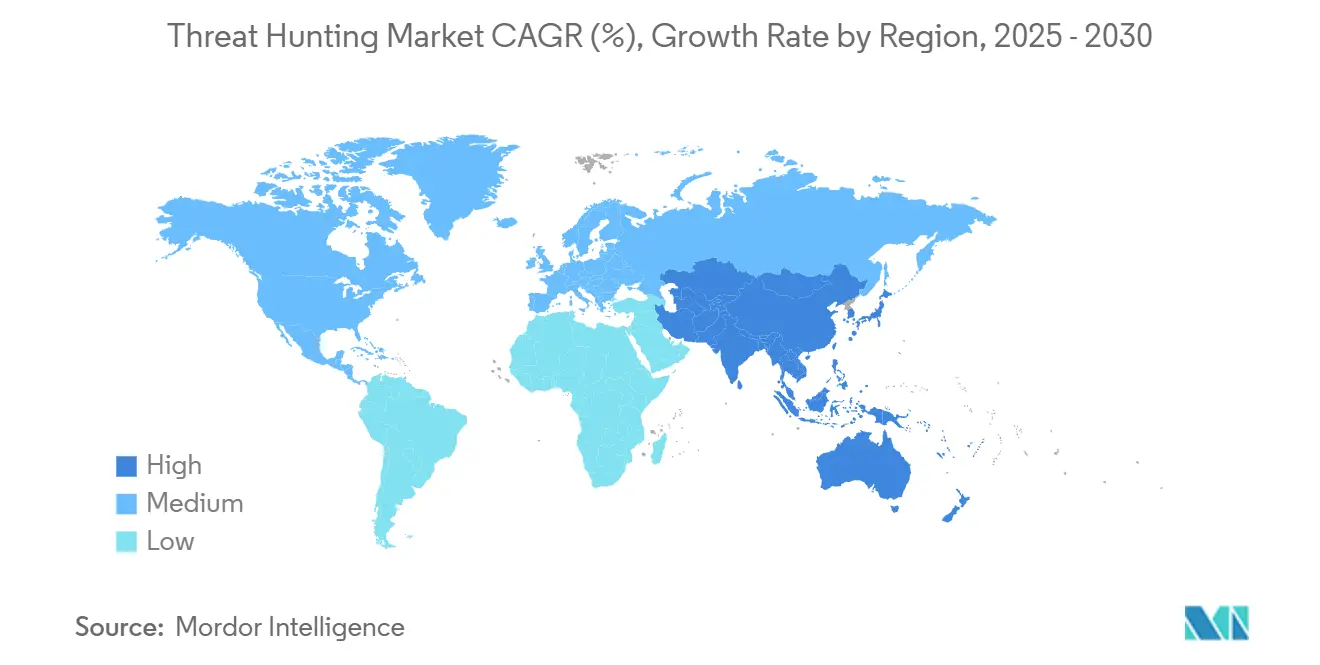
- By geography, North America held a 44.4% share in 2024; Asia-Pacific records the fastest regional CAGR at 15.9% through 2030.
Global Threat Hunting Market Trends and Insights
Drivers Impact Analysis*
| Driver | (~) % Impact on CAGR Forecast | Geographic Relevance | Impact Timeline |
|---|---|---|---|
| AI-assisted triage cuts mean-time-to-detect | +3.2% | Global, early adoption in North America and EU | Short term (≤ 2 years) |
| XDR stack consolidation enables hunt telemetry | +2.8% | North America and EU core, expanding to Asia-Pacific | Medium term (2-4 years) |
| Cloud workload attacks surge post-GenAI reuse | +2.1% | Global, pronounced in cloud-native regions | Short term (≤ 2 years) |
| Mandatory cyber-resilience rules elevate spend | +1.9% | EU and North America, spillover to Asia-Pacific financial hubs | Medium term (2-4 years) |
| MDR upsell bundles add proactive hunt | +1.7% | Global, strongest in talent-scarce markets | Long term (≥ 4 years) |
| National cyber-range data-sharing programs | +1.4% | US, EU and Singapore government initiatives | Long term (≥ 4 years) |
| Source: Mordor Intelligence | |||
AI-Assisted Triage Cuts Mean-Time-to-Detect
Security operations centers integrating generative-AI triage halve detection time while trimming compute cost by 50%, transforming incident-response economics. CrowdStrike’s Charlotte AI processes an average of 4,484 daily alerts automatically, letting analysts focus on deep investigations. The benefit is amplified by a 4.8-million-person workforce gap that leaves 28% of SOC roles unfilled.[1]ISC2, “Cybersecurity Workforce Growth Stalls,” isc2.org AI agents maintain contextual memory across events and adapt to new tactics, yet 74% of professionals still view the landscape as the toughest in five years, underscoring the need for human oversight.
XDR Stack Consolidation Opens API-Level Hunt Telemetry
Unified security operations platforms now deliver over 99% correlation accuracy and recapture 7.2 million analyst hours annually by harmonizing data flows from endpoints, networks, and identities.[2]Microsoft, “Cybersecurity Incident Correlation in the Unified Security Operations Platform,” techcommunity.microsoft.com Open APIs let hunters execute queries against 100,000-row event sets in near-real time, replacing manual data stitching that once obscured multi-vector attacks. Platform unification also automates response, allowing XDR to coordinate containment actions across controls simultaneously. Procurement teams increasingly rank telemetry breadth above point-feature depth, tilting competitive advantage toward vendors with mature integration ecosystems.
Surge in Cloud Workload Attacks Post-GenAI Code Reuse
Cloud intrusions jumped 75% after developers began embedding AI-generated code that often carries latent vulnerabilities. Attackers exploit these flaws with polymorphic malware and machine-crafted phishing, while “Shadow AI” projects increase blind spots. Only 38% of firms have mitigation strategies for AI-development risks. Cloud-native security tools must therefore add AI-specific runtime protection to identify model manipulation and weaponized prompts.
Mandatory Cyber-Resilience Rules Elevate Hunt Budgets
The EU’s DORA requires threat-led penetration tests every three years, pushing financial entities to build real-time detection and continuous monitoring. Non-compliance can cost up 2% of turnover, compelling 89% of organizations to expand cybersecurity headcount. Similar SEC disclosure rules in the US drive parallel investments, creating a sustained uplift in budgets earmarked for threat-hunting platforms and skilled analysts.
Restraints Impact Analysis*
| Restraint | (~) % Impact on CAGR Forecast | Geographic Relevance | Impact Timeline |
|---|---|---|---|
| Scarcity of threat-hunt talent | −2.1% | Global, acute in North America and EU | Long term (≥ 4 years) |
| Alert fatigue from noisy telemetry | −1.8% | Global, especially in tool-heavy environments | Medium term (2-4 years) |
| Escalating SOC operating costs | −1.2% | Global | Medium term (2-4 years) |
| Data-sovereignty barriers to telemetry flow | −1.0% | Europe and select Asia-Pacific jurisdictions | Long term (≥ 4 years) |
| Source: Mordor Intelligence | |||
Scarcity of Threat-Hunt Talent Inflates SOC Costs
Sophisticated hunting requires rare skills that blend network forensics and adversary-behavior analytics; 28% of roles remain vacant, and understaffed teams face breach costs of USD 4.56 million versus their peers. Although AI automates triage, demand for mid-career hunters outpaces supply, forcing premium pay packages and reliance on managed services.
Alert-Fatigue from Noisy Telemetry Lowers Hunt ROI
SOC analysts triage thousands of alerts daily, leading to burnout and missed incidents. High false-positive rates degrade machine-learning models, creating a feedback loop of noise. Skills gaps further compound the issue as 60% of professionals say staffing shortages weaken defenses. Organizations now demand solutions that enrich and de-duplicate telemetry before it reaches human analysts.
*Our forecasts treat driver/restraint impacts as directional, not additive. The impact forecasts reflect baseline growth, mix effects, and variable interactions.
Segment Analysis
By Component: Services Accelerate Despite Solutions Dominance
Solutions represented 60.3% of the threat hunting market in 2024 as firms invested in detection engines and analytics consoles that form the operational backbone. Yet the services segment is moving faster, registering a 15.5% CAGR because enterprises struggle to recruit specialists. Managed Detection and Response providers bundle proactive hunting with traditional monitoring, letting customers outsource expertise while retaining control over response playbooks. Vendors have expanded partner enablement, evidenced by more than 1,000 certified consultants for a single platform, showing the hybrid trajectory of technology plus services. Regulation amplifies demand, since external auditors increasingly accept third-party attestations of hunt capabilities. As services mature, differentiation shifts from staffing volume to contextual threat intelligence tailored to a client’s vertical.
With skills scarce, enterprises view external expertise as risk insurance, and consumption models are becoming outcome-based rather than effort-based. Platform makers now embed professional services in subscription tiers, merging software updates and hunt playbooks into a single contract. The threat hunting market, therefore, blurs the line between product and service, generating integrated offerings that address technology, process, and people requirements in one package.


By Deployment Mode: Cloud Dominance Reflects XDR Evolution
Cloud implementations delivered 54.5% of 2024 revenue and are projected to post a 15.8% CAGR, underscoring the gravitational pull of telemetry centralization. Consolidating logs in elastic data lakes allows high-speed search across endpoints, networks, and identities without on-premises hardware. Providers release new analytics weekly, keeping defenses current without customer upgrading cycles. On-premises deployments remain necessary for data sovereignty or air-gapped environments, yet their growth lags because of CapEx burdens and limited analytic breadth. Hybrid visibility has become a baseline requirement, forcing legacy appliance vendors to refactor offerings into cloud-managed form factors.
Cloud architectures underpin autonomous SOC concepts that shift daily correlation to machine agents, liberating humans for threat hunting. Pay-as-you-go compute also lowers entry barriers for SMEs, aligning cost with actual investigation workloads. As GenAI models scale, cloud factors heavily in providing the GPU clusters needed for real-time inference on multiyear telemetry archives. Consequently, deployment choice increasingly correlates with analytic richness and time-to-detect.
By Organization Size: SMEs Drive Growth Through Democratization
Large enterprises still account for 66.1% of revenue because they run complex hybrid estates and hold higher breach-cost exposure. Nonetheless, SMEs exhibit the fastest trajectory, growing 16.2% annually as managed platforms package expertise into affordable subscriptions. Cloud-native consoles with intuitive query builders let limited-staff IT teams execute hunts that once required certified analysts. Regulation also sweeps smaller firms into the compliance scope; the EU’s NIS2 now covers companies with 50+ employees and EUR 10 million (USD 11.7 million) revenue.[3]European Union, “Cybersecurity of Network and Information Systems,” eur-lex.europa.eu Consequently, board-level risk committees in mid-market firms approve budgets for proactive detection, viewing it as an enabler of customer trust.
Service providers tailor bundles that combine endpoint agents, network sensors, and 24×7 analyst coverage, marketed as “virtual SOC.” Flexible monthly billing matches cash-flow constraints typical of mid-market enterprises. This democratization propels a broader install base and compounds telemetry volume, which in turn improves machine-learning models for all customers through federated learning.
By Industry Vertical: BFSI Leadership Reflects Regulatory Pressure
The BFSI arena commanded 29.8% revenue in 2024 because financial services remain prime targets for credential theft and payment-system disruption. Average breach costs touched USD 4.88 million, justifying sustained investment in behavioral analytics and continuous hunting. Regulatory mandates prescribe near-real-time incident reporting, elevating proactive discovery from best practice to legal obligation. IT and Telecom follow closely as backbone infrastructure faces state-sponsored intrusions, while Healthcare accelerates due to medical-device vulnerabilities and data-privacy penalties. Government and Defense remain steady adopters, focusing on nation-state tradecraft and cross-agency data sharing. Manufacturing adoption rises after ransomware actors shifted to industrial control systems, affecting 68% of industrial ransomware incidents in Q1 2025.[4]Manufacturing.net, “Wave of Ransomware Targeting Manufacturing,” manufacturing.net
Sector-specific threat intelligence has become a differentiator, with vendors curating playbooks for payment fraud, operational technology sabotage, or patient data exfiltration. This vertical nuance increases switching costs and encourages long-term contracts, reinforcing revenue visibility for suppliers.
Geography Analysis
North America held 44.4% of 2024 revenue owing to high cyber-insurance premiums, mature compliance regimes, and early adoption of AI-assisted detection. Spending concentrates in financial hubs and federal agencies that pioneered threat hunting playbooks after large-scale supply-chain breaches. Vendor presence remains dense, fostering rapid customer proof-of-concept cycles and cross-platform integrations.
Europe ranks second, propelled by NIS2 and DORA, which standardize resilience baselines across the single market. The EU Cyber Solidarity Act further channels investment into cross-border alerting systems, stimulating demand for platforms capable of multi-tenant data segmentation.[5]ISC2, “EU Cyber Solidarity Act – What You Need to Know,” isc2.org Data-sovereignty laws nevertheless compel regional cloud outposts and encryption-at-rest features.
Asia-Pacific exhibits the fastest expansion at 15.9% CAGR, reflecting rapid digitalization in ASEAN economies and rising regulatory vigilance in India, Japan, and Australia. Investments focus on cloud-first deployments and managed services that sidestep talent scarcities. South America and the Middle East, and Africa represent emerging opportunities as governments modernize e-government services and critical-infrastructure defenses. Across all regions, public-private threat-intelligence exchanges catalyze platform adoption by aligning tooling with national cybersecurity doctrines.

Competitive Landscape
Consolidation is reshaping competitive contours as platform unification trumps point detection. Cisco’s USD 28 billion acquisition of Splunk, Palo Alto Networks’ USD 500 million QRadar deal, and Darktrace’s cloud-forensics pickup illustrate the premium placed on telemetry breadth. Buyers view integrated SIEM-plus-XDR suites as antidotes to alert fatigue by correlating signals in one data fabric. This favors firms with deep R&D budgets capable of fusing network, endpoint, and identity analytics under a single UI.
Mid-tier challengers’ position around AI-native architectures: SentinelOne markets an autonomous SOC that reduces human touchpoints; Lacework’s cloud-graph technology attracted acquisition interest for enabling high-fidelity anomaly detection. Co-innovation partnerships also proliferate, such as CrowdStrike and NVIDIA’s agentic-AI collaboration aimed at accelerating inference on security workloads.
Barriers to entry concentrate on data-science talent, curated telemetry, and marketplace ecosystems that lock partners into revenue-sharing models. Yet white-space exists for verticalized content packs and privacy-preserving analytics that align with differential-privacy statutes. Ultimately, competitive advantage is due to vendors demonstrating measurable reductions in mean-time-to-respond while lowering total cost of ownership.
Threat Hunting Industry Leaders
IBM Corporation
Cisco Systems, Inc.
Google LLC
CrowdStrike Holdings, Inc.
Palo Alto Networks, Inc.
- *Disclaimer: Major Players sorted in no particular order

Recent Industry Developments
- June 2025: CrowdStrike and Microsoft announced collaboration to harmonize cyber-threat attribution by mapping adversary aliases across vendors.
- March 2025: CrowdStrike partnered with NVIDIA to advance agentic AI in cybersecurity, boosting Charlotte AI triage speed while halving compute draw.
- January 2025: Darktrace acquired Cado Security to deepen AI-driven analytics and cloud forensics capabilities in multi-cloud environments.
- January 2025: The EU Cyber Solidarity Act took effect, establishing a European Cybersecurity Alert System and Emergency Mechanism.


Global Threat Hunting Market Report Scope
| Solutions |
| Services |
| On-premises |
| Cloud |
| Large Enterprises |
| Small and Medium Enterprises (SMEs) |
| Banking, Financial Services and Insurance (BFSI) |
| IT and Telecom |
| Healthcare and Life-Sciences |
| Government and Defence |
| Manufacturing |
| North America | United States | |
| Canada | ||
| Mexico | ||
| South America | Brazil | |
| Argentina | ||
| Rest of South America | ||
| Europe | Germany | |
| United Kingdom | ||
| France | ||
| Italy | ||
| Spain | ||
| Russia | ||
| Rest of Europe | ||
| Asia-Pacific | China | |
| Japan | ||
| India | ||
| South Korea | ||
| Rest of Asia-Pacific | ||
| Middle East and Africa | Middle East | Saudi Arabia |
| United Arab Emirates | ||
| Turkey | ||
| Rest of Middle East | ||
| Africa | South Africa | |
| Nigeria | ||
| Egypt | ||
| Rest of Africa | ||
| By Component | Solutions | ||
| Services | |||
| By Deployment Mode | On-premises | ||
| Cloud | |||
| By Organisation Size | Large Enterprises | ||
| Small and Medium Enterprises (SMEs) | |||
| By Industry Vertical | Banking, Financial Services and Insurance (BFSI) | ||
| IT and Telecom | |||
| Healthcare and Life-Sciences | |||
| Government and Defence | |||
| Manufacturing | |||
| By Geography | North America | United States | |
| Canada | |||
| Mexico | |||
| South America | Brazil | ||
| Argentina | |||
| Rest of South America | |||
| Europe | Germany | ||
| United Kingdom | |||
| France | |||
| Italy | |||
| Spain | |||
| Russia | |||
| Rest of Europe | |||
| Asia-Pacific | China | ||
| Japan | |||
| India | |||
| South Korea | |||
| Rest of Asia-Pacific | |||
| Middle East and Africa | Middle East | Saudi Arabia | |
| United Arab Emirates | |||
| Turkey | |||
| Rest of Middle East | |||
| Africa | South Africa | ||
| Nigeria | |||
| Egypt | |||
| Rest of Africa | |||


Key Questions Answered in the Report
What is the current value of the threat hunting market?
The market is valued at USD 3.36 billion in 2025.
How fast is the threat hunting market expected to grow?
It is forecast to register a 14.36% CAGR and reach USD 6.57 billion by 2030.
Which region is expanding the quickest?
Asia-Pacific records the highest regional CAGR at 15.9% through 2030.
Why are services growing faster than solutions?
Enterprises face a 4.8 million-person talent gap, so they increasingly outsource proactive hunting to managed providers.
Page last updated on:


