Risk Aggregation And Exposure Modeling Tools Market Size and Share
Market Overview
| Study Period | 2019 - 2030 |
|---|---|
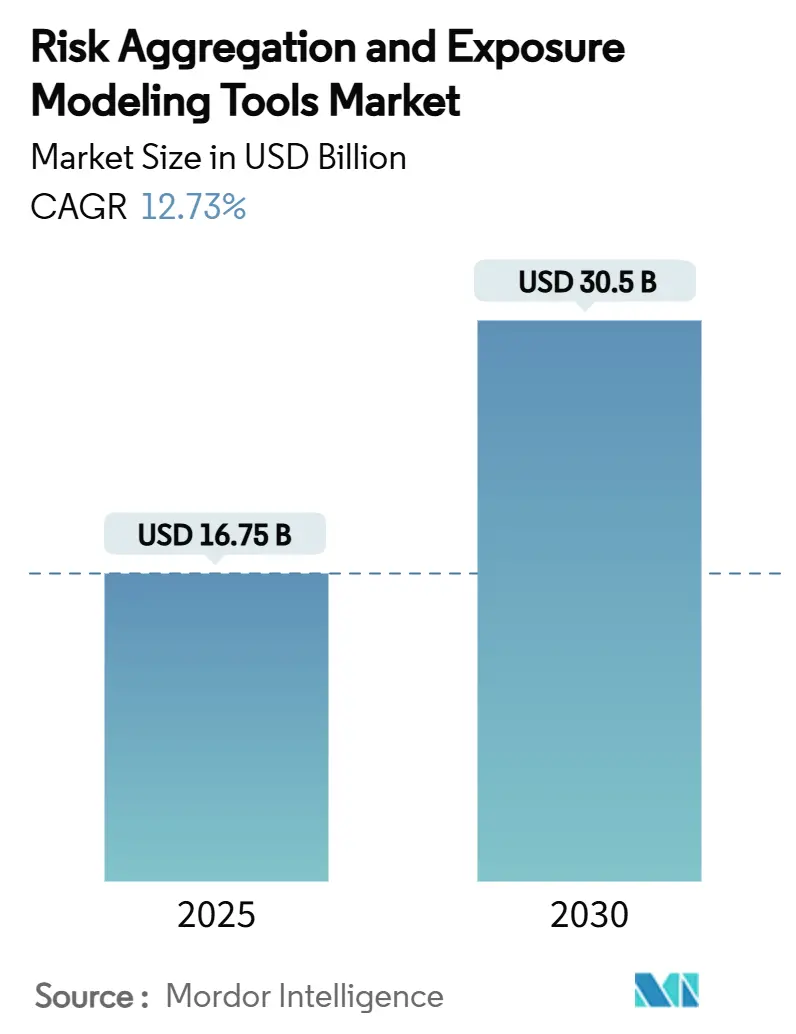
| Market Size (2025) | USD 16.75 Billion |
| Market Size (2030) | USD 30.5 Billion |
| Growth Rate (2025 - 2030) | 12.73% CAGR |
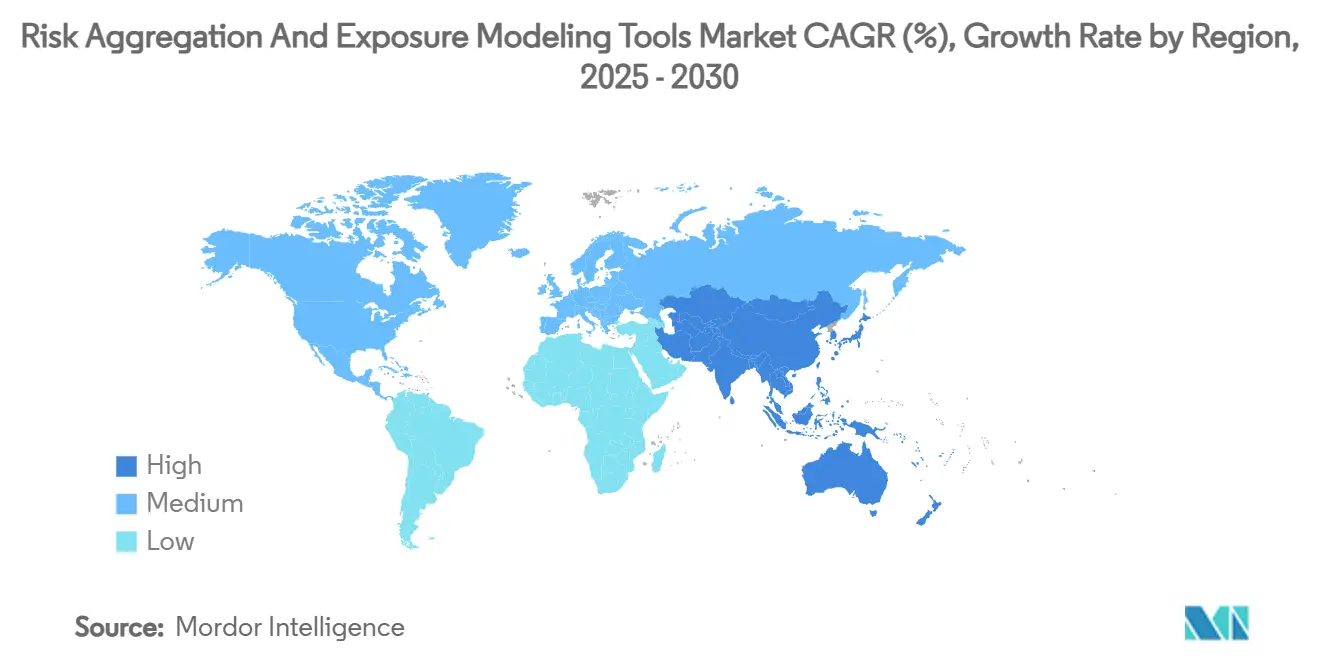
| Fastest Growing Market | Asia Pacific |
| Largest Market | North America |
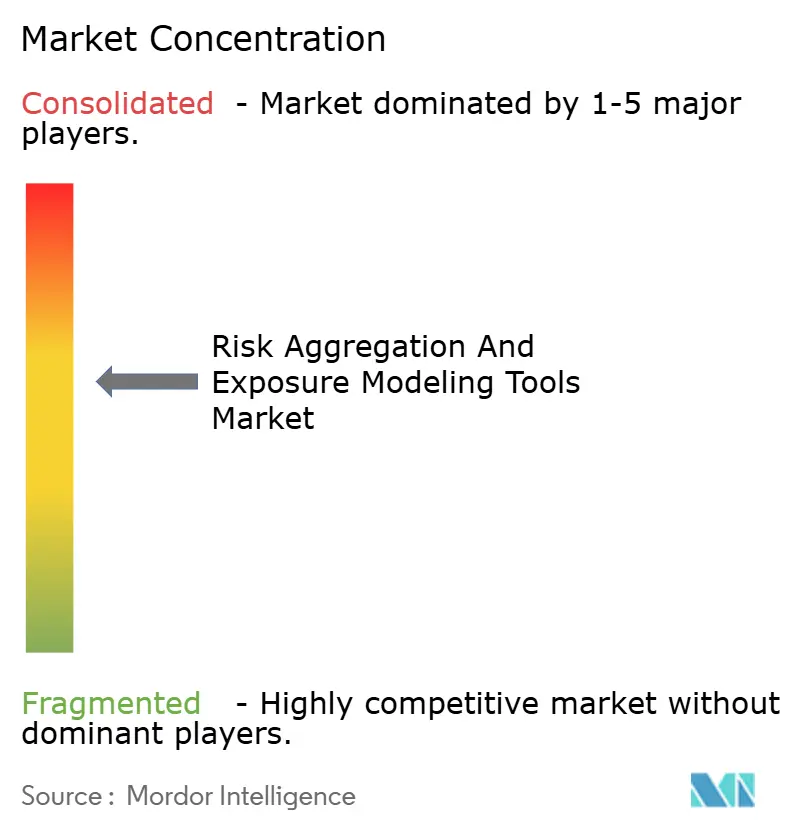
| Market Concentration | Medium |
Major Players *Disclaimer: Major Players sorted in no particular order Image © Mordor Intelligence. Reuse requires attribution under CC BY 4.0. | |
Risk Aggregation And Exposure Modeling Tools Market Analysis by Mordor Intelligence
The risk aggregation and exposure modelling tools market size stands at USD 16.75 billion in 2025 and is forecast to reach USD 30.50 billion by 2030, expanding at a 12.73% CAGR. Heightened regulatory scrutiny, the pivot toward predictive analytics, and the financial fallout from large-scale cyber incidents are prompting enterprises to treat integrated platforms as strategic infrastructure rather than discretionary tools. Cloud-native deployments continue to widen adoption by lowering upfront costs and granting on-demand processing power for complex calculations. North American institutions lead early investment, yet Asia-Pacific banks and corporates are closing the gap by upgrading legacy systems in response to fast-moving local regulations. Vendors that fuse artificial intelligence, real-time data processing, and unified risk taxonomies are capturing a growing share of new contracts as buyers consolidate disparate point solutions into central hubs.
Key Report Takeaways
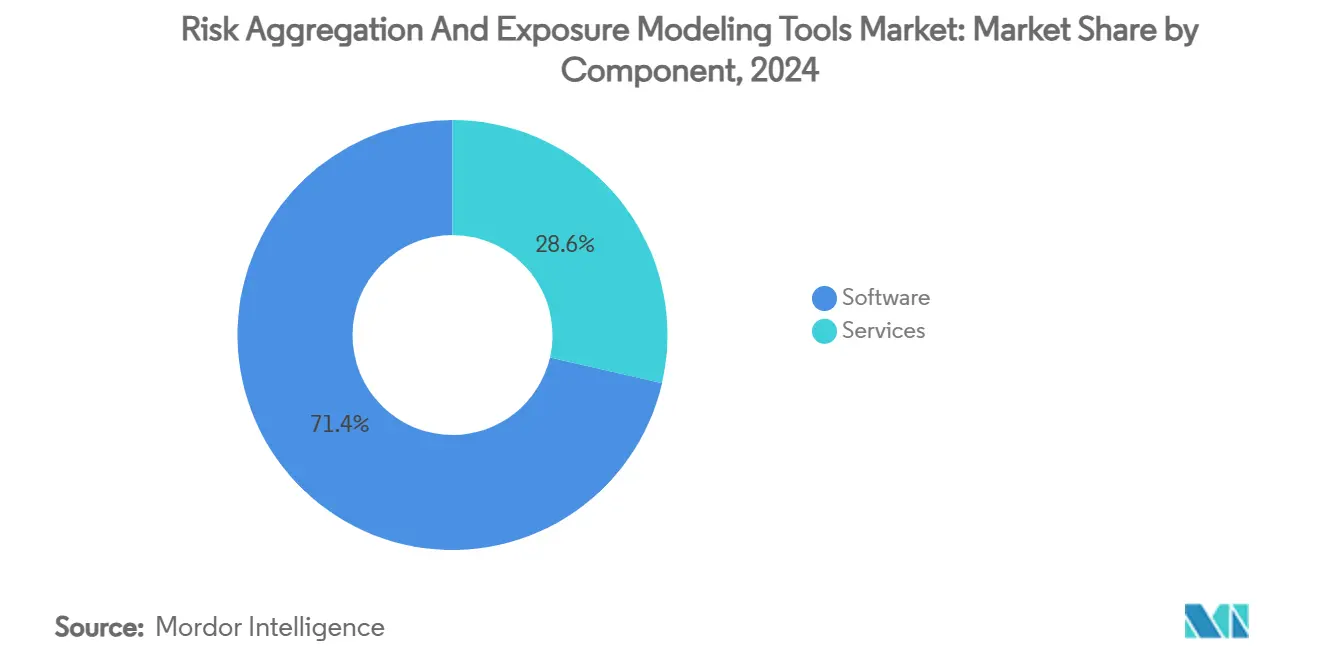
- By component, Software accounted for 71.4% of the risk aggregation and exposure modelling tools market share in 2024, while Services is projected to register a 16.1% CAGR through 2030.
- By deployment mode, Cloud-based offerings commanded 64.3% share of the risk aggregation and exposure modelling tools market size in 2024 and are advancing at a 15.6% CAGR to 2030.
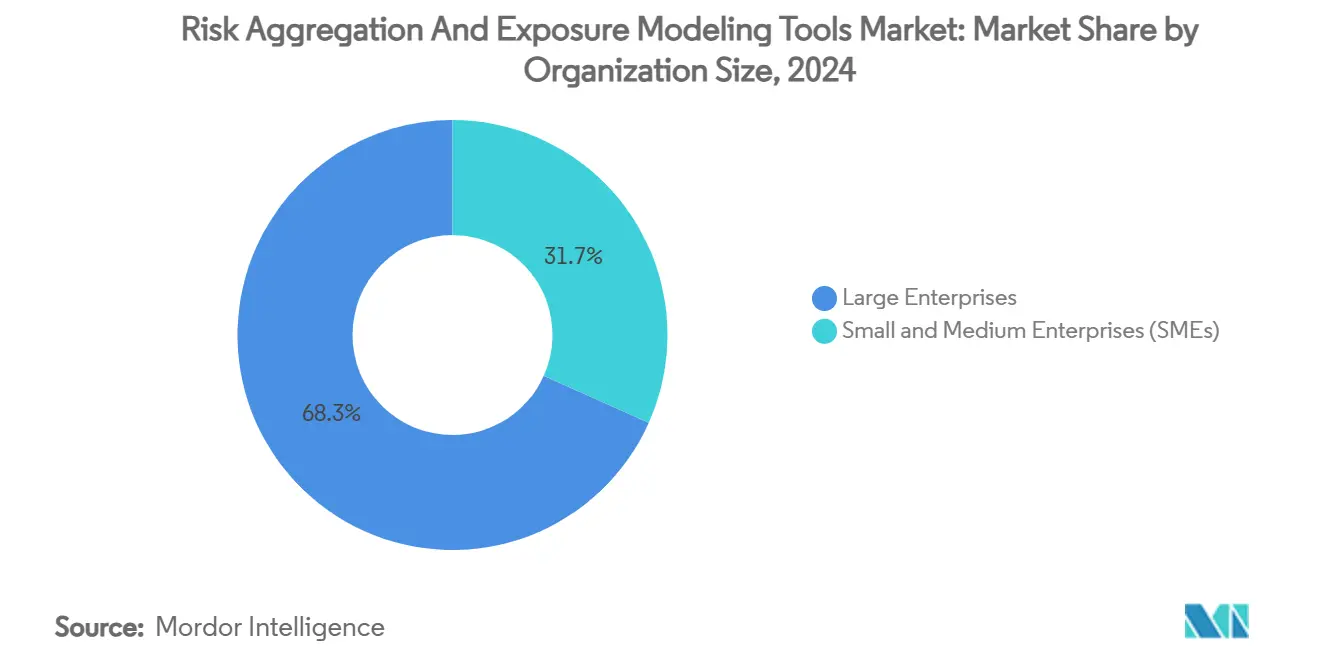
- By organization size, Large Enterprises held 68.3% of 2024 revenue, whereas Small and Medium Enterprises are forecast to expand at a 17.1% CAGR between 2025 and 2030.
- By end-user industry, Banking, Financial Services, and Insurance captured 46.2% revenue share in 2024; Healthcare and Life Sciences are projected to grow at an 18.1% CAGR through 2030.
- By geography, North America led with 41.2% market share in 2024, while Asia-Pacific records the fastest pace at a 16.6% CAGR to 2030.
Global Risk Aggregation And Exposure Modeling Tools Market Trends and Insights
Drivers Impact Analysis*
| Driver | (~) % Impact on CAGR Forecast | Geographic Relevance | Impact Timeline |
|---|---|---|---|
| Regulatory mandates for unified risk data aggregation | +2.8% | Global, with emphasis on North America and the EU | Medium term (2-4 years) |
| Explosion of real-time data and complex portfolios | +2.1% | Global, concentrated in major financial centers | Short term (≤ 2 years) |
| Rapid shift to cloud-native risk engines | +1.9% | Global, led by North America and Asia-Pacific | Short term (≤ 2 years) |
| Escalating cyber and operational risk incidents | +1.7% | Global, particularly North America and the EU | Short term (≤ 2 years) |
| Integration of ESG-climate stress testing | +1.4% | EU and North America core, expanding to the Asia-Pacific | Medium term (2-4 years) |
| IoT-enabled catastrophe exposure modeling | +0.8% | Asia-Pacific and North America, with spillover to MEA | Long term (≥ 4 years) |
| Source: Mordor Intelligence | |||
Regulatory mandates for unified risk data aggregation
Basel III Endgame requirements coming into force from July 2025 oblige United States banks above USD 100 billion in assets to overhaul data lineage and reporting structures. The European Central Bank’s 2024 guidance underlines similar expectations for consistent taxonomies, stable data storage, and audit-ready reconciliation. Supervisors are openly penalizing fragmented architectures, which accelerates enterprise demand for platforms capable of aggregating market, credit, liquidity, and operational metrics under one schema. As a result, the risk aggregation and exposure modelling tools market is witnessing priority spending on metadata governance layers, lineage tracing tools, and rule-based validation engines. Vendors able to supply pre-configured regulatory templates gain a head start in procurement cycles dominated by tight compliance deadlines.
Explosion of real-time data and complex portfolios
The shift from batch to stream processing reduces overnight reconciliation windows from hours to minutes, enabling teams to price emerging exposures before markets move.[1]Confluent, “How the World’s Largest Options Clearinghouse Moved From Batch to Stream Processing to Manage Risk,” current.confluent.io Large sell-side dealers now ingest tick-level data across equities, fixed income, and derivatives into unified engines that calculate value-at-risk on a rolling basis. Institutional investors follow suit as multiproduct mandates blur asset-class boundaries and create sprawling datasets. Continuous monitoring raises expectations for intuitive dashboards that highlight anomalies instantly, pushing the risk aggregation and exposure modelling tools market toward event-driven architectures. Providers that optimize in-memory analytics and horizontal scaling achieve measurable performance gains, translating into competitive wins among latency-sensitive users.
Rapid shift to cloud-native risk engines
Cloud adoption has become the default path for new implementations as subscription pricing aligns costs with business volumes and avoids capital outlays. Treasury and Risk Manager Quantum Cloud Edition exemplifies this trajectory by offering elastic compute capacity for Monte Carlo simulations and stress-testing on demand. Strong encryption, data residency options, and granular access controls help financial institutions satisfy regulatory expectations while harnessing containerized microservices for faster upgrades. These attributes sustain a double-digit growth curve that keeps the risk aggregation and exposure modelling tools market well ahead of broader enterprise software averages. The trend also fosters a service ecosystem where system integrators package migration accelerators, sandbox environments, and managed model validation.
Escalating cyber and operational risk incidents
The July 2024 CrowdStrike outage inflicted over USD 5 billion in direct losses and disrupted 8.5 million endpoints, moving operational resilience to the top of board agendas.[2]Harvard Business Review, “What the 2024 CrowdStrike Glitch Can Teach Us About Cyber Risk,” hbr.org Regulators responded by demanding transparent third-party risk assessments and continuous controls monitoring, spurring wider deployment of integrated platforms that correlate cyber telemetry with financial exposure metrics. Insurers in the Asia-Pacific region increased premium rates, signaling a pricing mechanism that rewards organizations capable of evidencing mature risk frameworks. This climate positions cross-domain solutions that unify technology, operational, and reputational risk data at the center of enterprise roadmaps, boosting the overall velocity of the risk aggregation and exposure modelling tools market.
Restraints Impact Analysis*
| Restraint | (~) % Impact on CAGR Forecast | Geographic Relevance | Impact Timeline |
|---|---|---|---|
| High implementation and integration costs | -1.9% | Global, particularly affecting SMEs | Short term (≤ 2 years) |
| Data privacy and sovereignty hurdles | -1.2% | EU and Asia-Pacific core, expanding globally | Medium term (2-4 years) |
| Talent shortage in risk data science and AI | -1.1% | Global, acute in North America and the EU | Medium term (2-4 years) |
| Model-risk audits are slowing GenAI deployment | -0.7% | North America and the EU, emerging in the Asia-Pacific | Short term (≤ 2 years) |
| Source: Mordor Intelligence | |||
High implementation and integration costs
Total cost of ownership still challenges mid-market buyers. Initial licence fees, data migration, and user training often exceed internal budget thresholds, especially when legacy systems lack standard interfaces. OECD studies confirm that many SMEs remain unaware of public incentives that could offset technology investments.[3]Organisation for Economic Co-operation and Development, “SME Digitalisation to Manage Shocks and Transitions,” oecd.org Vendors have responded with tiered modules, usage-based pricing, and marketplace apps, yet customization and regulatory reporting packs keep project fees elevated. These realities delay procurement decisions and restrain the otherwise rapid uptake of the risk aggregation and exposure modelling tools market among smaller organizations.
Data privacy and sovereignty hurdles
Financial institutions operating across jurisdictions must adhere to conflicting rules on where data can reside and how it can be processed. Europe’s Digital Operational Resilience Act imposes strict oversight on third-party ICT providers, forcing banks to renegotiate cloud contracts and conduct comprehensive risk assessments.[4]Wolters Kluwer, “How to Build Strong Bank-Fintech Partnerships: Opportunities, Risks, and Compliance Considerations,” wolterskluwer.com In the Asia-Pacific region, data localization clauses proliferate in China, India, and Indonesia, complicating multi-tenant architectures. To remain compliant, vendors build regional data centers, introduce bring-your-own-key encryption, and certify under multiple standards. These adjustments lengthen deployment timelines and raise operating costs, tempering growth in segments of the risk aggregation and exposure modelling tools market that rely on seamless cross-border data flows.
*Our forecasts treat driver/restraint impacts as directional, not additive. The impact forecasts reflect baseline growth, mix effects, and variable interactions.
Segment Analysis
By Component: Services Acceleration Drives Platform Evolution
Software continued to dominate spending in 2024, capturing 71.4% of the risk aggregation and exposure modelling tools market share as firms prioritized robust analytics engines and standardized reporting interfaces. Yet the Services segment posted the faster trajectory, advancing at a 16.1% CAGR through 2030 as organizations relied on external expertise to configure machine-learning models, automate lineage tracking, and validate regulatory outputs. Larger banks use consulting hours to map complex portfolios into unified taxonomies, while insurers lean on managed services for model retuning during volatile underwriting cycles. The resulting shift means a growing portion of 2030 revenue will stem from integration, training, and continuous optimization rather than pure licence fees.
Demand for advisory and managed offerings stems from the recognition that technology alone does not mitigate risk without governance, data quality, and user adoption. Union Bank of India’s modernization program demonstrates the pattern: extensive professional services underpinned the roll-out of SAS IRM modules, producing measurable regulatory capital efficiencies and live key-risk-indicator dashboards. Across other regions, healthcare providers retain specialists to embed privacy-by-design controls, while energy utilities engage cyber consultants to calibrate operational resilience models. These trends reinforce the strategic role of service portfolios in sustaining growth across the risk aggregation and exposure modelling tools market.


By Deployment Mode: Cloud Transformation Accelerates
Cloud-based solutions accounted for 64.3% of 2024 revenue, underscoring how subscription delivery and elastic compute have become mainstream for mission-critical workloads. The segment is projected to deliver a 15.6% CAGR to 2030, reflecting user appetite for real-time analytics without incurring hardware refresh cycles. For the first time, even stress-testing and high-volume Monte Carlo simulations are migrating to containerized platforms that spin up large clusters only when peak loads demand it. This efficiency persuades audit committees that cloud cost profiles now align with strict capital-planning disciplines.
On-premise installations persist among institutions subject to explicit data residency rules or isolated network mandates. These users prefer hybrid patterns in which sensitive datasets remain behind firewalls while less confidential scenarios execute in the public cloud. Treasury GPT’s rollout illustrates a middle ground, embedding an AI copilot inside a SaaS treasury module yet allowing data to stay within the client’s chosen sovereignty zone. Flexible deployment keeps the risk aggregation and exposure modelling tools market accessible to banks, insurers, and corporates whose boards demand customizable control over data storage while still benefiting from pay-as-you-go scalability.
By Organization Size: SME Adoption Drives Market Expansion
Large Enterprises controlled 68.3% of 2024 billings owing to their sizeable exposures and established compliance budgets. However, SME demand is projected to increase at a 17.1% CAGR through 2030 as subscription pricing and pre-configured templates lower entry barriers. Mid-tier manufacturers, regional banks, and fintechs now procure starter packages that integrate core risk registers with automated incident workflows. This trend represents one of the most significant democratizing forces within the risk aggregation and exposure modelling tools market.
Survey data reveal that 74% of mid-market respondents plan to boost technology spend despite limited in-house data science resources. Vendors address the skills gap by bundling low-code workflow builders and guided analytics, shortening deployment to weeks rather than months. In parallel, government grant programs encourage SMEs to modernize cyber and operational controls, making compliance funding more accessible. Collectively, these factors unlock new revenue pools and diversify the customer base across the risk aggregation and exposure modelling tools market.
By End-user Industry: Healthcare Emergence Reshapes Demand
The BFSI sector retained leadership with 46.2% of 2024 turnover, driven by stringent regulatory capital regimes and sophisticated trading operations that require granular exposure metrics. Yet Healthcare and Life Sciences is forecast to outpace all segments at an 18.1% CAGR, propelled by patient-data sensitivity, clinical-trial complexity, and stricter reporting around product safety events. Hospitals need unified dashboards that track third-party vendor cyber hygiene, while biotech firms model supply interruptions for temperature-sensitive compounds. These requirements push the risk aggregation and exposure modelling tools market into functional areas historically served by niche compliance tools.
Energy, utilities, and manufacturing users are incorporating ESG risk factors alongside traditional operational metrics. Widespread automation, IoT sensors, and renewable integration introduce new failure modes that surpass manual spreadsheet processes. Integrated platforms capable of ingesting SCADA feeds and overlaying real-time threat intelligence have begun to replace isolated safety management systems. Such convergence underlines the expanding scope of the risk aggregation and exposure modelling tools market beyond purely financial use cases.
Geography Analysis
North America remains the largest regional contributor, accounting for 41.2% of 2024 spending. Basel III Endgame deadlines and a dense regulatory ecosystem spanning the Federal Reserve, FDIC, and OCC sustain enterprise urgency for unified data aggregation and model-risk governance. United States institutions continue to pilot generative AI for scenario design, while Canadian banks prioritize climate-related scenario exercises under OSFI guidelines. The robust fintech landscape and deep cloud adoption further entrench the region’s leadership position in the risk aggregation and exposure modelling tools market.
Asia-Pacific registers the highest momentum, expanding at a 16.6% CAGR to 2030. Chinese financial conglomerates are modernizing credit and liquidity engines to align with global standards, while Japanese megabanks retrofit market-risk calculators to meet local FSA expectations. India’s public-sector banks deploy cloud-hosted operational risk modules to handle growing digital payment volumes. Insurance groups in Singapore and Australia raise demand for cyber-risk quantification as underwriting losses climb. Frequent natural catastrophes, causing USD 65 billion of economic loss in 2023 alone, amplify the need for probabilistic event models and drive incremental revenue into the region’s share of the risk aggregation and exposure modelling tools market.
Europe delivers steady growth as the Digital Operational Resilience Act, GDPR, and forthcoming Basel 3.1 add layers of compliance complexity. Institutions in Germany, France, and the Netherlands embrace cloud solutions hosted in sovereign regions to satisfy data-privacy mandates while capitalizing on elastic compute for climate stress tests. The United Kingdom maintains an innovation edge, piloting AI-enabled model governance sandboxes under the FCA’s regulatory tech initiatives. Although regional fragmentation complicates cross-border rollouts, flexible architectures and multi-jurisdictional reporting packs keep the risk aggregation and exposure modelling tools market competitive across the continent.

Competitive Landscape
The vendor ecosystem is moderately fragmented, with platform leaders controlling a sizeable but not dominant portion of total revenue. SAS Institute, Oracle, IBM, Wolters Kluwer, and FIS anchor the top tier through broad product suites, proven regulatory mappings, and scalable cloud infrastructures. SAS secured top rankings in AI for Banking and Model-Risk categories, reinforcing its reputation for advanced analytics that underpin enterprise-wide decisioning. Wolters Kluwer leverages deep regulatory intelligence to differentiate its integrated compliance frameworks.
Emerging specialists concentrate on vertical depths or usability innovation. Protecht, for instance, raised USD 280 million in March 2025 to expand its low-code platform that targets mid-market corporates with rapid onboarding workflows. Resolver’s acquisition by Kroll in December 2024 exemplifies consolidation as advisory firms pair software IP with consulting know-how to deliver bundled offerings. Open-source analytics stacks and API-first frameworks also create pathways for fintech entrants to carve out micro-services that integrate into larger platforms.
Competitive dynamics now center on cloud optimization, embedded AI assistants, and extensible app marketplaces rather than feature parity. Vendors fully embracing Kubernetes orchestration and continuous delivery pipelines update models weekly instead of quarterly, shrinking time-to-value and improving stickiness. Strategic partnerships with hyperscale cloud providers unlock co-selling channels and joint compliance certifications, accelerating global reach. As enterprises consolidate contracts, the risk aggregation and exposure modelling tools market rewards suppliers offering comprehensive life-cycle services, from advisory through post-implementation tuning, over point-product vendors relying solely on licence revenue.
Risk Aggregation And Exposure Modeling Tools Industry Leaders
SAS Institute Inc.
Oracle Corporation
IBM Corporation
SAP SE
Fidelity National Information Services, Inc. (FIS)
- *Disclaimer: Major Players sorted in no particular order

Recent Industry Developments
- April 2025: FIS rolled out Treasury and Risk Manager Quantum Cloud Edition to deliver real-time visibility across cash and risk positions.
- April 2025: FIS agreed to acquire Global Payments’ Issuer Solutions business for USD 12 billion, targeting USD 125 million annual synergies.
- March 2025: FIS launched Treasury GPT, earning “Best Solution Innovation in AI” at the Treasury Management International Awards.
- March 2025: Protecht raised USD 280 million in new funding, lifting total investment to USD 322 million.


Global Risk Aggregation And Exposure Modeling Tools Market Report Scope
| Software |
| Services |
| Cloud-based |
| On-premise |
| Large Enterprises |
| Small and Medium Enterprises (SMEs) |
| Banking, Financial Services and Insurance (BFSI) |
| Energy and Utilities |
| Healthcare and Life Sciences |
| Manufacturing |
| Retail and E-commerce |
| Government and Public Sector |
| Others (Telecom, Media, etc.) |
| North America | United States | |
| Canada | ||
| Mexico | ||
| South America | Brazil | |
| Argentina | ||
| Rest of South America | ||
| Europe | United Kingdom | |
| Germany | ||
| France | ||
| Italy | ||
| Spain | ||
| Russia | ||
| Rest of Europe | ||
| Asia-Pacific | China | |
| Japan | ||
| India | ||
| South Korea | ||
| Australia | ||
| Rest of Asia-Pacific | ||
| Middle East and Africa | Middle East | Gulf Cooperation Council (GCC) |
| Turkey | ||
| Rest of Middle East | ||
| Africa | South Africa | |
| Nigeria | ||
| Rest of Africa | ||
| By Component | Software | ||
| Services | |||
| By Deployment Mode | Cloud-based | ||
| On-premise | |||
| By Organization Size | Large Enterprises | ||
| Small and Medium Enterprises (SMEs) | |||
| By End-user Industry | Banking, Financial Services and Insurance (BFSI) | ||
| Energy and Utilities | |||
| Healthcare and Life Sciences | |||
| Manufacturing | |||
| Retail and E-commerce | |||
| Government and Public Sector | |||
| Others (Telecom, Media, etc.) | |||
| By Geography | North America | United States | |
| Canada | |||
| Mexico | |||
| South America | Brazil | ||
| Argentina | |||
| Rest of South America | |||
| Europe | United Kingdom | ||
| Germany | |||
| France | |||
| Italy | |||
| Spain | |||
| Russia | |||
| Rest of Europe | |||
| Asia-Pacific | China | ||
| Japan | |||
| India | |||
| South Korea | |||
| Australia | |||
| Rest of Asia-Pacific | |||
| Middle East and Africa | Middle East | Gulf Cooperation Council (GCC) | |
| Turkey | |||
| Rest of Middle East | |||
| Africa | South Africa | ||
| Nigeria | |||
| Rest of Africa | |||


Key Questions Answered in the Report
How large is the global risk aggregation and exposure modelling tools market in 2025?
The risk aggregation and exposure modelling tools market size is valued at USD 16.75 billion in 2025.
What growth rate is expected for risk management software through 2030?
The market is projected to post a 12.73% CAGR, reaching USD 30.50 billion by the end of 2030.
Which deployment model is growing fastest?
Cloud-based platforms are increasing at a 15.6% CAGR as firms seek scalable and cost-efficient architectures.
Why is healthcare demand rising so rapidly?
Patient data protection rules, clinical-trial oversight, and heightened cybersecurity threats are driving an 18.1% CAGR in healthcare adoption.
Which region is expanding most quickly?
Asia-Pacific leads regional expansion with a 16.6% CAGR, propelled by regulatory modernization and digital banking growth.
What is the main challenge for SME adoption?
High implementation and integration costs remain the key barrier, though modular subscription offerings are beginning to lower entry hurdles.
Page last updated on:


