Managed Threat Intelligence Services Market Size and Share
Market Overview
| Study Period | 2019 - 2030 |
|---|---|
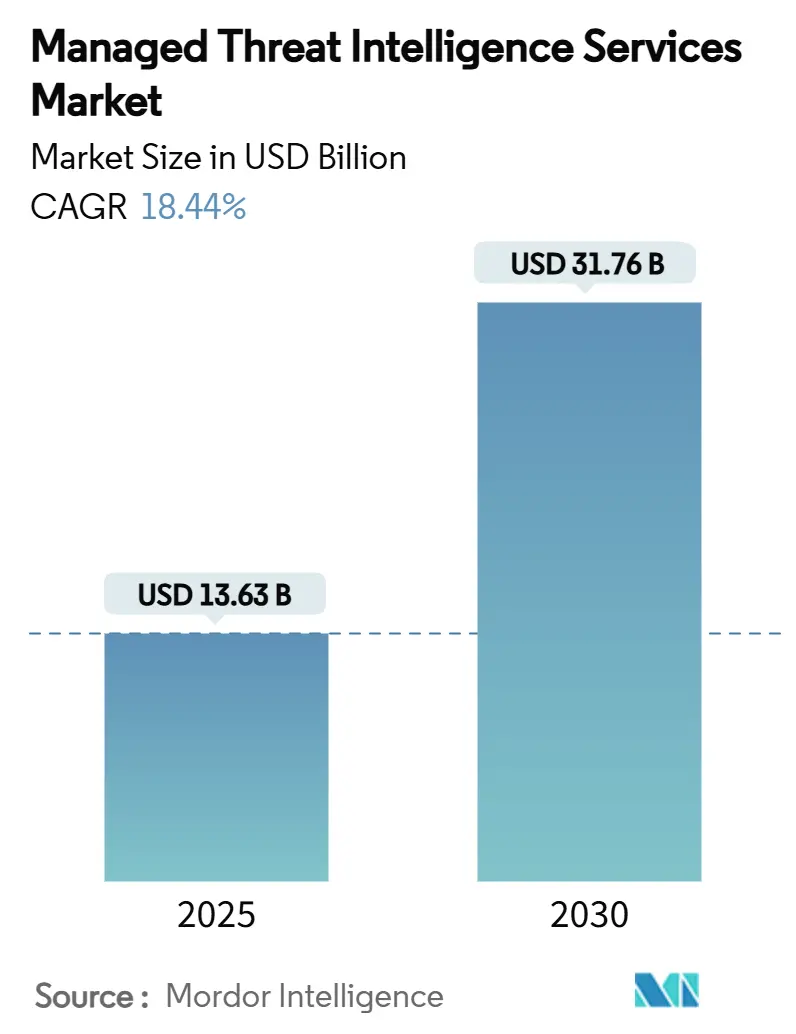
| Market Size (2025) | USD 13.63 Billion |
| Market Size (2030) | USD 31.76 Billion |
| Growth Rate (2025 - 2030) | 18.44% CAGR |
| Fastest Growing Market | Asia Pacific |
| Largest Market | North America |
| Market Concentration | Medium |
Major Players *Disclaimer: Major Players sorted in no particular order Image © Mordor Intelligence. Reuse requires attribution under CC BY 4.0. | |
Managed Threat Intelligence Services Market Analysis by Mordor Intelligence
The managed threat intelligence services market size stood at USD 13.63 billion in 2025 and is forecast to reach USD 31.76 billion by 2030, advancing at an 18.44% CAGR. Heightened regulatory scrutiny, a sharp rise in sophisticated ransomware campaigns, and persistent cyber-talent shortages are accelerating demand for outsourced threat intelligence. Financial institutions must now comply with the Digital Operational Resilience Act (DORA), while all U.S. public companies face four-day breach-reporting mandates under new SEC rules, driving continuous monitoring investments.[1]“DORA Regulation,” Tenable, tenable.com Simultaneously, insurers increasingly require external intelligence feeds before underwriting cyber policies, further expanding addressable demand. Large enterprises still dominate spending, yet the fastest growth comes from small and medium businesses that lack in-house expertise but confront the same threat volume. Across every buyer segment, cloud-delivered and AI-enabled platforms are favoured for their scalability, rapid integration, and automated enrichment of raw data into actionable insight.
Key Report Takeaways
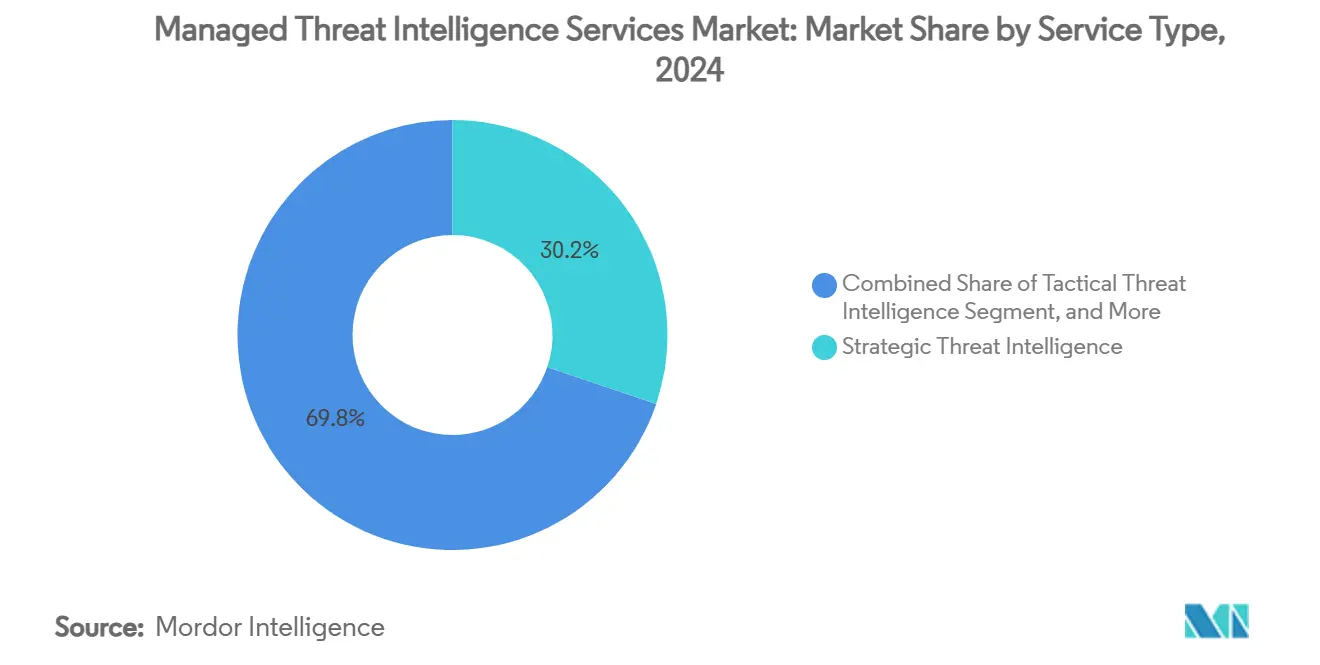
- By service type, Strategic Threat Intelligence captured 30.2% of the managed threat intelligence services market share in 2024, whereas Digital Risk and Brand Protection is projected to expand at a 24.7% CAGR to 2030.
- By deployment mode, cloud-based platforms accounted for 64.8% of the managed threat intelligence services market size in 2024 and are advancing at a 22.1% CAGR through 2030.
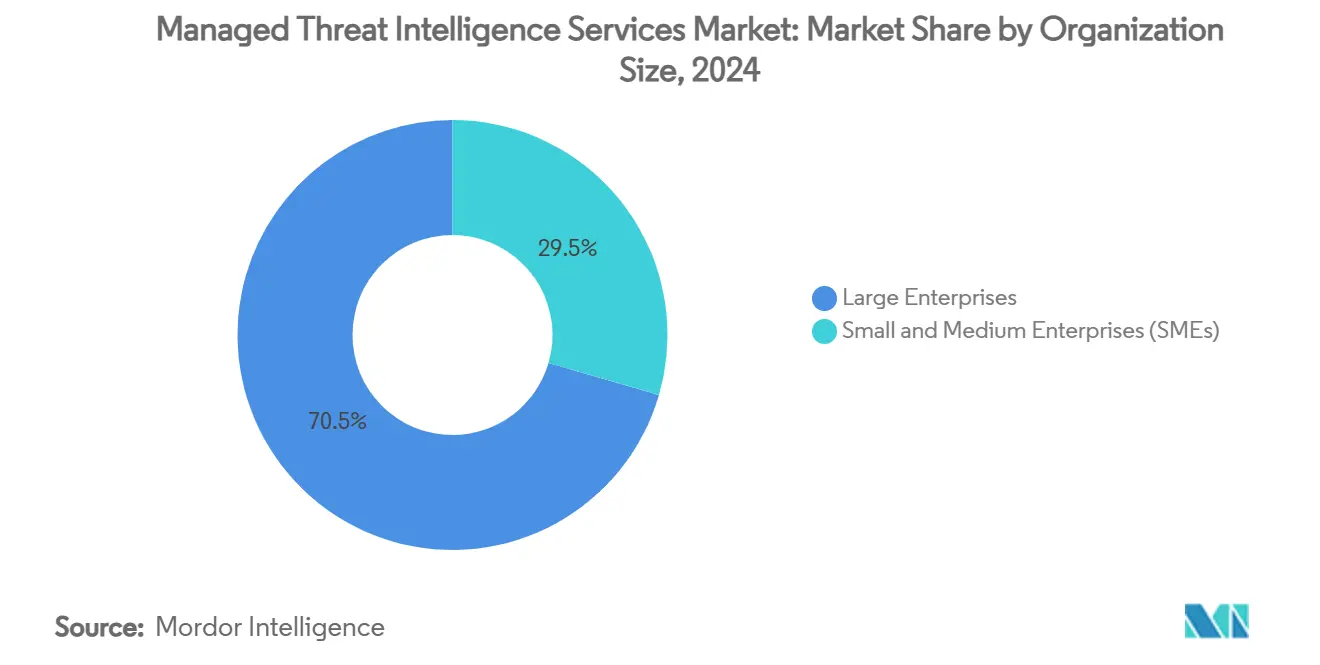
- By organization size, large enterprises held 70.5% revenue share in 2024, but small and medium enterprises recorded the highest forecast CAGR at 22.8% through 2030.
- By end-user industry, the BFSI sector led with 26.4% of the managed threat intelligence services market size in 2024, while healthcare and life sciences are growing at a 24.3% CAGR to 2030.
- By geography, North America commanded a 43.1% share of the managed threat intelligence services market in 2024, and Asia-Pacific is on track to post a 21.4% CAGR between 2025 and 2030.
Global Managed Threat Intelligence Services Market Trends and Insights
Drivers Impact Analysis*
| Driver | (~) % Impact on CAGR Forecast | Geographic Relevance | Impact Timeline |
|---|---|---|---|
| Escalating volume and sophistication of cyber-attacks | +4.2% | Global | Medium term (2–4 years) |
| Growing regulatory and compliance pressure (e.g., DORA, SEC) | +3.8% | North America and the EU | Short term (≤ 2 years) |
| Shortage of in-house cyber-talent is pushing outsourcing | +3.5% | Global with an acute impact in the Asia-Pacific | Medium term (2–4 years) |
| AI-driven automation is improving the signal-to-noise ratio | +2.9% | Global | Long term (≥ 4 years) |
| Convergence of threat intelligence with third-party risk scoring | +2.1% | North America and the EU | Medium term (2–4 years) |
| Cyber-insurance underwriting requiring external feeds | +1.9% | North America leads the global | Short term (≤ 2 years) |
| Source: Mordor Intelligence | |||
Escalating Volume and Sophistication of Cyber-Attacks
Ransomware incidents almost doubled to 4,429 reported cases in 2023, and zero-day vulnerabilities spiked 43%, underscoring the relentless escalation of threat actor capabilities. Nation-state groups such as UNC5221 exploit critical infrastructure flaws, often employing AI-generated deepfakes to advance social-engineering success rates. Healthcare institutions absorbed roughly one-quarter of all publicly disclosed cyber incidents in 2024 because medical records remain highly lucrative on dark-web markets.[2]“Industry News 2025: Healthcare’s Growing Threat Landscape,” ISACA, isaca.org Law-enforcement takedowns of large ransomware gangs have splintered the criminal ecosystem, lowering barriers to entry and elevating attack frequency. The emergence of self-learning, AI-powered malware further outpaces traditional defences and has prompted organisations to invest in managed threat intelligence services that can detect adaptive campaigns in near real-time.
Growing Regulatory and Compliance Pressure
DORA applies to more than 22,000 financial entities across the European Union, compelling proactive threat-intelligence sharing and resilience testing under fines reaching 1% of daily turnover for non-compliance. In the United States, SEC disclosure rules effective since September 2023 require public companies to report material breaches within four business days, forcing boards to maintain continuous situational awareness. Proposed HIPAA modifications introduce multifactor authentication and encryption mandates, strengthening demand for vertical-specific intelligence across the healthcare system. Overlapping frameworks create reporting complexity that many firms cannot manage internally, prompting accelerated outsourcing to providers able to standardise and automate compliance documentation across jurisdictions.
Shortage of In-House Cyber-Talent Pushing Outsourcing
Sixty-one percent of small and mid-sized businesses operate without dedicated cybersecurity staff, and mid-market firms average only two specialists, leaving critical gaps in detection and response capacity. The skill shortage is most acute in the Asia-Pacific region, where digitalisation outpaces workforce development, amplifying reliance on external expertise. Managed threat intelligence services providers combine analyst talent with machine-learning tools, enabling junior staff to deliver enterprise-grade insights at lower cost. Flexible subscription models and regional delivery hubs further reduce onboarding friction for resource-constrained organisations seeking rapid uplift in security posture.
AI-Driven Automation Improving Signal-to-Noise Ratio
Artificial intelligence now augments every phase of the threat-intelligence lifecycle. Google Security Operations merges SIEM, SOAR, and curated intelligence so that common phishing or ransomware alerts can be contained automatically, shrinking mean-time-to-respond. Natural-language interfaces permit analysts to query petabyte-scale datasets without advanced scripting knowledge, widening the talent pool and accelerating investigation workflows. Meanwhile, QR-code phishing and AI-generated email lures surged 248% and 1,265% respectively in 2024, highlighting the arms race between offensive and defensive AI. Providers that integrate machine learning to filter noise and enrich high-fidelity leads improve analyst efficiency and lower customer alert fatigue.
Restraints Impact Analysis*
| Restraint | (~) % Impact on CAGR Forecast | Geographic Relevance | Impact Timeline |
|---|---|---|---|
| Data-sovereignty and privacy restrictions | −2.3% | EU and Asia-Pacific core with spillover to MEA | Medium term (2–4 years) |
| High subscription and integration costs for SMEs | −1.8% | Global acute in emerging markets | Short term (≤ 2 years) |
| Alert fatigue from low-quality feeds | −1.4% | Global | Medium term (2–4 years) |
| Ongoing market consolidation is reducing vendor diversity | −0.9% | Global is concentrated in North America | Long term (≥ 4 years) |
| Source: Mordor Intelligence | |||
Data-Sovereignty and Privacy Restrictions
The Schrems II ruling invalidated the EU-US Privacy Shield, complicating cross-border data transfers for threat-intelligence providers. Conflicts between U.S. surveillance laws and the EU General Data Protection Regulation (GDPR) sharpen governance challenges and force some enterprises to insist on in-region processing.[3]“EU Data Sovereignty and U.S. Tech,” StratoKey, stratokey.com An expanding roster of Asia-Pacific nations now enforces data-localisation mandates, fragmenting global visibility and forcing providers to stand up local infrastructure, which raises cost and operational overhead. Encryption gateways and tokenisation offer partial relief but add complexity that smaller firms struggle to manage.
High Subscription and Integration Costs for SMEs
Full-spectrum threat-intelligence packages can cost hundreds of thousands of dollars, placing them beyond the reach of many SMEs. Even tiered offerings require specialist implementation to map feeds into existing SIEM stacks, driving additional consulting expenses. Custom connectors or API development work may prolong roll-outs, tying up scarce IT resources and delaying time-to-value. Although cloud-native and AI-driven models gradually reduce the cost of ownership, price sensitivity remains a near-term barrier for widespread SME adoption.
*Our forecasts treat driver/restraint impacts as directional, not additive. The impact forecasts reflect baseline growth, mix effects, and variable interactions.
Segment Analysis
By Service Type: Strategic Intelligence Gains Board-Level Visibility
Strategic intelligence generated the largest slice of the managed threat intelligence services market size at 30.2% in 2024, proving its value in shaping mergers, market entry, and geopolitical risk strategy. Its contextual focus on adversary motives elevates conversation to the executive level and drives integration with enterprise-wide risk dashboards. Digital Risk and Brand Protection is projected to expand at a 24.7% CAGR, fuelled by dark-web credential dumping and social-media impersonation scams that threaten customer trust.
Digitally native brands increasingly bundle tactical and operational intelligence with brand-protection feeds to achieve a single view of risk across open, deep, and dark web sources. Uptake is reinforced by AI-powered entity-resolution tools that correlate chatter, leaked credentials, and infrastructure indicators in hours rather than days, allowing marketing, fraud, and security teams to act in concert. As the platform model matures, buyers expect unified dashboards that merge strategic narrative with technical artefacts, driving further convergence within the managed threat intelligence services market.


By Deployment Mode: Cloud Platforms Dominate New Spending
Cloud-based delivery captured 64.8% of 2024 revenue and is growing at a 22.1% CAGR, reflecting organisations’ preference for elastic scaling, rapid feature releases, and lower capital expenditure. The managed threat intelligence services market share advantage stems from native integrations with leading SOAR, endpoint, and identity solutions that accelerate time-to-value. Hybrid options address legacy or regulatory constraints but exhibit slower momentum as data-residency concerns ease in many jurisdictions.
Cloud hyperscalers now offer in-country logging regions that satisfy sovereignty mandates while retaining access to global enrichment datasets, removing a historical hurdle to cloud adoption. On-premises deployments persist mainly in defence and critical infrastructure settings where air-gapped environments remain mandatory. Nonetheless, vendors continue to introduce lightweight virtual appliances that synchronise anonymised telemetry with cloud analytics, blurring traditional boundaries.
By Organization Size: SME Uptake Accelerates Amid Talent Gaps
Large enterprises accounted for 70.5% of 2024 revenue, driven by their complex attack surfaces and stringent reporting obligations that require continuous intelligence. Even so, SME spending is forecast to climb at a 22.8% CAGR as resource-constrained firms turn to subscription models for affordable expertise. AI assistants and natural-language dashboards lower the skills threshold, enabling non-specialists to consume intelligence within existing IT workflows.
The managed threat intelligence services market size for SMEs will benefit from bundled offerings that combine curated feeds with automated remediation playbooks. Providers increasingly tier services by maturity level, allowing micro-enterprises to start with essential credential-leak monitoring and scale toward full operational intelligence as budgets permit. Such flexibility mitigates price-sensitivity and underpins sustained double-digit growth across the segment.
By End-User Industry: Healthcare Moves From Lagging to Leading Growth
The BFSI vertical retained 26.4% market share in 2024 due to entrenched regulatory regimes and a long history of organised crime targeting. Yet healthcare and life sciences are forecast to grow at a 24.3% CAGR as ransomware crews monetize medical data and regulators tighten minimum-security requirements. Connected diagnostic devices, electronic health records, and telemedicine platforms enlarge risk exposure, pushing hospitals toward managed offerings that blend operational technology and IT intelligence.
Manufacturing, energy, and utilities increasingly integrate third-party risk scoring after witnessing supply-chain attacks on industrial control systems. Government and defence agencies remain steady customers but often maintain in-house analysis teams that contract for specialised regional insight. Retail and e-commerce adoption rises in parallel with omnichannel payment fraud, cementing threat intelligence as a must-have rather than a nice-to-have across consumer-facing sectors.
Geography Analysis
North America retained 43.1% of 2024 revenue thanks to early adoption of SEC disclosure rules and mature public–private information-sharing alliances such as CISA’s Joint Cyber Defense Collaborative. Enterprises in the region treat threat intelligence as foundational security infrastructure rather than an optional add-on. Mandatory SEC incident disclosures and an aggressive ransomware backdrop ensure that organisations maintain high-frequency visibility into emerging tactics, techniques, and procedures. Government-backed platforms such as CISA’s Automated Indicator Sharing help normalise intelligence consumption and shorten dwell times across critical infrastructure sectors.
Asia-Pacific’s 21.4% forecast CAGR reflects a surge of digitisation grants, cloud adoption, and public-sector spending on cyber-range programmes. The significant growth of the region is primarily due to governments' funding of national cyber-capacity programmes and imposing data-breach notification laws reminiscent of GDPR.[4]“E-Commerce Evolution in Asia and the Pacific,” Asian Development Bank, adb.org The region accounted for 31% of global cyber-attacks in 2022, underscoring rising urgency. Sovereignty concerns are being addressed through localised security operations and data centres, which unlock cloud adoption without compromising compliance. Markets such as Indonesia, Singapore, and Australia incentivise local data residency without isolating networks from the global context, a policy stance that benefits multinational intelligence providers partnering with regional managed security service providers. Multilingual threat reporting and AI-driven translation further expand addressable demand by lowering language barriers.
Europe combines stringent data-protection philosophies with expansive resilience directives. DORA obliges financial entities to maintain intelligence-sharing capabilities and stress-test their ICT supply chains, guaranteeing sustained contract renewals for managed service providers. Regional players take advantage of Schrems II fallout by marketing EU-only processing paths. The Middle East and Africa witness heightened procurement from upstream energy operators responding to attempted sabotage of operational technology, whereas South America’s growth remains incremental due to uneven cyber-skills pipelines and macroeconomic pressure.
Competitive Landscape
The managed threat intelligence services market features a moderately consolidated field where scale, data breadth, and AI investment dictate sustainable advantage. Mastercard’s USD 2.65 billion acquisition of Recorded Future in February 2025 signalled that global payment networks view intelligence not as an ancillary service but as strategic fraud-prevention infrastructure. Google’s earlier purchase of Mandiant brought incident-response depth and proprietary telemetry into its cloud platform, accelerating time-to-detect for customer workloads.
Intel 471 bolstered its hunting prowess by buying Cyborg Security in December 2024, illustrating a broader land-and-expand strategy whereby vendors add adjacent analytics modules to lock in subscribers. CrowdStrike’s single-agent architecture generates USD 3.65 billion in annual recurring revenue, proving that bundling endpoint, cloud, and intelligence services under a unified data fabric resonates with buyers seeking simplified vendor stacks.
Competitive differentiation increasingly hinges on proprietary collection channels—dark-web sensors, DNS telemetry, and cloud-native honeypots—enriched by large-language-model summarisation that cuts analyst triage time. Start-ups exploit niche opportunities such as medical-device threat intelligence or industrial-control-system telemetry, while larger incumbents integrate these capabilities through acquisition. Although consolidation narrows supplier diversity, new entrants continue to emerge around vertical specialisation and regional compliance nuances.
Managed Threat Intelligence Services Industry Leaders
Recorded Future Inc.
Mandiant Inc.
CrowdStrike Holdings Inc.
Group-IB Global Private Ltd.
Flashpoint Inc.
- *Disclaimer: Major Players sorted in no particular order

Recent Industry Developments
- July 2025: Google Cloud launched the Indonesia BerdAIa for Security programme to deliver AI-enabled intelligence from in-country data regions.
- July 2025: Mandiant detailed ongoing SonicWall SMA exploitation by UNC6148, reinforcing the need for real-time managed monitoring.
- April 2025: Sandra Joyce and Jurgen Kutscher assumed leadership of Mandiant units after Kevin Mandia stepped down, streamlining Google’s post-acquisition integration.
- April 2025: Mandiant discovered active exploitation of Ivanti Connect Secure vulnerability CVE-2025-22457 by UNC5221, introducing malware families TRAILBLAZE and BRUSHFIRE.


Global Managed Threat Intelligence Services Market Report Scope
| Strategic Threat Intelligence |
| Tactical Threat Intelligence |
| Operational Threat Intelligence |
| Technical / Indicators-led Intelligence |
| Digital Risk and Brand Protection |
| Cloud-based |
| On-premises |
| Hybrid |
| Large Enterprises |
| Small and Medium Enterprises (SMEs) |
| BFSI |
| IT and Telecom |
| Government and Defense |
| Healthcare and Life Sciences |
| Retail and E-commerce |
| Energy and Utilities |
| Manufacturing |
| North America | United States | |
| Canada | ||
| Mexico | ||
| South America | Brazil | |
| Argentina | ||
| Rest of South America | ||
| Europe | Germany | |
| United Kingdom | ||
| France | ||
| Russia | ||
| Rest of Europe | ||
| Asia-Pacific | China | |
| Japan | ||
| India | ||
| South Korea | ||
| Rest of Asia-Pacific | ||
| Middle East and Africa | Middle East | Saudi Arabia |
| United Arab Emirates | ||
| Turkey | ||
| Rest of Middle East | ||
| Africa | South Africa | |
| Nigeria | ||
| Egypt | ||
| Rest of Africa | ||
| By Service Type | Strategic Threat Intelligence | ||
| Tactical Threat Intelligence | |||
| Operational Threat Intelligence | |||
| Technical / Indicators-led Intelligence | |||
| Digital Risk and Brand Protection | |||
| By Deployment Mode | Cloud-based | ||
| On-premises | |||
| Hybrid | |||
| By Organization Size | Large Enterprises | ||
| Small and Medium Enterprises (SMEs) | |||
| By End-user Industry | BFSI | ||
| IT and Telecom | |||
| Government and Defense | |||
| Healthcare and Life Sciences | |||
| Retail and E-commerce | |||
| Energy and Utilities | |||
| Manufacturing | |||
| By Geography | North America | United States | |
| Canada | |||
| Mexico | |||
| South America | Brazil | ||
| Argentina | |||
| Rest of South America | |||
| Europe | Germany | ||
| United Kingdom | |||
| France | |||
| Russia | |||
| Rest of Europe | |||
| Asia-Pacific | China | ||
| Japan | |||
| India | |||
| South Korea | |||
| Rest of Asia-Pacific | |||
| Middle East and Africa | Middle East | Saudi Arabia | |
| United Arab Emirates | |||
| Turkey | |||
| Rest of Middle East | |||
| Africa | South Africa | ||
| Nigeria | |||
| Egypt | |||
| Rest of Africa | |||


Key Questions Answered in the Report
What is the forecast growth rate for managed threat intelligence services through 2030?
The market is projected to rise from USD 13.63 billion in 2025 to USD 31.76 billion by 2030 at an 18.44% CAGR.
Which service category is expanding the fastest?
Digital Risk and Brand Protection is expected to post a 24.7% CAGR, the highest among all service types.
Why are cloud-based delivery models preferred?
They offer elastic scaling, faster feature updates, and simpler integrations, supporting a 22.1% CAGR and 64.8% share in 2024.
Which region is expected to register the strongest growth?
Asia-Pacific is forecast to grow at a 21.4% CAGR due to rapid digital transformation and evolving regulations.
How do new regulations influence demand?
DORA in the EU and SEC rules in the U.S. require continuous monitoring and prompt breach reporting, driving adoption of managed threat intelligence services.
What challenges limit SME adoption?
High subscription fees and integration complexity remain barriers, though AI-driven, tiered offerings are reducing the total cost of ownership.
Page last updated on:


