Equity Management and Cap Table Software Market Size and Share
Market Overview
| Study Period | 2020 - 2031 |
|---|---|
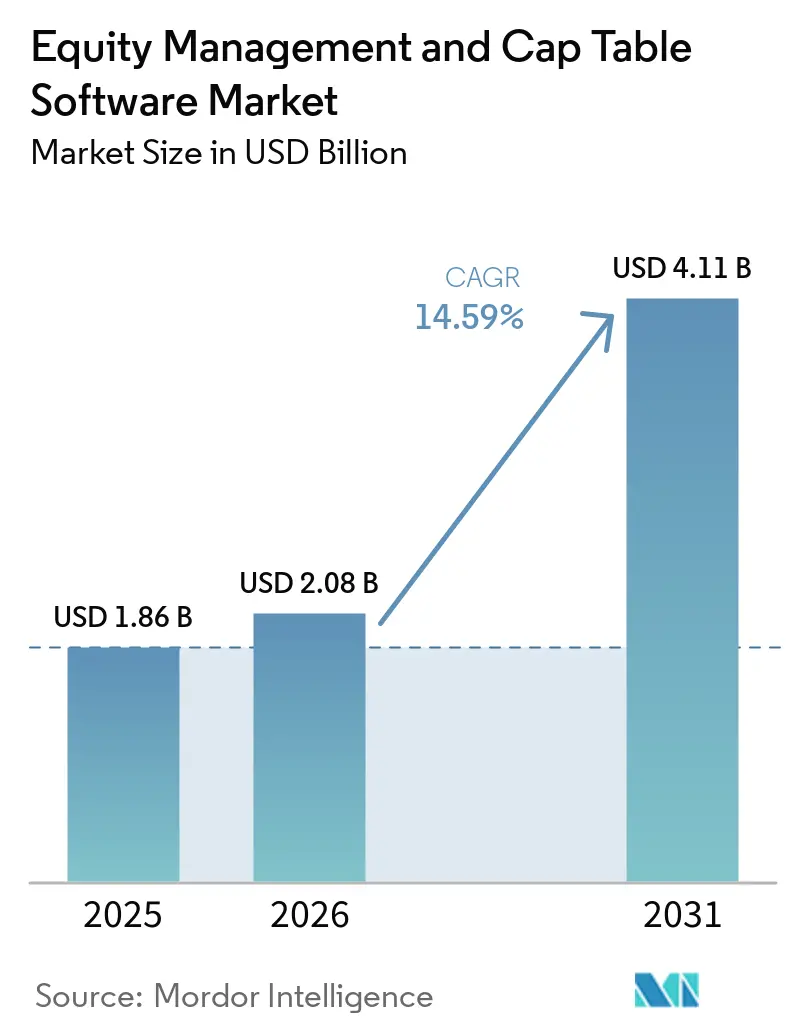
| Market Size (2026) | USD 2.08 Billion |
| Market Size (2031) | USD 4.11 Billion |
| Growth Rate (2026 - 2031) | 14.59% CAGR |
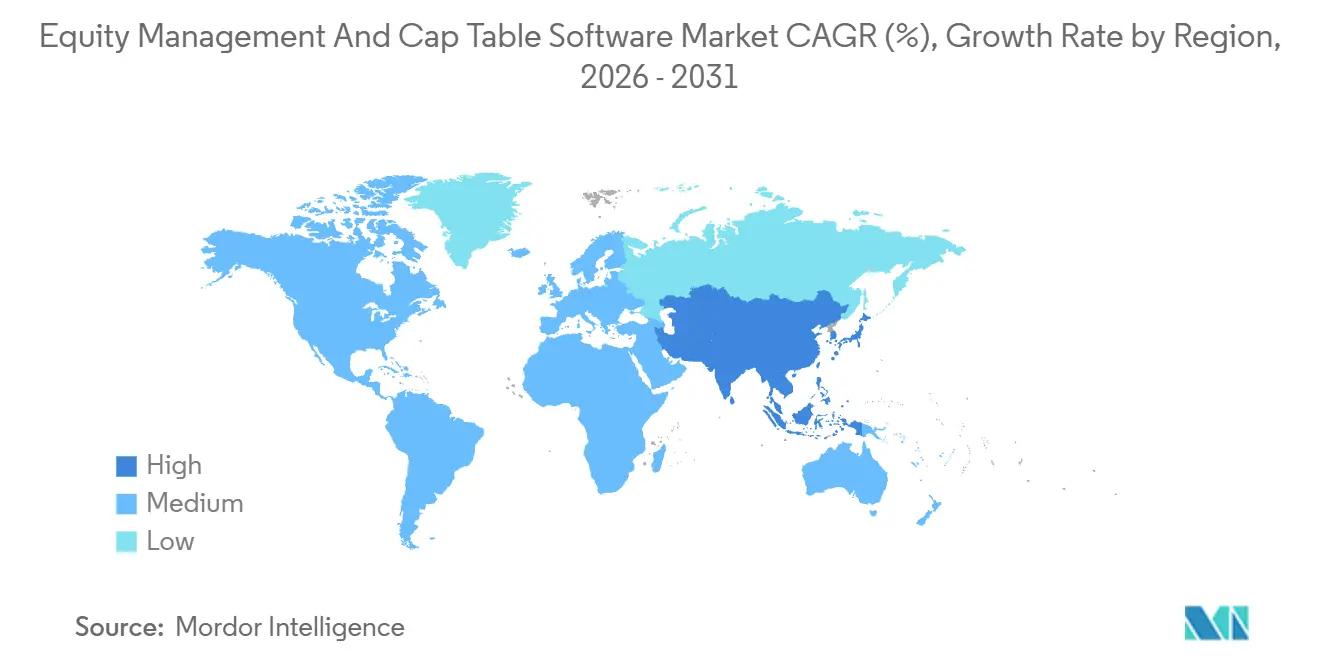
| Fastest Growing Market | Asia-Pacific |
| Largest Market | North America |
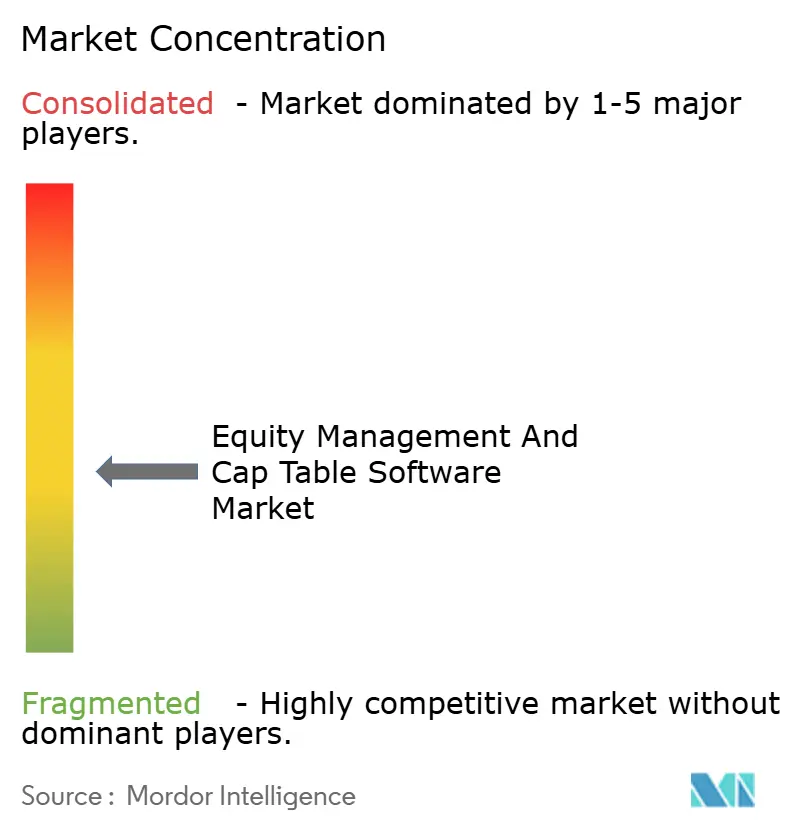
| Market Concentration | Medium |
Major Players *Disclaimer: Major Players sorted in no particular order Image © Mordor Intelligence. Reuse requires attribution under CC BY 4.0. | |
Equity Management and Cap Table Software Market Analysis by Mordor Intelligence
The equity management and cap table software market size was valued at USD 1.86 billion in 2025 and is expected to expand to USD 2.08 billion in 2026, reaching USD 4.11 billion by 2031, growing at a CAGR of 14.59% from 2026 to 2031. This pace of growth shows the equity management and cap table software market is no longer centered only on post-funding administration, because ownership records now sit much closer to compliance, investor communication, and liquidity planning. The equity management and cap table software market has moved from a narrow recordkeeping tool into a broader platform layer that supports tax workflows, secondary transactions, fund administration, and employee equity operations in one environment. Venture activity is still a core demand engine, because each financing event creates cap table updates, valuation triggers, and stakeholder notice requirements that spreadsheets do not manage reliably at scale. The equity management and cap table software market is also benefiting from AI-native company formation, because these businesses tend to issue grants, warrants, and convertible instruments from the earliest stage of operations. Regional growth in Asia-Pacific, together with stronger expectations around data security and cross-border compliance, is pushing vendors to invest in localization, hybrid deployment support, and tighter governance features.
Key Report Takeaways
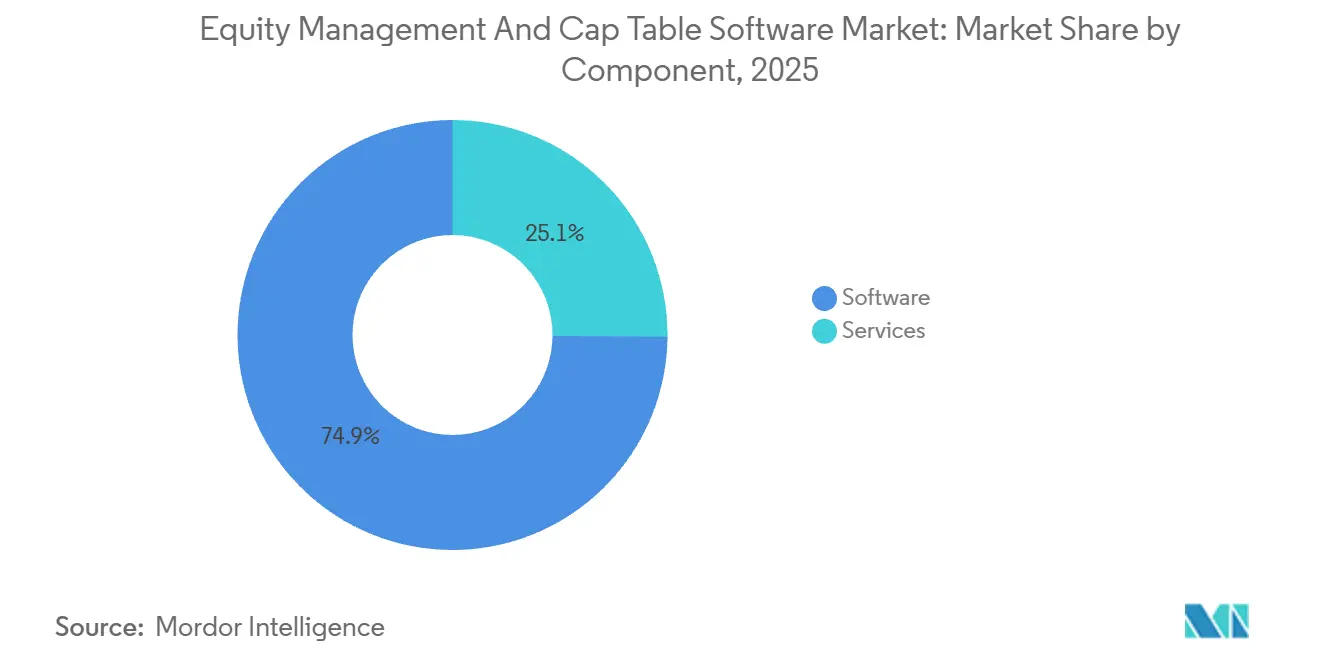
- By component, software accounted for 74.86% of revenue in 2025 in the equity management and cap table software market, while services are forecast to expand at a 15.24% CAGR through 2031.
- By deployment mode, cloud-based deployments accounted for 72.42% of revenue in 2025 and are projected to grow at a 14.88% CAGR through 2031.
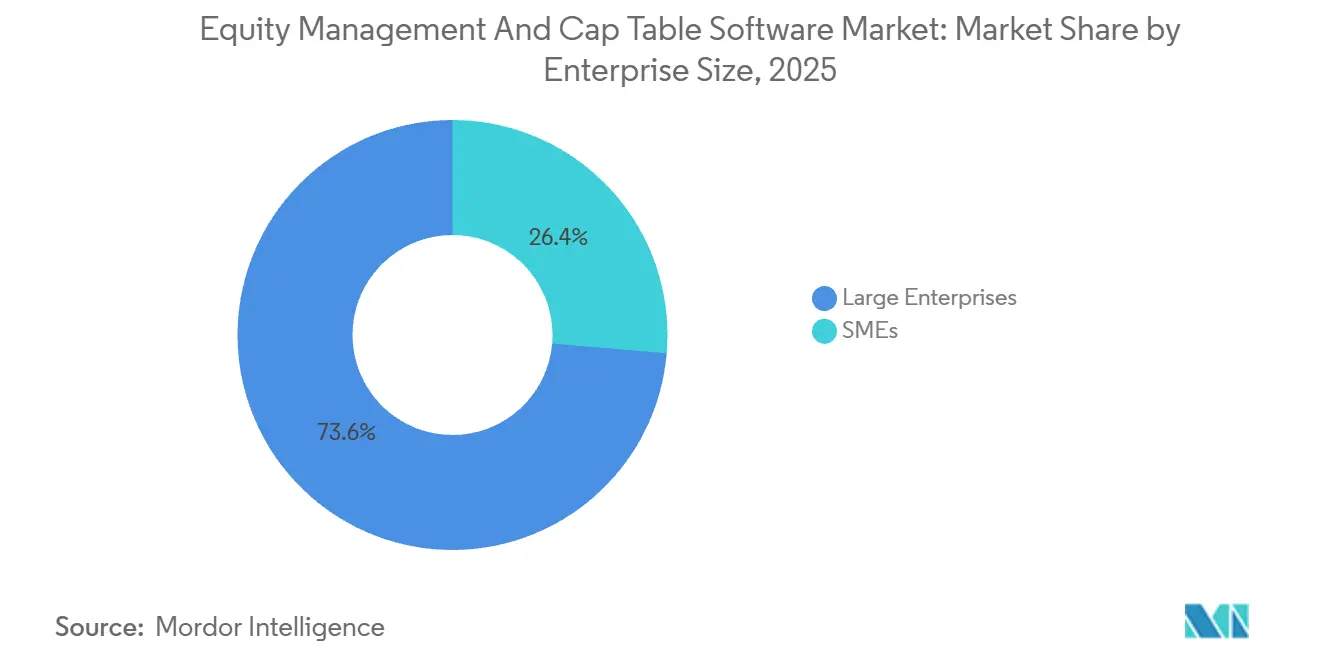
- By enterprise size, large enterprises captured 73.64% of revenue in 2025, while SMEs are expected to record the highest CAGR of 15.76% through 2031.
- By end user, private companies accounted for 51.74% of revenue in 2025 in the equity management and cap table software market, while venture capital and private equity firms are projected to grow at a 15.62% CAGR through 2031.
- By geography, North America held 41.42% of revenue in 2025, while Asia-Pacific is forecast to expand at a 16.41% CAGR through 2031.
Note: Market size and forecast figures in this report are generated using Mordor Intelligence’s proprietary estimation framework, updated with the latest available data and insights as of January 2026.
Global Equity Management and Cap Table Software Market Trends and Insights
Drivers Impact Analysis*
| Driver | (~) % Impact on CAGR Forecast | Geographic Relevance | Impact Timeline |
|---|---|---|---|
| Rising Startup Formation and Venture Funding Digitization | +4.2% | Global | Short term (≤ 2 years) |
| Expansion of Employee Equity Compensation Beyond Founders and Executives | +2.8% | North America, Europe, Asia-Pacific | Medium term (2-4 years) |
| Tightening 409A, Financial Reporting, and Audit Readiness Requirements | +2.1% | North America, EU | Short term (≤ 2 years) |
| Migration From Spreadsheet Workflows to Cloud-Native Collaboration | +1.6% | Global, with early gains in Asia-Pacific core | Short term (≤ 2 years) |
| Growth Of Company-Led Tender Offers and Private Share Liquidity Windows | +1.0% | North America, Europe | Medium term (2-4 years) |
| Multi-Jurisdiction Equity Administration for Globally Distributed Workforces | +0.7% | Asia-Pacific core, spill-over to Middle East and Africa | Long term (≥ 4 years) |
| Source: Mordor Intelligence | |||
Rising Startup Formation and Venture Funding Digitization
The equity management and cap table software market is gaining from stronger startup formation and faster digitization across venture funding workflows. AI-related deals represented more than 25% of global venture capital volume in 2025, which means many new companies started issuing grants, warrants, and convertible instruments almost immediately after formation. That pattern brings audit-grade version control into the first operating months, rather than later around a formal institutional round. Vendors with sub-Series-A pricing are capturing younger clients who can stay on the same platform as stakeholder counts and financing complexity rise. India accounted for 49% of Asian startup formations in 2025, which adds a large localization opportunity for platforms serving multilingual founders, employees, and investors.[1]Organisation for Economic Co-operation and Development, “Start-up Asia,” OECD, oecd.org
Expansion of Employee Equity Compensation Beyond Founders and Executives
The equity management and cap table software market is expanding as equity compensation moves beyond founders and senior executives. J.P. Morgan Workplace Solutions reported in 2024 that 4 in 5 public companies provided equity to senior management, and 63% outsourced equity plan administration to specialized platforms. In the United States, SECURE 2.0 allocated USD 50 million in grants from 2025 through 2029 to reduce ESOP formation costs for small businesses, which supports a wider base of companies that need formal equity recordkeeping. In India, listed companies disclosed INR 15,000 crore (USD 1.79 billion) in aggregate ESOP expenses in FY 2025, up 30% year over year, suggesting broader use of regulated option pools.
Tightening 409A, Financial Reporting, and Audit Readiness Requirements
The equity management and cap table software market is also benefiting from tighter valuation, reporting, and audit expectations. J.P. Morgan Workplace Solutions noted that Section 409A non-compliance can trigger penalties equal to 20% of option value plus an additional 20% excise tax, which has made independent valuations a standard expectation for many U.S. startups. As pre-IPO audit committees apply closer review to stock-based compensation disclosures and ASC 718 methods, companies are maintaining timestamped and audit-ready cap table records much earlier in their life cycle. This has shifted the decision from reactive cleanup after a financing event to proactive system adoption before issues emerge. Vendors that automate revaluation triggers at each new financing round reduce manual coordination and create stronger renewal logic for clients approaching exit. The equity management and cap table software market is therefore absorbing work that standalone valuation boutiques once handled outside the platform layer.
Migration From Spreadsheet Workflows to Cloud-Native Collaboration
The equity management and cap table software market is moving forward as issuers leave spreadsheet-based ownership records behind. Spreadsheet workflows create version-control errors, broken formulas, and unauthorized edits that often surface during due diligence, fundraising, or investor audit reviews. ZUZU documented recurring discrepancies among early-stage Korean companies that managed equity data in spreadsheets, which shows that the problem extends well beyond English-speaking startup ecosystems. Cloud-native tools address this with immutable audit trails, role-based permissions, and real-time cap table views for authorized users. Germany’s updated virtual share plan rules that took effect in January 2025, and China’s extension of Notice 35 through 2027, both favor structured digital records over manual files. The remaining migration pool is still large, because a meaningful share of private company ownership data continues to sit in unstructured files and legacy systems.
Restraints Impact Analysis*
| Restraint | (~) % Impact on CAGR Forecast | Geographic Relevance | Impact Timeline |
|---|---|---|---|
| Data Security and Privacy Concerns Around Shareholder Records | -2.2% | Global | Short term (≤ 2 years) |
| High Migration, Onboarding, and Ongoing Subscription Costs | -1.5% | North America, Europe | Medium term (2-4 years) |
| Cross-Border Tax and Securities Complexity for Mobile Employees | -0.9% | Asia-Pacific core, Europe | Long term (≥ 4 years) |
| Secondary Sale Events Forcing Mid-Cycle Valuation Refreshes | -0.6% | North America | Medium term (2-4 years) |
| Source: Mordor Intelligence | |||
Data Security and Privacy Concerns Around Shareholder Records
The equity management and cap table software market still faces a major trust barrier at the data-security layer. Cap table platforms store beneficial ownership records, vesting schedules, strike prices, and secondary transaction histories, which makes them highly sensitive systems for issuers and investors. The 2024 LockBit ransomware attack on Evolve Bank’s infrastructure exposed 33 terabytes of fintech partner data, showing that infrastructure-level breaches can compromise equity records across a wider vendor ecosystem. A separate breach incident at Finastra in November 2024 reinforced buyer concern around third-party data pipelines that often connect cap table software with banking and payroll systems. SOC 2 Type II controls and GDPR Article 32 readiness have become baseline procurement requirements, which raises operating costs for smaller vendors. The equity management and cap table software market feels this restraint most clearly in the mid-market, where buyers understand the risk but do not always have the budget to select only the most established providers.
High Migration, Onboarding, and Ongoing Subscription Costs
The equity management and cap table software market also faces friction from long migrations and high first-year costs. Moving from spreadsheets or legacy systems into a cloud-native platform requires historical issuance checks, certificate reconciliation, and retraining across legal and finance teams, and this often stretches over 3 to 6 months for issuers with more than 500 stakeholders. Enterprise subscriptions can reach 6-figure USD levels each year, and professional services can add another 30% to 50% to first-year ownership cost for complex transitions. Smaller vendors have responded with free-tier products, but these products often lack the ASC 718 reporting depth and multi-class share support that auditors expect once a company reaches Series B and later stages. That creates a capability gap that forces some mid-market firms into a second migration at the same time their internal teams are already under pressure. The cost burden is especially visible in South America, Africa, and Southeast Asia, where venture deal sizes remain smaller and willingness to pay for premium tooling trails the compliance need by 2 to 3 years.
*Our forecasts treat driver/restraint impacts as directional, not additive. The impact forecasts reflect baseline growth, mix effects, and variable interactions.
Segment Analysis
By Component: Services are Expanding Within a Software-Led Revenue Model
Software retained 74.86% of component revenue in 2025, which kept software as the largest revenue pool in the equity management and cap table software market. Services are projected to grow at a 15.24% CAGR through 2031, which is faster than the overall market and reflects rising demand for implementation, 409A support, secondary transaction advice, and compliance assistance. This split shows that recurring subscriptions still anchor vendor economics, but customer needs are widening as funding rounds, stakeholder counts, and jurisdictional requirements increase. J.P. Morgan Workplace Solutions reported in 2024 that 63% of public companies outsourced equity plan administration to specialized platforms, and that behavior is now moving into growth-stage private companies seeking more formal processes.[2]J.P. Morgan Workplace Solutions, “Trends in Equity Compensation 2024,” J.P. Morgan, jpmorgan.com
Software accounted for 74.86% share of the equity management and cap table software market size in 2025, but services are becoming more important as platforms absorb valuation and compliance work that once sat outside the core product. AI-enabled 409A workflows are contributing to that shift because they reduce reliance on separate advisory engagements and pull more revenue into the platform layer. Vendors that bundle software, implementation, valuation support, and compliance help within one contract are retaining clients more effectively through the pre-IPO period. The equity management and cap table software industry rewards integrated providers more than point solutions when client complexity rises.


By Deployment Mode: Cloud Leads, but Compliance Keeps Hybrid Demand Intact
Cloud-based deployments accounted for 72.42% of revenue in 2025, and they are projected to grow at a 14.88% CAGR through 2031, which keeps cloud as the lead architecture in the equity management and cap table software market. SaaS pricing aligns better with funding milestones than capital spending cycles, which makes browser-based tools easier for startups and growth companies to adopt. On-premises and private-cloud installations still matter for Chinese state-affiliated enterprises and some European financial institutions, where shareholder data must remain within domestic or regional infrastructure boundaries. That means deployment is not only a technology decision, it is also a compliance and procurement decision.
Cloud-based tools represented 72.42% of the equity management and cap table software market size in 2025, yet localization and data-residency needs continue to protect a niche for alternative architectures. South Korea’s ZUZU and Japan’s Smartround show that locally built cloud platforms can win early-stage accounts by supporting domestic language, document format, and workflow requirements. European issuers with multi-country equity plans make similar choices when they evaluate where ownership data is stored and processed. The equity management and cap table software industry gives an edge to vendors that can support cloud, private-cloud, and on-premises options through one management layer.
By Enterprise Size: SME Adoption is Broadening the Addressable Base
Large enterprises held 73.64% of revenue in 2025, which gave them the biggest role in current demand across the equity management and cap table software market. SMEs are forecast to grow at a 15.76% CAGR through 2031, because template-led onboarding and free-tier entry products have reduced implementation time and upfront commitment. Large organizations still need deeper functionality for multi-class shares, ASC 718 reporting, and equity programs that span widely distributed workforces. That keeps present revenue weighted toward larger issuers, even as newer vendors bring smaller companies into the category earlier.
SMEs are the fastest-growing cohort in the equity management and cap table software market, and that shift is being reinforced by public policy as well as product design. The U.S. Department of Labor outlined SECURE 2.0 ESOP provisions for 2025, and the National Center for Employee Ownership noted that USD 50 million in grants through 2029 are intended to lower ESOP formation costs for small businesses. Smartround’s data showing average startup option pools near 9.3% of capitalization at IPO in Japan, versus 15% to 20% that is typical in the United States, points to room for broader equity use across Asia-Pacific as governance norms evolve. The equity management and cap table software industry is likely to favor vendors that let SMEs activate more features over time instead of forcing a full migration at the mid-market stage.
By End User: Demand is Moving Beyond Private Issuers Alone
Private companies represented 51.74% of end-user revenue in 2025, which kept them as the main demand anchor in the equity management and cap table software market. Venture capital and private equity firms are projected to grow at a 15.62% CAGR through 2031, because they increasingly want portfolio dashboards, LP reporting automation, and waterfall modeling in the same environment. This broadens the buyer base beyond issuers and pushes vendors to serve both company-level administration and fund-level oversight. The result is a platform category that now reaches across incorporation, financing, compensation, liquidity, and investor reporting.
Private companies held 51.74% of the equity management and cap table software market share in 2025, but fund managers are becoming a more strategic growth engine as vendor capability expands. Qapita’s USD 26.5 million Series B funding in October 2025, backed by Charles Schwab, showed how strongly future product development is now tied to institutional portfolio-management needs. Public companies still favor audit-ready reporting and integrations with transfer agents and stock-plan administrators, while law firms, accounting firms, and M&A advisers are increasingly using platform access as an added service within broader retainers. The equity management and cap table software market is moving beyond the startup heartland and into adjacent financial workflows.
Geography Analysis
North America held 41.42% of the equity management and cap table software market share in 2025, which made it the largest regional base. The United States remains the core demand center in the equity management and cap table software market because Section 409A, Regulation S-K, and ASC 718 make structured ownership records and equity expense reporting difficult to manage outside a dedicated platform. Canada adds to that backdrop through a CAD 10 million (USD 7.4 million) employee ownership trust tax exemption, which expands the ESOP-adjacent opportunity in the region.[3]National Center for Employee Ownership, “Expanding Employee Ownership Models, UK, France, Canada,” National Center for Employee Ownership, nceo.org Europe follows as a high-compliance but more fragmented region, supported by the United Kingdom’s more than 1,800 registered Employee Ownership Trusts, Germany’s January 2025 virtual share plan reform, and France’s EUR 70 billion employee savings framework, equivalent to USD 75.7 billion. GDPR Article 32 requirements continue to favor vendors with documented EU-hosted infrastructure and stronger procurement readiness.
Asia-Pacific is projected to grow at a 16.41% CAGR through 2031, making it the fastest-growing region in the equity management and cap table software market. India accounted for 49% of Asian startup formations in 2025, and listed Indian companies reported INR 15,000 crore in ESOP expenses in FY 2025, equivalent to USD 1.79 billion, up 30% year over year. That combination is creating a larger installed base for SEBI-aligned equity administration tools across the region. China still supports a parallel path, where domestic vendors serve state-affiliated enterprises through on-premises setups that match data-localization rules and the extension of Notice 35 through 2027. Japan and South Korea also show why local product design matters in the equity management and cap table software market, because Smartround and ZUZU have won early-stage adoption with native-language records and domestic workflow support.
South America, the Middle East, and Africa remained the smallest regional pools in 2025, but each is adding new demand within the equity management and cap table software market. Brazil is seeing pressure for more structured ESOP and disclosure workflows as its startup base deepens, while the United Arab Emirates and Saudi Arabia are generating new issuer demand through company formation programs linked to Vision 2030. South Africa and Nigeria are leading African activity as international venture investors bring stricter diligence expectations into local financing processes. The near-term revenue opportunity in these regions remains concentrated in enterprise and VC-adjacent users, because founder willingness to pay for premium tooling still trails the compliance burden by 2 to 3 years.

Competitive Landscape
The equity management and cap table software market is moderately concentrated at the top, with Carta holding the clearest multi-product position across cap table management, 409A valuations, fund administration, and legal-compliance workflows. By May 2026, Carta Law was serving more than 200 asset managers overseeing USD 15 trillion or more in combined assets under management, demonstrating how far the company has expanded beyond startup administration. Carta reinforced that position with 3 acquisitions between October 2025 and May 2026: Accelex for AI data automation, ListAlpha for fund CRM, and Avantia for legal workflow automation. Those deals deepen switching costs by connecting issuer records, investor relations, LP reporting, and compliance workflows within a single product family. The equity management and cap table software market, therefore, rewards scale where one vendor can replace several specialized tools.
Outside the leader, the equity management and cap table software market breaks into regional specialists such as Qapita in Southeast Asia and India, Ledgy across continental Europe, Vestd in the United Kingdom, and domestic vendors in Japan, South Korea, and China. Their position rests on local compliance formats, native-language support, and deployment choices that global providers still cover only in part. Eqvista’s 2026 patent application for Real-Time Company Valuation® shows that smaller platforms are also investing in differentiated workflow IP, especially around valuation and continuous monitoring. This keeps innovation active even as larger vendors pursue consolidation. It also means buyers often choose between breadth and localization rather than comparing identical products.
White-space in the equity management and cap table software market is strongest around employee ownership programs, secondary liquidity infrastructure, and AI-enabled scenario modeling within financing workflows. Ledgy’s November 2025 partnership with JP Jenkins, Carta’s September 2025 collaboration with Morgan Stanley, and Mainstreet Technology’s October 2025 acquisition of Capbase with a Deel partnership all show that vendors are expanding beyond core recordkeeping into liquidity, advisory, and global employment workflows. Easop and Mantle are approaching the same opportunity from payroll and employer-of-record angles, which could divert some new company subscriptions away from standalone cap table vendors. The equity management and cap table software market remains open enough for regional and workflow-led challengers, even though the leading platforms continue to widen their product reach.
Equity Management and Cap Table Software Industry Leaders
Carta, Inc.
Ledgy AG
Qapita Fintech Pte. Ltd.
Prolific Labs Incorporated
Eqvista Inc.
- *Disclaimer: Major Players sorted in no particular order

Recent Industry Developments
- March 2026: Carta acquires Avantia to launch Carta Law, an AI-powered legal and compliance platform serving more than 200 asset managers overseeing USD 15 trillion or more in combined assets under management. The acquisition extends Carta's addressable market well beyond its startup-focused cap table base into institutional legal workflow automation.
- March 2026: Carta acquires ListAlpha to establish Carta CRM, integrating deal-sourcing relationship-management capabilities for its network of more than 9,000 funds overseeing USD 203 billion in assets. The move enables cross-product data flows between fund investor relations and cap table management within a single platform.
- October 2025: Qapita closed a USD 26.5 million Series B funding round led by Charles Schwab, which simultaneously launched Schwab Private Issuer Equity Services. The investment enabled Qapita's entry into the US private-company market, positioning it to compete directly with Carta in the VC-backed issuer segment.
- October 2025: Mainstreet Technology acquired Capbase and announced a concurrent strategic partnership with Deel, combining company formation, payroll, and equity administration within a single workflow for globally distributed teams. The transaction created a direct challenger to modular equity-administration platforms in the sub-Series-A market segment.


Global Equity Management and Cap Table Software Market Report Scope
The equity management and cap table software market refers to the global market for software platforms and associated services designed to manage, track, administer, and optimize company ownership structures, equity securities, shareholder records, and capitalization tables across private and public organizations. These platforms enable businesses to digitally manage equity issuance, stock option plans, employee ownership programs, fundraising events, valuation workflows, compliance reporting, and investor stakeholder records through centralized and audit-ready systems.
The Equity Management and Cap Table Software Market Report is Segmented by Component (Software, and Services), Deployment Mode (Cloud-Based, and On-Premises), Enterprise Size (SMEs, and Large Enterprises), End User (Private Companies, Venture Capital and Private Equity Firms, Public Companies, Advisory and Professional Services Firms, and Other End Users), and Geography (North America, South America, Europe, Asia-Pacific, Middle East, and Africa). The Market Forecasts Are Provided in Terms of Value (USD).
| Software |
| Services |
| Cloud-Based |
| On-Premises |
| Small and Medium-Sized Enterprises |
| Large Enterprises |
| Private Companies |
| Venture Capital and Private Equity Firms |
| Public Companies |
| Advisory and Professional Services Firms |
| Other End Users |
| North America | United States |
| Canada | |
| Mexico | |
| South America | Brazil |
| Argentina | |
| Rest of South America | |
| Europe | Germany |
| United Kingdom | |
| France | |
| Italy | |
| Spain | |
| Russia | |
| Rest of Europe | |
| Asia-Pacific | China |
| Japan | |
| India | |
| South Korea | |
| Australia and New Zealand | |
| Rest of Asia-Pacific | |
| Middle East | Saudi Arabia |
| United Arab Emirates | |
| Turkey | |
| Rest of Middle East | |
| Africa | South Africa |
| Egypt | |
| Nigeria | |
| Rest of Africa |
| By Component | Software | |
| Services | ||
| By Deployment Mode | Cloud-Based | |
| On-Premises | ||
| By Enterprise Size | Small and Medium-Sized Enterprises | |
| Large Enterprises | ||
| By End User | Private Companies | |
| Venture Capital and Private Equity Firms | ||
| Public Companies | ||
| Advisory and Professional Services Firms | ||
| Other End Users | ||
| By Geography | North America | United States |
| Canada | ||
| Mexico | ||
| South America | Brazil | |
| Argentina | ||
| Rest of South America | ||
| Europe | Germany | |
| United Kingdom | ||
| France | ||
| Italy | ||
| Spain | ||
| Russia | ||
| Rest of Europe | ||
| Asia-Pacific | China | |
| Japan | ||
| India | ||
| South Korea | ||
| Australia and New Zealand | ||
| Rest of Asia-Pacific | ||
| Middle East | Saudi Arabia | |
| United Arab Emirates | ||
| Turkey | ||
| Rest of Middle East | ||
| Africa | South Africa | |
| Egypt | ||
| Nigeria | ||
| Rest of Africa | ||


Key Questions Answered in the Report
What is the expected value of the equity management and cap table software market by 2031?
The equity management and cap table software market is forecast to reach USD 4.11 billion by 2031, rising from USD 2.08 billion in 2026 at a CAGR of 14.59%.
Why are private companies still the main buyers of cap table and equity management platforms?
Private companies accounted for 51.74% of end-user revenue in 2025 because they face continuous equity events such as funding rounds, option grants, secondary sales, and valuation updates from an early stage.
Why is Asia-Pacific growing faster than other regions?
Asia-Pacific is projected to grow at a 16.41% CAGR through 2031, supported by India’s 49% share of Asian startup formations in 2025 and broader ESOP adoption across the region.
How important is cloud deployment in this space?
Cloud-based deployments held 72.42% of revenue in 2025 and are expected to grow at a 14.88% CAGR through 2031 because SaaS pricing and browser-based access fit startup and growth-company workflows well.
What is driving faster adoption among SMEs?
SMEs are forecast to expand at a 15.76% CAGR through 2031 as template-based onboarding, free-tier entry products, and ESOP support programs reduce early implementation friction.
What are the biggest barriers to wider adoption?
Data-security concerns and migration costs remain the main constraints, especially for mid-market buyers that need strong controls but may not have the budget for top-tier vendors or long onboarding projects.
Page last updated on:


