Inventory Optimization Software Market Size and Share
Market Overview
| Study Period | 2020 - 2031 |
|---|---|
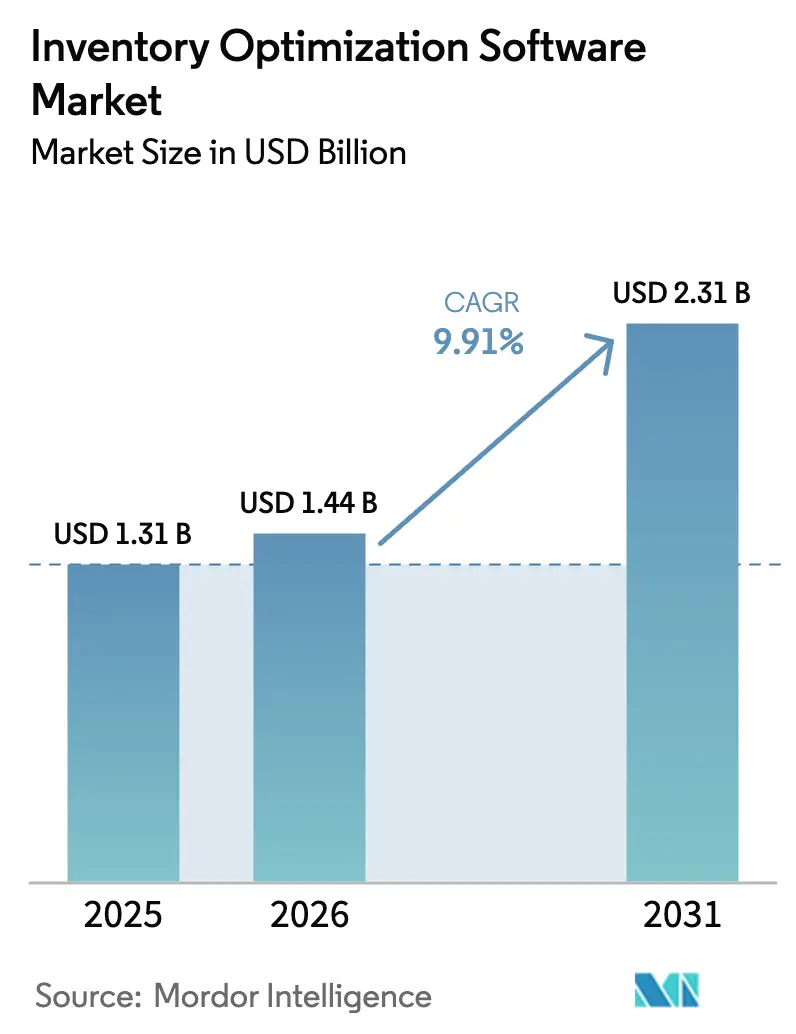
| Market Size (2026) | USD 1.44 Billion |
| Market Size (2031) | USD 2.31 Billion |
| Growth Rate (2026 - 2031) | 9.91% CAGR |
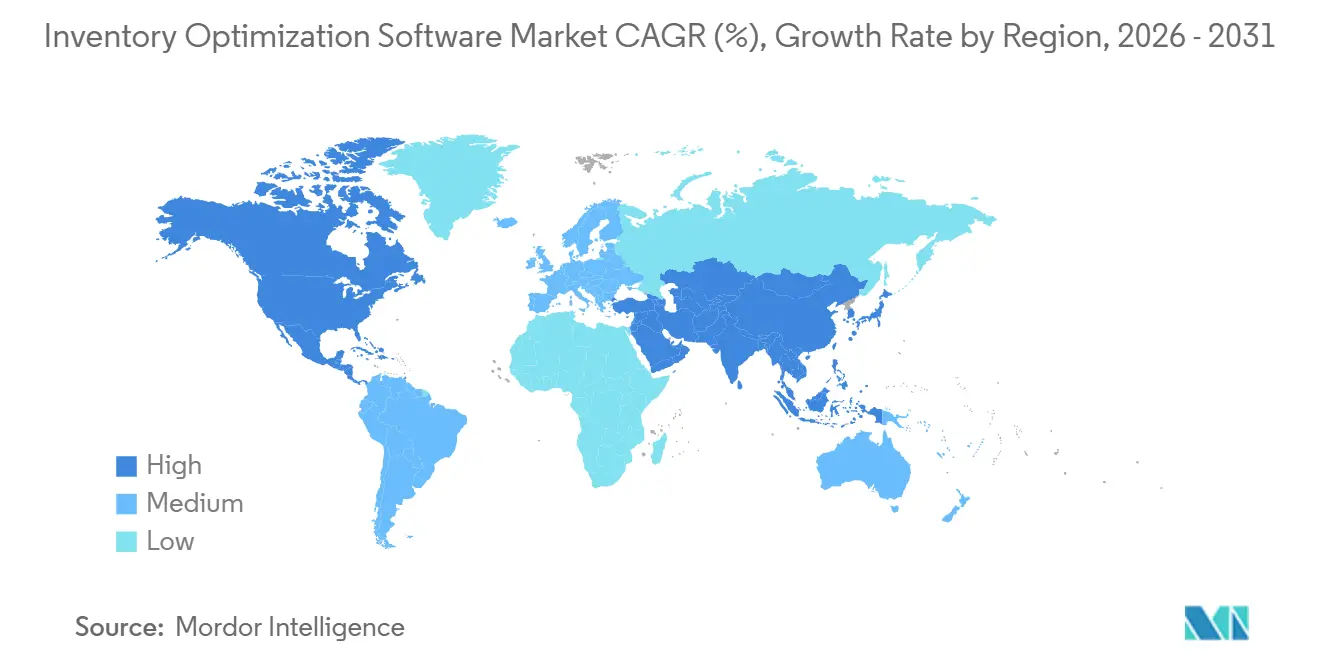
| Fastest Growing Market | Asia Pacific |
| Largest Market | North America |
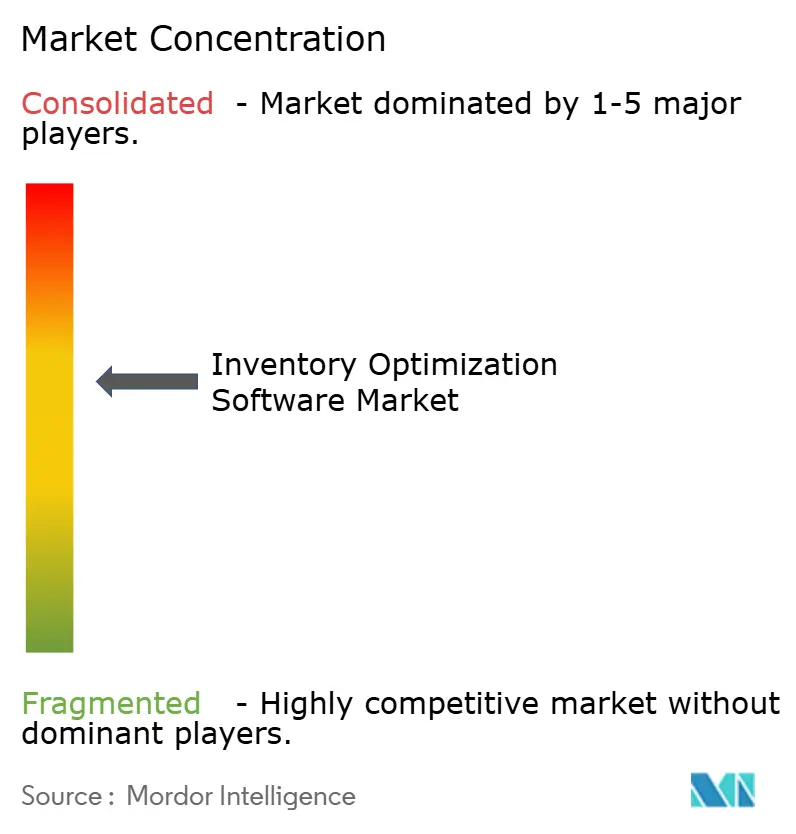
| Market Concentration | Medium |
Major Players *Disclaimer: Major Players sorted in no particular order Image © Mordor Intelligence. Reuse requires attribution under CC BY 4.0. | |
Inventory Optimization Software Market Analysis by Mordor Intelligence
The inventory optimization software market is projected to grow from USD 1.31 billion in 2025 to USD 1.44 billion in 2026 and reach USD 2.31 billion by 2031, at a CAGR of 9.91% from 2026 to 2031, driven by a structural shift toward balancing working-capital efficiency with higher service-level commitments. Adoption is accelerating due to cloud-native deployments that shorten implementation cycles, increased use of generative AI for scenario modeling, and sustainability-linked financing that positions lean inventory as an ESG lever. Enterprises are prioritizing network-wide optimization and managed services to ensure data quality, user adoption, and continuous model calibration, while procurement trends reflect stronger uptake in complex, regulated supply chains, alongside growing adoption among small and medium enterprises enabled by flexible pricing models. Ongoing supply chain digitization and supplier integration initiatives across key manufacturing and export hubs support regional growth. Competitive intensity is rising as enterprise platforms embed optimization capabilities, while specialized vendors differentiate through domain-specific algorithms and real-time decisioning. Despite risks related to data integrity and cybersecurity, the transition toward continuous, event-driven planning systems remains structurally irreversible.
Key Report Takeaways
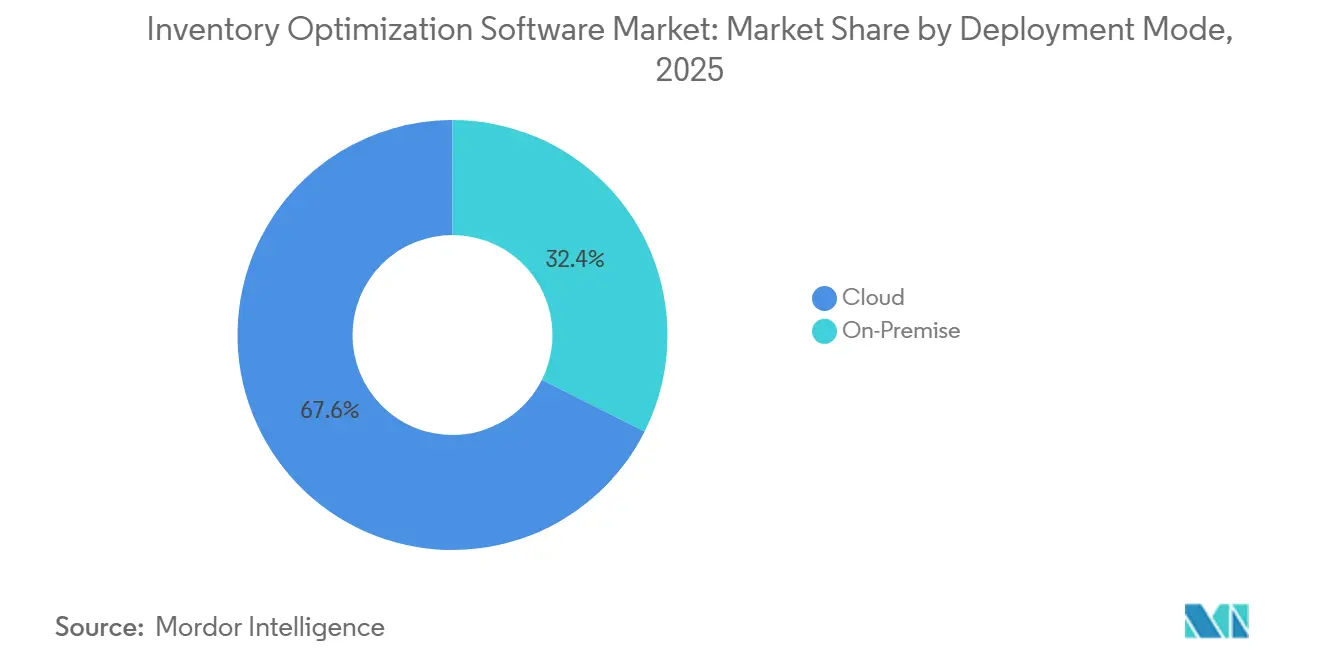
- By deployment mode, cloud solutions captured 67.89% of the inventory optimization software market share in 2025, while on-premises alternatives trailed with a slower 6.2% CAGR through 2031.
- By application, demand forecasting led with 33.98% of revenue in 2025, but multi-echelon optimization is advancing at a 10.71% CAGR to 2031.
- By component, software accounted for 61.12% of revenue in 2025, whereas services are growing at a 10.57% CAGR through 2031.
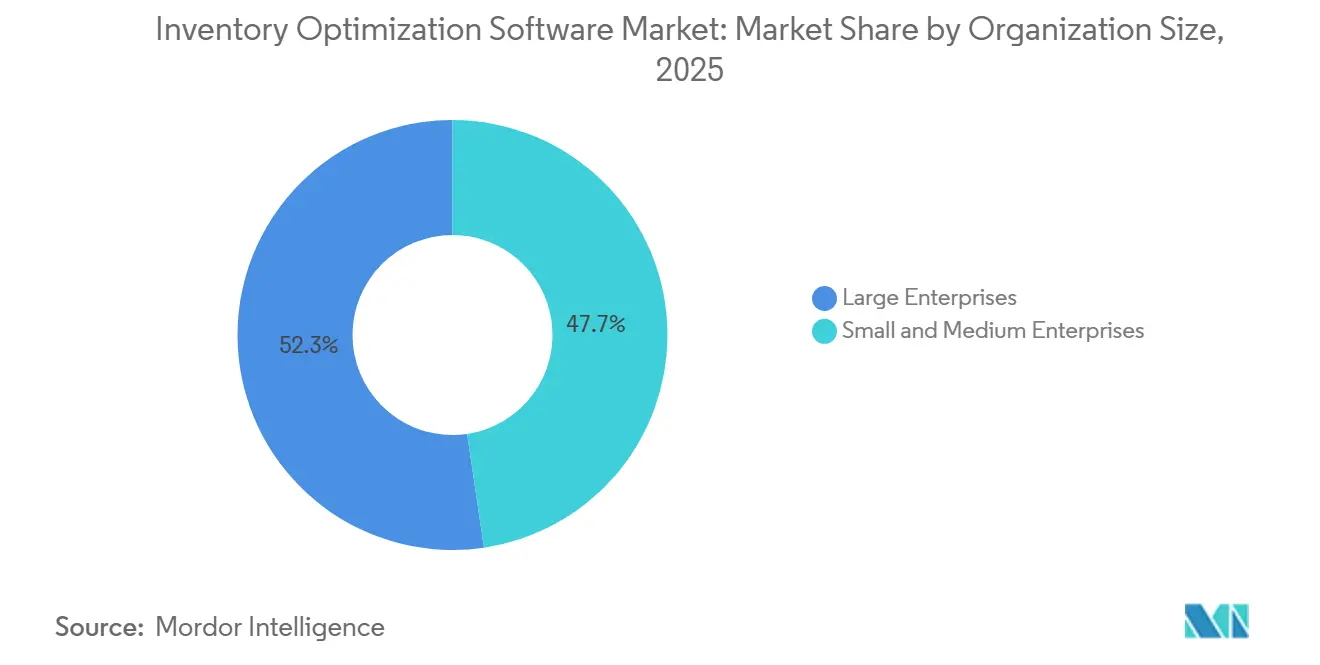
- By organization size, small and medium enterprises represented 47.66% of 2025 revenue and are growing at 10.38%, overtaking large-enterprise growth by 130 basis points.
- By industry vertical, healthcare and pharmaceuticals achieved 11.11% CAGR, the fastest among all end-user segments, while retail and e-commerce retained the largest 2025 revenue share at 29.77%.
- By geography, North America accounted for 36.48% of revenue in 2025, and Asia-Pacific is forecast to lead growth at a 10.01% CAGR through 2031.
Note: Market size and forecast figures in this report are generated using Mordor Intelligence’s proprietary estimation framework, updated with the latest available data and insights as of January 2026.
Global Inventory Optimization Software Market Trends and Insights
Drivers Impact Analysis*
| Driver | (~) % Impact on CAGR Forecast | Geographic Relevance | Impact Timeline |
|---|---|---|---|
| Cloud-Native SaaS Adoption Among Mid-Market Retailers | +2.1% | North America, Europe, expanding global | Medium term (2-4 years) |
| AI-Driven Dynamic Re-Ordering for Omni-Channel Fulfilment | +1.8% | North America, Europe, Asia-Pacific urban centers | Short term (≤2 years) |
| Direct-to-Consumer Brand Expansion Requiring Inventory Agility | +1.5% | North America, Europe, emerging South America | Medium term (2-4 years) |
| Real-Time IoT Data Integration Reducing Safety Stock Levels | +1.3% | Asia-Pacific manufacturing hubs, North America | Long term (≥4 years) |
| GenAI-Powered Scenario Planning Tools | +1.2% | Global, early in North America and Europe | Short term (≤2 years) |
| Sustainability-Linked Inventory Financing Incentives | +0.9% | Europe, expanding to Asia-Pacific | Long term (≥4 years) |
| Source: Mordor Intelligence | |||
Cloud-Native SaaS Adoption Among Mid-Market Retailers
Cloud deployment significantly reduces infrastructure costs by shifting capital expenditures to operating expenses while enabling automated software and algorithm updates. Mid-sized grocery and apparel retailers increasingly connect real-time point-of-sale data streams with cloud-based planning engines, allowing demand forecasts to refresh multiple times per hour rather than relying on traditional weekly batch processing. This real-time capability improves responsiveness to demand fluctuations and promotional activity. During the 2024 holiday season, several North American retailers using cloud-native replenishment systems dynamically reallocated inventory across distribution centers within six hours, helping prevent stockouts on high-demand products and improving overall supply chain agility during peak retail periods.[1]Technology Desk, “AI Applications in Retail Inventory Management,” Financial Times, ft.com
AI-Driven Dynamic Re-Ordering for Omni-Channel Fulfilment
Machine learning models increasingly incorporate variables such as weather patterns, local events, and competitor pricing to forecast store-day-item demand more accurately. These models automatically trigger replenishment decisions that balance delivery speed, freight costs, and inventory holding expenses. In one European grocery deployment, the introduction of AI-driven automated reordering reduced safety stock by approximately 18% while improving on-shelf product availability by about 3% in 2025.[2]Editorial Board, “Supply Chain Digitization and Geopolitical Risk Mitigation,” Financial Times, ft.com Continuous feedback from these systems also identifies supplier variability, enabling retailers to renegotiate service-level agreements more rapidly and improve supply chain reliability.
Direct-to-Consumer Brand Expansion Requiring Inventory Agility
High-velocity product launches and influencer-driven demand surges are forcing direct-to-consumer companies to move beyond static inventory policies toward probabilistic forecasting and multi-node inventory optimization. These systems analyze real-time demand signals and dynamically adjust stock positioning across distribution networks. For example, a North American athletic apparel brand reduced holding costs by 22% and shortened average lead time by 1.5 days in 2025 after implementing network-wide inventory rebalancing. By strategically positioning fast-moving products closer to high-demand markets while consolidating slower-moving inventory at centralized hubs, companies improve fulfillment speed, reduce logistics costs, and maintain better service levels during unpredictable demand spikes.
Real-Time IoT Data Integration Reducing Safety Stock Levels
Sensors embedded in pallets and containers continuously transmit location, temperature, and handling conditions, giving supply chain platforms real-time visibility into shipment status. This data enables optimization algorithms to delay replenishment decisions until genuine delays occur, rather than maintaining conservative lead-time buffers. By relying on live operational signals rather than static assumptions, organizations can operate with leaner inventory levels while maintaining high service reliability. For example, a pharmaceutical distributor released USD 28 million in working capital by reducing safety stock by 14% while sustaining 99.2% service levels in 2025. Continuous telemetry streams also feed machine-learning models that progressively refine lead-time distributions, improve forecasting accuracy, and strengthen resilience against disruptions across complex global supply chains.
Restraints Impact Analysis*
| Restraint | (~) % Impact on CAGR Forecast | Geographic Relevance | Impact Timeline |
|---|---|---|---|
| Limited Data Quality in Legacy ERP Installations | -0.8% | Global, acute in manufacturing-heavy regions | Medium term (2-4 years) |
| Cyber-Security Concerns Around API-Based Ecosystems | -0.6% | North America, Europe | Short term (≤2 years) |
| High Total Cost of Ownership for Best-of-Breed Suites | -0.5% | Global, especially mid-market organizations | Medium term (2-4 years) |
| Shortage of Qualified Supply-Chain Data Scientists | -0.4% | Global, most severe in Asia-Pacific and South America | Long term (≥4 years) |
| Source: Mordor Intelligence | |||
Limited Data Quality in Legacy ERP Installations
Duplicate item codes, inconsistent product descriptions, and mismatched units of measure frequently undermine the quality of historical enterprise resource planning data, limiting the effectiveness of inventory optimization engines that depend on accurate inputs. In many organizations, fragmented master data across procurement, warehousing, and sales systems creates discrepancies that must be resolved before advanced analytics can function reliably. As a result, companies often allocate 30% to 40% of total project budgets to data cleansing, normalization, and governance initiatives. These remediation efforts extend implementation timelines and can erode confidence among planners who rely on accurate forecasts for operational decisions. A 2025 manufacturing survey found that 58% of optimization projects exceeded planned timelines by 6 months or more, primarily due to delays in resolving data quality issues and integrating legacy datasets.
Cyber-Security Concerns Around API-Based Ecosystems
Composable supply chain technology stacks introduce multiple integration points across planning, execution, and analytics systems, significantly expanding the potential attack surface for cybersecurity threats. As organizations connect inventory optimization platforms with transportation management systems, warehouse management systems, and third-party logistics providers, the number of data exchange interfaces increases substantially. Security incidents involving logistics providers in 2024 and 2025 heightened industry concerns and triggered stricter vendor due diligence requirements. Many enterprise buyers now mandate certifications such as SOC 2 and ISO 27001 before approving software deployments. In response, organizations are adopting zero-trust security architectures to protect sensitive operational data. However, implementing these frameworks can raise deployment costs by approximately 15% to 20% and requires specialized cybersecurity expertise that many mid-market companies struggle to secure.
*Our forecasts treat driver/restraint impacts as directional, not additive. The impact forecasts reflect baseline growth, mix effects, and variable interactions.
Segment Analysis
By Deployment Mode: Cloud Dominance Accelerates
Cloud solutions accounted for 67.89% of the inventory optimization software market in 2025 and are projected to grow at a 10.31% CAGR through 2031. The adoption of cloud-based deployment models is driven by lower infrastructure costs, subscription-based pricing, and elastic computing capacity that supports complex planning workloads during peak demand periods. Cloud platforms allow organizations to deploy optimization solutions significantly faster than traditional on-premise systems, often reducing implementation timelines by several weeks. Vendors also leverage multi-tenant architectures to analyze anonymized operational data across customers, enabling benchmarking of performance metrics and the integration of best practices into software updates, thereby continuously improving forecasting accuracy and supply chain efficiency.
On-premise deployment models continue to persist in industries such as pharmaceuticals, defense, and financial services, where strict data-residency and security regulations limit full cloud adoption. However, advancements in technologies, including edge computing, FedRAMP-grade security certifications, and Kubernetes containerization, are gradually reducing these barriers. These technologies enable hybrid architectures where workloads can operate seamlessly across on-premise and cloud environments without major system redesign. Many organizations now run core optimization engines locally while leveraging cloud-based analytics platforms for visualization, collaboration, and advanced insights. As zero-trust security frameworks mature, public cloud providers are addressing regulatory concerns and accelerating migration among highly regulated enterprises.


By Component: Services Surge as Complexity Rises
Software licenses accounted for 61.12% of revenue in 2025 within the inventory optimization software market, yet services are expanding at a 10.57% annual rate as enterprises increasingly recognize that advanced algorithms alone cannot generate savings without effective implementation and operational change management. Many organizations lack internal data science capabilities, leading to growing demand for managed analytics and optimization-as-a-service models. Under shared-savings contracts, vendors assume partial performance risk, aligning incentives with measurable business outcomes. System integrators also play a critical role by embedding optimization platforms within broader digital transformation initiatives that include data governance frameworks, process redesign, and workforce training to accelerate time-to-value.
Service-led engagement models are strengthening long-term vendor relationships by providing continuous monitoring and operational support after initial deployment. Vendors increasingly deliver ongoing services such as key performance indicator tracking, automated anomaly detection, and periodic model recalibration to prevent forecasting degradation caused by macroeconomic shifts, supply disruptions, or assortment changes. These services help organizations maintain forecasting accuracy and supply chain stability over time. Additionally, the integration of conversational interfaces allows operational managers and domain specialists to interact with optimization models using natural language queries, expanding accessibility beyond technical teams and increasing reliance on subscription-based analytics and advisory services.
By Application: Multi-Echelon Optimization Gains Momentum
Demand forecasting accounted for 33.98% of revenue in the inventory optimization software market in 2025, reflecting its role as the foundational capability for inventory planning across industries. However, multi-echelon optimization is expanding at a 10.71% CAGR as enterprises increasingly pursue network-wide inventory minimization strategies. By optimizing stock placement across multiple distribution layers, organizations can significantly reduce excess inventory while maintaining service levels. For example, a North American auto-parts distributor reduced network stock by 19% and saved USD 6 million in freight costs after consolidating slow-moving products into centralized hubs. Modern platforms dynamically trigger stock transfers when imbalances occur, representing a major advancement beyond static replenishment approaches.
Production scheduling and replenishment planning modules continue to support demand forecasting, particularly in industries where manufacturing constraints, shelf life, or batch production influence inventory decisions. However, standalone replenishment solutions are losing momentum as vendors increasingly integrate them into comprehensive optimization suites that coordinate forecasting, inventory positioning, and supply chain execution. Retail and consumer packaged goods companies have found that improvements in forecast accuracy alone cannot deliver sustained inventory reductions without synchronized replenishment and network optimization capabilities. Healthcare organizations are also adopting expiry-aware algorithms that highlight near-expiration inventory, reducing product waste and regulatory risk while improving supply chain visibility and compliance.
By Organization Size: SMEs Embrace Consumption Pricing
Large enterprises accounted for 52.34% of revenue in the inventory optimization software market in 2025, reflecting their complex supply chains and capacity to invest in advanced analytics platforms. However, small and medium enterprises are expanding adoption at a faster pace, growing at a 10.38% rate as cloud-based pricing models lower entry barriers. Pay-per-use subscription plans starting near USD 1,500 per month allow smaller firms to access enterprise-grade optimization capabilities without significant upfront investment. Pre-configured industry templates have also shortened deployment timelines from approximately 6 months to around 6 weeks, enabling organizations to achieve inventory reductions of 12% to 16% within the first year.
While SMEs focus on rapid implementation and cost efficiency, multinational enterprises continue to demand unified supply chain platforms that integrate demand forecasting, inventory optimization, and sales and operations planning within a single data architecture. Vendors are responding with tiered licensing structures that allow smaller customers to gradually adopt additional capabilities as their operational maturity increases. Many SMEs initially implement replenishment optimization before expanding into scenario planning, risk management, and sustainability modules that measure carbon emissions across supply chains. This structured capability expansion creates long-term customer relationships and positions vendors to capture significant growth within the mid-market segment.
By Industry Vertical: Healthcare Leads Growth Amid Regulatory Complexity
Retail and e-commerce accounted for 29.77% of revenue in the inventory optimization software market in 2025, driven by the need to manage high product variety, fluctuating consumer demand, and rapid fulfillment expectations. However, the healthcare and pharmaceutical sectors are expanding at the fastest rate, with a 11.11% CAGR through 2031, as regulatory requirements and cold-chain logistics create new optimization challenges. Regulations such as the U.S. Drug Supply Chain Security Act require unit-level product traceability, while temperature-sensitive medicines demand continuous monitoring.[3]Regulatory News, “Drug Supply Chain Security Act,” U.S. Food and Drug Administration, fda.gov Advanced optimization algorithms match product expiry timelines with consumption patterns, helping healthcare organizations reduce waste and maintain compliance with strict regulatory standards.
Manufacturing continues to represent a significant share of adoption due to complex bills of materials, multi-stage production processes, and the need to manage work-in-process inventory efficiently. Consumer packaged goods companies integrate promotional calendars and seasonal demand signals into optimization platforms to better manage demand spikes during marketing campaigns. Automotive suppliers increasingly rely on real-time inventory planning tools to mitigate disruptions caused by semiconductor shortages and supplier delays. Logistics providers are also emerging as important adopters by offering multi-tenant optimization services to direct-to-consumer brands that lack internal supply chain systems, creating a rapidly growing service-oriented segment within the market.
Geography Analysis
North America accounted for 36.48% of revenue in the inventory optimization software market in 2025, driven by its mature retail and e-commerce ecosystems, alongside high cloud adoption rates. U.S. retailers increasingly deploy inventory optimization solutions to address challenges such as wage inflation and rising fulfillment costs. Meanwhile, Canadian distributors leverage cloud-based platforms to remain competitive against larger firms, and Mexican manufacturers integrate optimization tools into their nearshoring supply chain strategies to enhance efficiency and reduce costs.[4]Global Industry Desk, “Nearshoring and Mexico Supply Chain Trends,” Financial Times, ft.com
Asia-Pacific is the fastest-growing region, expanding at a 10.01% CAGR through 2031, as its manufacturing and digital commerce ecosystems continue to mature. Chinese manufacturers are integrating industrial Internet of Things (IIoT) data with optimization platforms to minimize finished goods buffers and manage rapid assortment turnover effectively. In India, tax reforms have encouraged warehouse consolidation, prompting distributors to adopt advanced technology solutions to streamline operations and improve inventory management.
Europe maintains a strong presence in the market due to stringent sustainability regulations and its advanced manufacturing networks. Countries like Germany, the United Kingdom, and France are at the forefront of adoption, as companies increasingly use inventory optimization tools to reduce operational costs while adhering to environmental reporting requirements. South America and the Middle East are emerging markets in this space, with countries such as Brazil, the United Arab Emirates, and Saudi Arabia making significant investments in digital supply chain infrastructure to modernize their operations and enhance competitiveness.

Competitive Landscape
The inventory optimization software market is moderately fragmented, with the top five vendors, Blue Yonder, Manhattan Associates, SAP, Oracle, and Kinaxis, controlling approximately 40% to 45% of global revenue. Large ERP vendors integrate optimization capabilities into broader enterprise platforms, allowing them to leverage extensive installed customer bases and cross-sell advanced supply chain solutions. Meanwhile, specialized vendors such as o9 Solutions, RELEX Solutions, and ToolsGroup compete by offering industry-specific algorithms, faster deployment cycles, and highly configurable optimization tools designed to deliver measurable operational improvements across retail, manufacturing, and distribution networks.
Composable architecture is reshaping competitive dynamics within the market. Enterprises increasingly deploy ERP platforms as the central data backbone while integrating specialized optimization engines through open APIsPIs and partner ecosystems. This modular procurement approach enables organizations to adopt best-of-breed solutions rather than relying on a single vendor stack, lowering switching barriers and increasing competitive pressure on vendors to deliver continuous innovation. As a result, providers are expanding interoperability capabilities, improving integration frameworks, and strengthening ecosystem partnerships to remain competitive in evolving enterprise technology environments.
Significant growth opportunities remain in mid-market SMEs, healthcare supply chains, and emerging markets across Asia-Pacific and South America, where digital supply chain adoption is still developing. Vendors are investing heavily in new capabilities such as generative AI for scenario planning, real-time optimization powered by sensor data, and sustainability analytics that measure carbon impact across supply networks. Patent activity in areas such as multi-echelon optimization and demand sensing has increased substantially, reflecting intensified competition and ongoing research aimed at improving forecasting accuracy and inventory decision intelligence.
Inventory Optimization Software Industry Leaders
Blue Yonder Group, Inc.
Manhattan Associates, Inc.
Kinaxis Inc.
E2open Parent Holdings, Inc.
o9 Solutions, Inc.
- *Disclaimer: Major Players sorted in no particular order

Recent Industry Developments
- March 2026: Blue Yonder committed USD 150 million to expand its Bangalore research hub, adding 500 engineers to embed generative AI into autonomous replenishment.
- January 2026: Manhattan Associates acquired Nextail Labs for USD 85 million, adding markdown optimization and size-curve forecasting to strengthen fashion retail coverage.
- December 2025: SAP launched Integrated Business Planning for Inventory Optimization inside S/4HANA Cloud, bundling multi-echelon algorithms with existing warehouse and transport modules.
- November 2025: o9 Solutions raised USD 200 million in Series D funding led by Blackstone Growth to scale Asia-Pacific expansion and sustainability-linked optimization.
- October 2025: RELEX Solutions opened a Tokyo development center, hiring 120 engineers to localize its platform for Japanese manufacturers and retailers.


Global Inventory Optimization Software Market Report Scope
The Inventory Optimization Software Market refers to software solutions that optimize inventory levels across supply chains by balancing demand variability, service level targets, and working capital efficiency. These solutions use advanced analytics and optimization algorithms to support demand forecasting, replenishment planning, multi-echelon inventory optimization, and production scheduling. They are deployed in cloud or on-premises models and used across industries to reduce stockouts, minimize excess inventory, lower carrying costs, and improve supply chain decision-making.
The Inventory Optimization Software Market Report is Segmented by Deployment Mode (Cloud, and On-Premise), Component (Software, and Services), Application (Demand Forecasting, Replenishment Planning, Multi-Echelon Optimization, and Production Scheduling), Organization Size (Large Enterprises, and Small and Medium Enterprises), Industry Vertical (Retail and E-commerce, Manufacturing, Consumer Packaged Goods, Healthcare and Pharmaceuticals, Automotive, and Logistics and 3PL), and Geography (North America, South America, Europe, Asia-Pacific, and Middle East and Africa). The Market Forecasts are Provided in Terms of Value (USD).
| Cloud |
| On-Premise |
| Software |
| Services |
| Demand Forecasting |
| Replenishment Planning |
| Multi-Echelon Optmization |
| Production Scheduling |
| Large Enterprises |
| Small and Medium Enterprises |
| Retail and E-commerc |
| Manufacturing |
| Consumer Packaged Goods |
| Healthcare and Pharmaceuticals |
| Automotive |
| Logistics and 3PL |
| North America | United States | |
| Canada | ||
| Mexico | ||
| South America | Brazil | |
| Argentina | ||
| Rest of South America | ||
| Europe | United Kingdom | |
| Germany | ||
| France | ||
| Italy | ||
| Spain | ||
| Rest of Europe | ||
| Asia-Pacific | China | |
| Japan | ||
| India | ||
| South Korea | ||
| Rest of Asia-Pacific | ||
| Middle East and Africa | Middle East | United Arab Emirates |
| Saudi Arabia | ||
| Rest of Middle East | ||
| Africa | South Africa | |
| Egypt | ||
| Rest of Africa | ||
| By Deployment Mode | Cloud | ||
| On-Premise | |||
| By Component | Software | ||
| Services | |||
| By Application | Demand Forecasting | ||
| Replenishment Planning | |||
| Multi-Echelon Optmization | |||
| Production Scheduling | |||
| By Organization Size | Large Enterprises | ||
| Small and Medium Enterprises | |||
| By Industry Vertical | Retail and E-commerc | ||
| Manufacturing | |||
| Consumer Packaged Goods | |||
| Healthcare and Pharmaceuticals | |||
| Automotive | |||
| Logistics and 3PL | |||
| By Geography | North America | United States | |
| Canada | |||
| Mexico | |||
| South America | Brazil | ||
| Argentina | |||
| Rest of South America | |||
| Europe | United Kingdom | ||
| Germany | |||
| France | |||
| Italy | |||
| Spain | |||
| Rest of Europe | |||
| Asia-Pacific | China | ||
| Japan | |||
| India | |||
| South Korea | |||
| Rest of Asia-Pacific | |||
| Middle East and Africa | Middle East | United Arab Emirates | |
| Saudi Arabia | |||
| Rest of Middle East | |||
| Africa | South Africa | ||
| Egypt | |||
| Rest of Africa | |||


Key Questions Answered in the Report
What is the projected revenue for inventory optimization software in 2031?
Forecasts place revenue at USD 2.31 billion by 2031, reflecting a 9.91% CAGR from 2026.
Which deployment mode is growing fastest?
Cloud deployments are rising 10.31% annually as buyers favor rapid go-live and elastic compute.
Why is multi-echelon optimization gaining popularity?
Enterprises seek network-wide inventory positioning that cuts working capital while boosting service levels, driving a 10.71% CAGR for the application.
How are small and medium enterprises funding adoption?
Consumption-based SaaS pricing starting near USD 1,500 per month removes large upfront fees, enabling 10.38% annual growth among SMEs.
Which region will lead future growth?
Asia-Pacific posts the strongest 10.01% CAGR, powered by manufacturing digitization and carbon-disclosure compliance.
What security measures are buyers demanding?
Enterprises mandate zero-trust architectures, SOC 2 and ISO 27001 certifications, adding 15%-20% to implementation timelines for new platforms.
Page last updated on:


