
Technology, Media and Telecom
5th MayPricing Strategy for Semiconductor Components
3 Min Read
The Risk Management Software Market is Segmented by Component (Software, Services), by Deployment (Cloud, On-Premises), by End-User Enterprise Size (SMEs, Large Enterprises), End-User Industry (BFSI, IT and Telecom, Government, Manufacturing, Healthcare, and More), Risk Type (Operational Risk, Cybersecurity Risk, and More), and Geography. The Market Forecasts are Provided in Terms of Value (USD).
Market Overview
| Study Period | 2020 - 2031 |
|---|---|
| Market Size (2026) | USD 15.21 Billion |
| Market Size (2031) | USD 32.72 Billion |
| Growth Rate (2026 - 2031) | 16.55 % CAGR |
| Fastest Growing Market | Asia Pacific |
| Largest Market | North America |
| Market Concentration | Medium |
Major Players *Disclaimer: Major Players sorted in no particular order. Image © Mordor Intelligence. Reuse requires attribution under CC BY 4.0. |
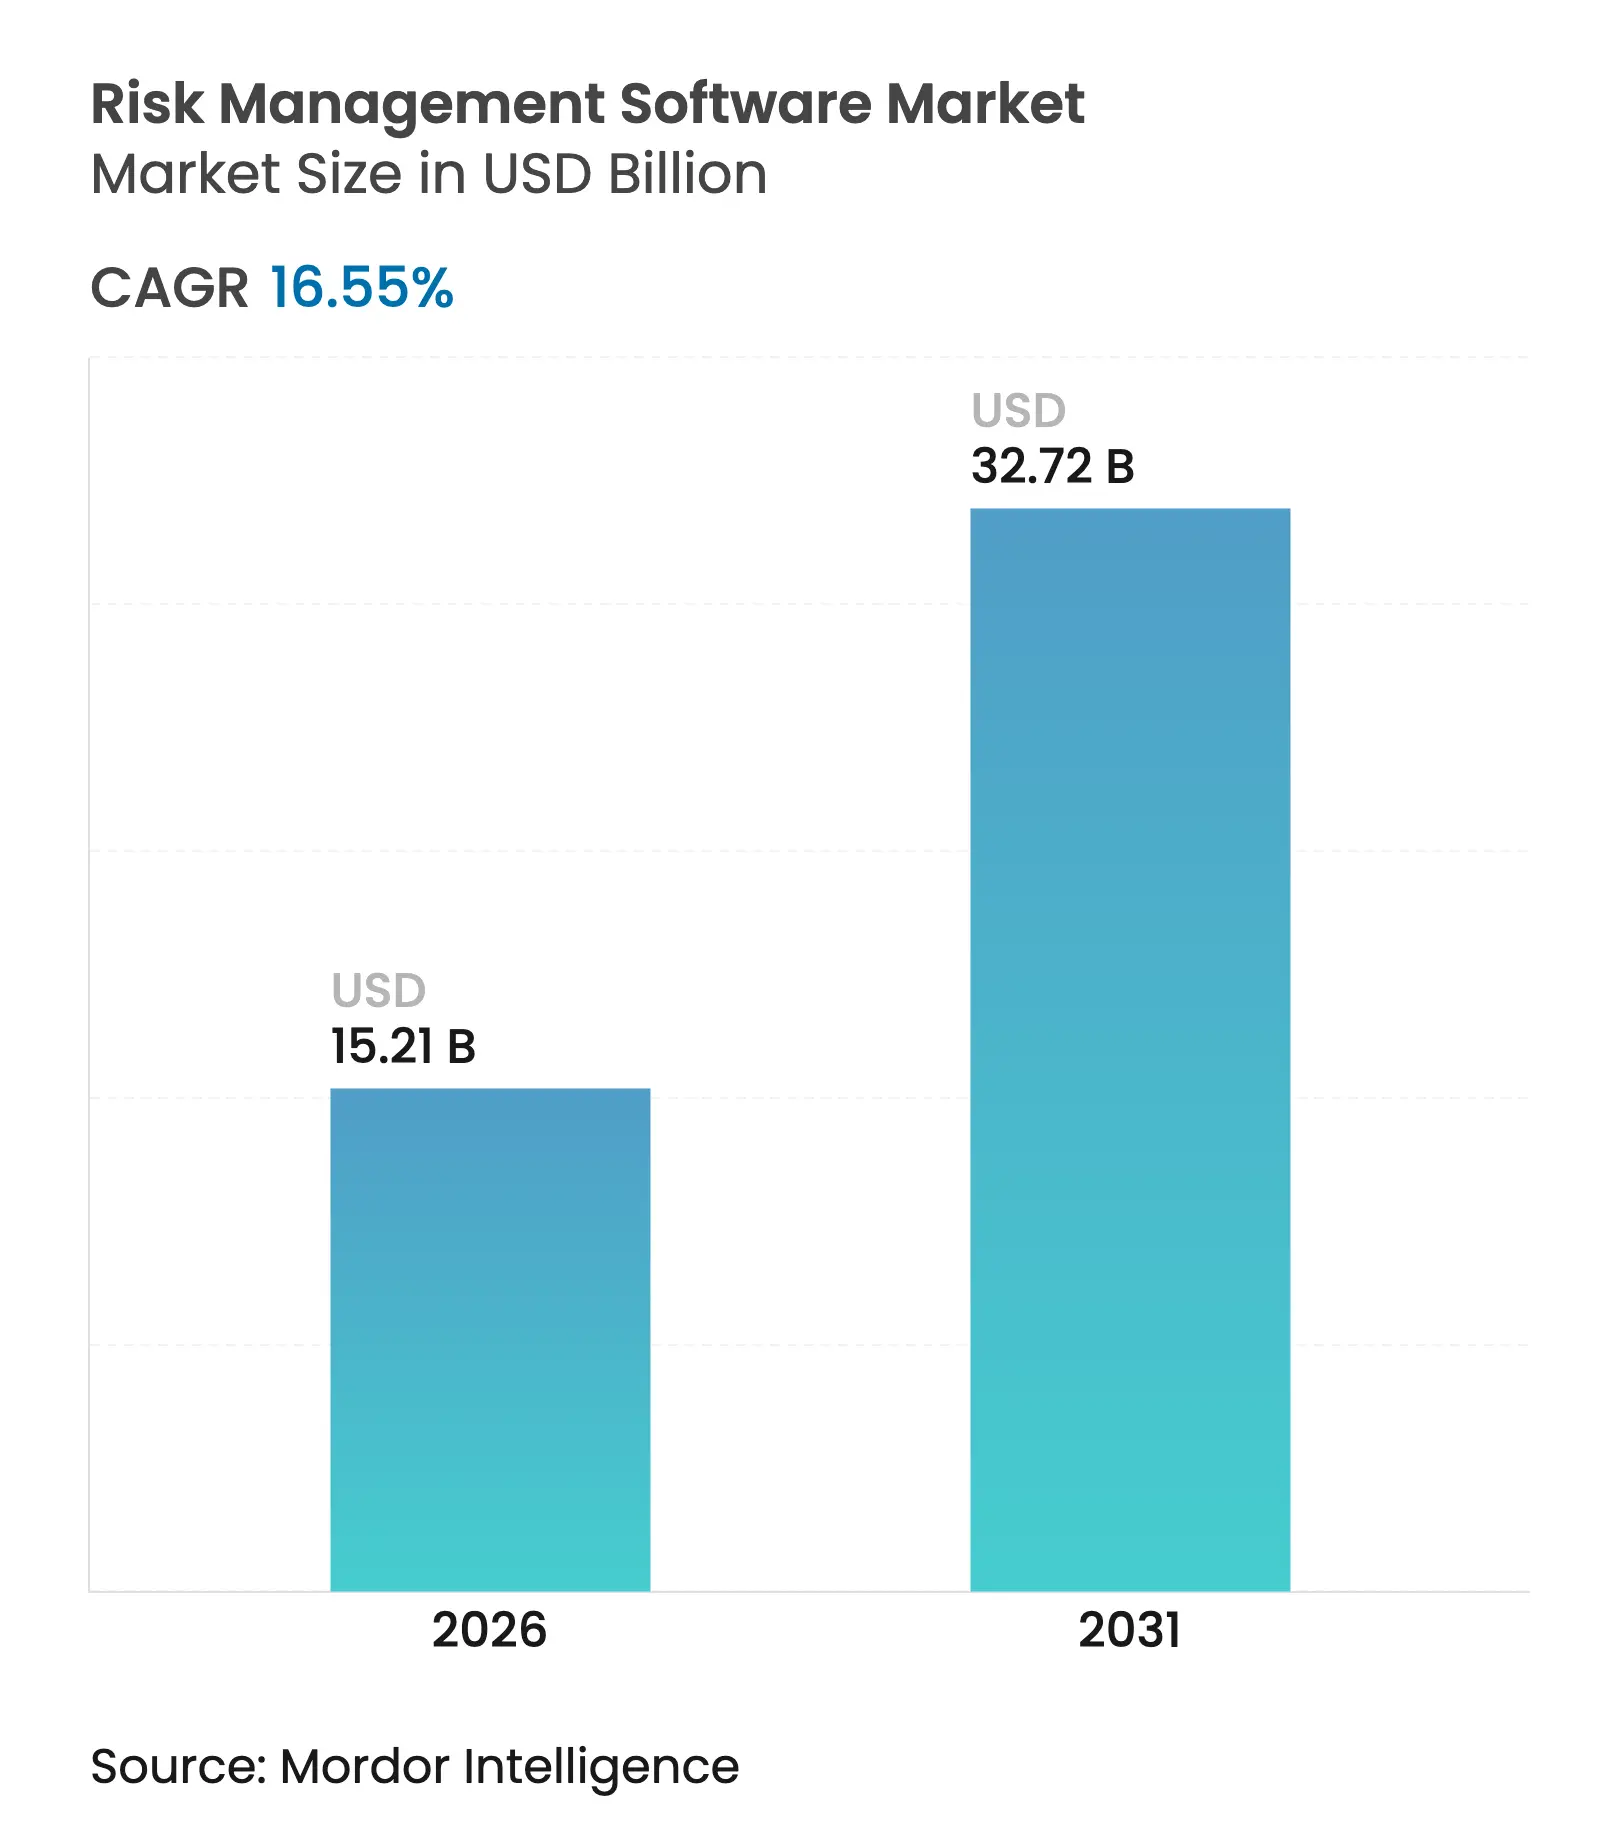
The risk management software market size was valued at USD 13.05 billion in 2025 and estimated to grow from USD 15.21 billion in 2026 to reach USD 32.72 billion by 2031, at a CAGR of 16.55% during the forecast period (2026-2031). Adoption accelerates as enterprises replace siloed tools with integrated risk-intelligence platforms that unify cybersecurity, operational and compliance workflows. Mandatory ESG disclosure rules, rising cyber-attack frequency and the maturation of generative-AI analytics collectively create a business case that outweighs legacy replacement costs. Cloud deployment remains the preferred architecture because rapid feature updates and subscription pricing shorten payback periods for both large enterprises and small and medium-sized enterprises (SMEs). Competitive dynamics favor vendors that can embed predictive algorithms, maintain an up-to-date regulatory content library and offer pre-configured industry templates that minimize implementation timelines.
Key Report Takeaways
Note: Market size and forecast figures in this report are generated using Mordor Intelligence's proprietary estimation framework, updated with the latest available data and insights as of 2026.
Drivers Impact Analysis
| Driver | (~) % Impact on CAGR Forecast | Geographic Relevance | Impact Timeline | |||
|---|---|---|---|---|---|---|
Rise in cybersecurity threats
Rise in cybersecurity threats
| +3.2% | Global, emphasis in North America and EU | Short term (≤ 2 years) |
(~) % Impact on CAGR Forecast
:
+3.2%
|
Geographic Relevance
:
Global, emphasis in North America and EU
|
Impact Timeline
:
Short term (≤ 2 years)
|
Stringent regulatory compliance mandates
Stringent regulatory compliance mandates
| +4.1% | EU leading, spreading to Asia-Pacific and Americas | Medium term (2-4 years) | |||
Shift to cloud-based deployments
Shift to cloud-based deployments
| +2.8% | Global, faster in North America | Short term (≤ 2 years) | |||
Growing fintech and BFSI digitalization
Growing fintech and BFSI digitalization
| +2.3% | Asia-Pacific core, spill-over to MEA and Latin America | Medium term (2-4 years) | |||
Integration of generative-AI risk scoring
Integration of generative-AI risk scoring
| +2.7% | North America and EU early adopters | Long term (≥ 4 years) | |||
Embedded risk APIs in low-/no-code platforms
Embedded risk APIs in low-/no-code platforms
| +1.4% | Global, enterprise focus in developed markets | Long term (≥ 4 years) | |||
| Source: Mordor Intelligence | ||||||
Rise in Cybersecurity Threats
Weekly cyber-attacks now average 1,270 incidents, forcing security teams to migrate from perimeter defenses to zero-trust frameworks that demand unified, real-time risk visibility [1]UpGuard, “Weekly Cyber-Attack Statistics,” upguard.com. Manufacturing and energy firms face dual information-technology and operational-technology exposures that elevate the value proposition of platforms capable of mapping cyber events to business-continuity impact. Persistent supply-chain infiltration has raised cybersecurity risk to 29.20% of overall software demand, and enterprises increasingly pay premiums for AI-enabled detection tools that execute automated response playbooks. These dynamics underpin sustained spending momentum across both regulated and unregulated verticals.
Stringent Regulatory Compliance Mandates
The Corporate Sustainability Reporting Directive (CSRD) came into force in 2024, obligating more than 50,000 European corporations to publish ESG metrics, while Basel III capital rules reshape global banking risk models [2]Wolters Kluwer, “CSRD Compliance Overview,” wolterskluwer.com. Climate-risk disclosure frameworks such as the Task Force on Climate-Related Financial Disclosures (TCFD) have become mandatory in multiple jurisdictions, necessitating quantitative scenario analysis that legacy systems cannot produce. Annual RegTech outlays now exceed USD 1 billion as firms automate monitoring and reporting workflows. Vendors that maintain always-current rule libraries and automate change management are consequently well positioned.
Shift to Cloud-Based Deployments
Subscription revenue at a leading workflow platform rose 19% year-over-year to USD 3.005 billion in Q1 2025, illustrating enterprise confidence in cloud-hosted governance, risk and compliance (GRC) applications. Multi-cloud strategies introduce visibility gaps and data-sovereignty trade-offs, creating tailwinds for solutions that correlate configuration drift, access control and regulatory policy in one dashboard. SMEs benefit most because cloud economics remove capex barriers, allowing rapid entry to the market without dedicated infrastructure teams.
Growing Fintech and BFSI Digitalization
Open-banking mandates intensify third-party risk oversight as financial institutions expose APIs to external partners that must meet continuous assurance requirements. The convergence of traditional banking with cryptocurrency wallets and decentralized finance introduces novel operational and compliance risk categories, spurring demand for configurable, API-centric platforms capable of ingesting large data volumes and running near-real-time risk-scoring models.
Restraints Impact Analysis
| Restraint | (~) % Impact on CAGR Forecast | Geographic Relevance | Impact Timeline | |||
|---|---|---|---|---|---|---|
High implementation and integration costs
High implementation and integration costs
| -2.1% | Global, acute for cost-sensitive SMEs | Short term (≤ 2 years) |
(~) % Impact on CAGR Forecast
:
-2.1%
|
Geographic Relevance
:
Global, acute for cost-sensitive SMEs
|
Impact Timeline
:
Short term (≤ 2 years)
|
Data privacy and sovereignty concerns
Data privacy and sovereignty concerns
| -1.8% | EU and Asia-Pacific, spreading globally | Medium term (2-4 years) | |||
Shortage of skilled risk analysts
Shortage of skilled risk analysts
| -1.3% | Global, acute in emerging markets | Long term (≥ 4 years) | |||
Model-risk from opaque AI algorithms
Model-risk from opaque AI algorithms
| -0.9% | Regulated industries worldwide | Medium term (2-4 years) | |||
| Source: Mordor Intelligence | ||||||
High Implementation and Integration Costs
Complex programs can cost 4–6 times the base software license as enterprises customize workflows, integrate legacy data and train users [3]6clicks, “GRC Implementation Cost Benchmarks,” 6clicks.com. Annual managed-service contracts for a leading GRC suite range from USD 50,000 to USD 500,000, often exceeding SME IT budgets. Total cost of ownership also includes periodic upgrades and governance reviews that can double ongoing expenses, pushing buyers toward pre-configured templates and managed-service bundles.
Data Privacy and Sovereignty Concerns
The European Union’s GDPR and Asia-Pacific data-localization mandates force multinational companies to partition data, complicating enterprise-wide dashboards and analytics. Cloud vendors must now guarantee in-region storage while still offering global uptime, which in turn extends procurement cycles and heightens due-diligence requirements for vendor-risk teams.
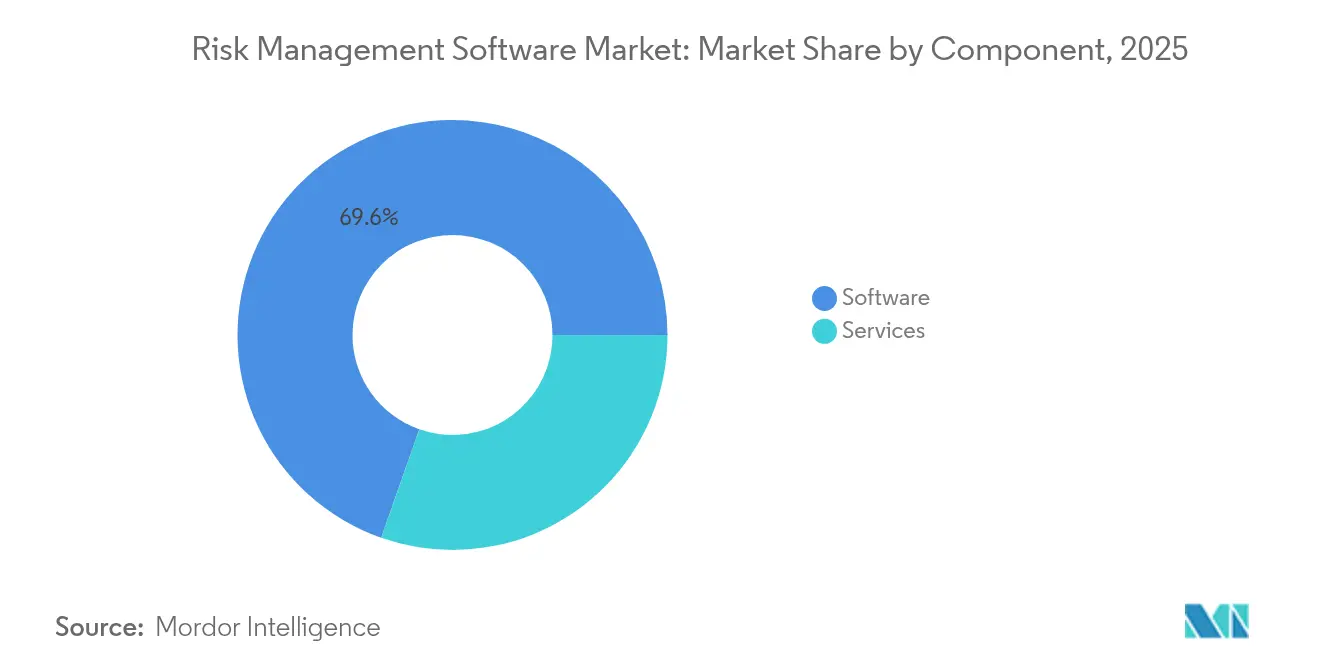
By Component: Services Drive Platform Sophistication
Software accounted for 69.62% of the 2025 risk management software market share, reflecting enterprise dependence on feature-rich platforms that centralize multiple risk domains. Services, however, will lead growth at an 18.12% CAGR as buyers seek advisory, configuration and managed-service expertise to unlock platform value. The shift indicates that many organizations lack in-house capacity to translate frameworks such as ISO 31000 or COSO ERM into actionable workflows. Vendor professional-services arms increasingly leverage industry accelerators and low-code extensions to shorten time-to-value while preserving compliance integrity.
Demand for continuous controls monitoring, KPI tuning and periodic model validation has converted one-time implementation projects into multi-year managed contracts. This recurring-services dynamic creates predictable revenue for vendors while assuring clients of ongoing alignment with evolving regulatory obligations. Buyers are also using service providers to operationalize generative-AI modules that automate narrative reporting and board-level dashboards, an area where expertise remains scarce.
Note: Segment shares of all individual segments available upon report purchase
By Deployment Mode: Cloud Dominance Accelerates
Cloud options captured 64.78% of 2025 spending and will expand at a 20.92% CAGR, underscoring buyer preference for elastic computing, automatic patching and consumption-based pricing. Early migrations focused on moving risk registers to hosted databases; current projects emphasize embedding micro-services into DevSecOps pipelines so controls run natively in production workloads. Vendors now offer bring-your-own-key encryption and region-specific data enclaves to meet emerging sovereignty rules, blunting the traditional on-premises advantage.
Although heavily regulated industries maintain a footprint of local installations, even these buyers are adopting hybrid blueprints that keep sensitive data in-house while drawing on cloud analytics for scenario modeling. Strong growth has encouraged hyperscalers to publish reference architectures that integrate their security, compliance and observability stacks with leading GRC suites, thus reducing architectural ambiguity and accelerating procurement cycles.
By End-user Enterprise Size: SME Adoption Transforms Market Dynamics
Large organizations held 54.62% of 2025 revenue, leveraging established governance structures and budget flexibility to fund comprehensive deployments. Yet the SME cohort is forecast to advance at 16.98% CAGR as vendors launch tiered subscription bundles and template libraries that allow implementation in weeks instead of months. Cloud automation permits SMEs to delegate configuration to vendor success teams, eliminating the need for full-time risk analysts.
The affordability unlocks has strategic consequences: insurance carriers now offer premium discounts to SMEs that can demonstrate automated risk controls and audit logs. Developers of low-code platforms increasingly expose risk APIs natively, allowing smaller firms to embed compliance checks directly into customer-facing applications without writing custom code. This democratization erodes historical barriers to sophisticated risk management.

Recognized by Experts. Trusted by Leaders.
A trusted intelligence partner to global decision-makers across 90+ countries.


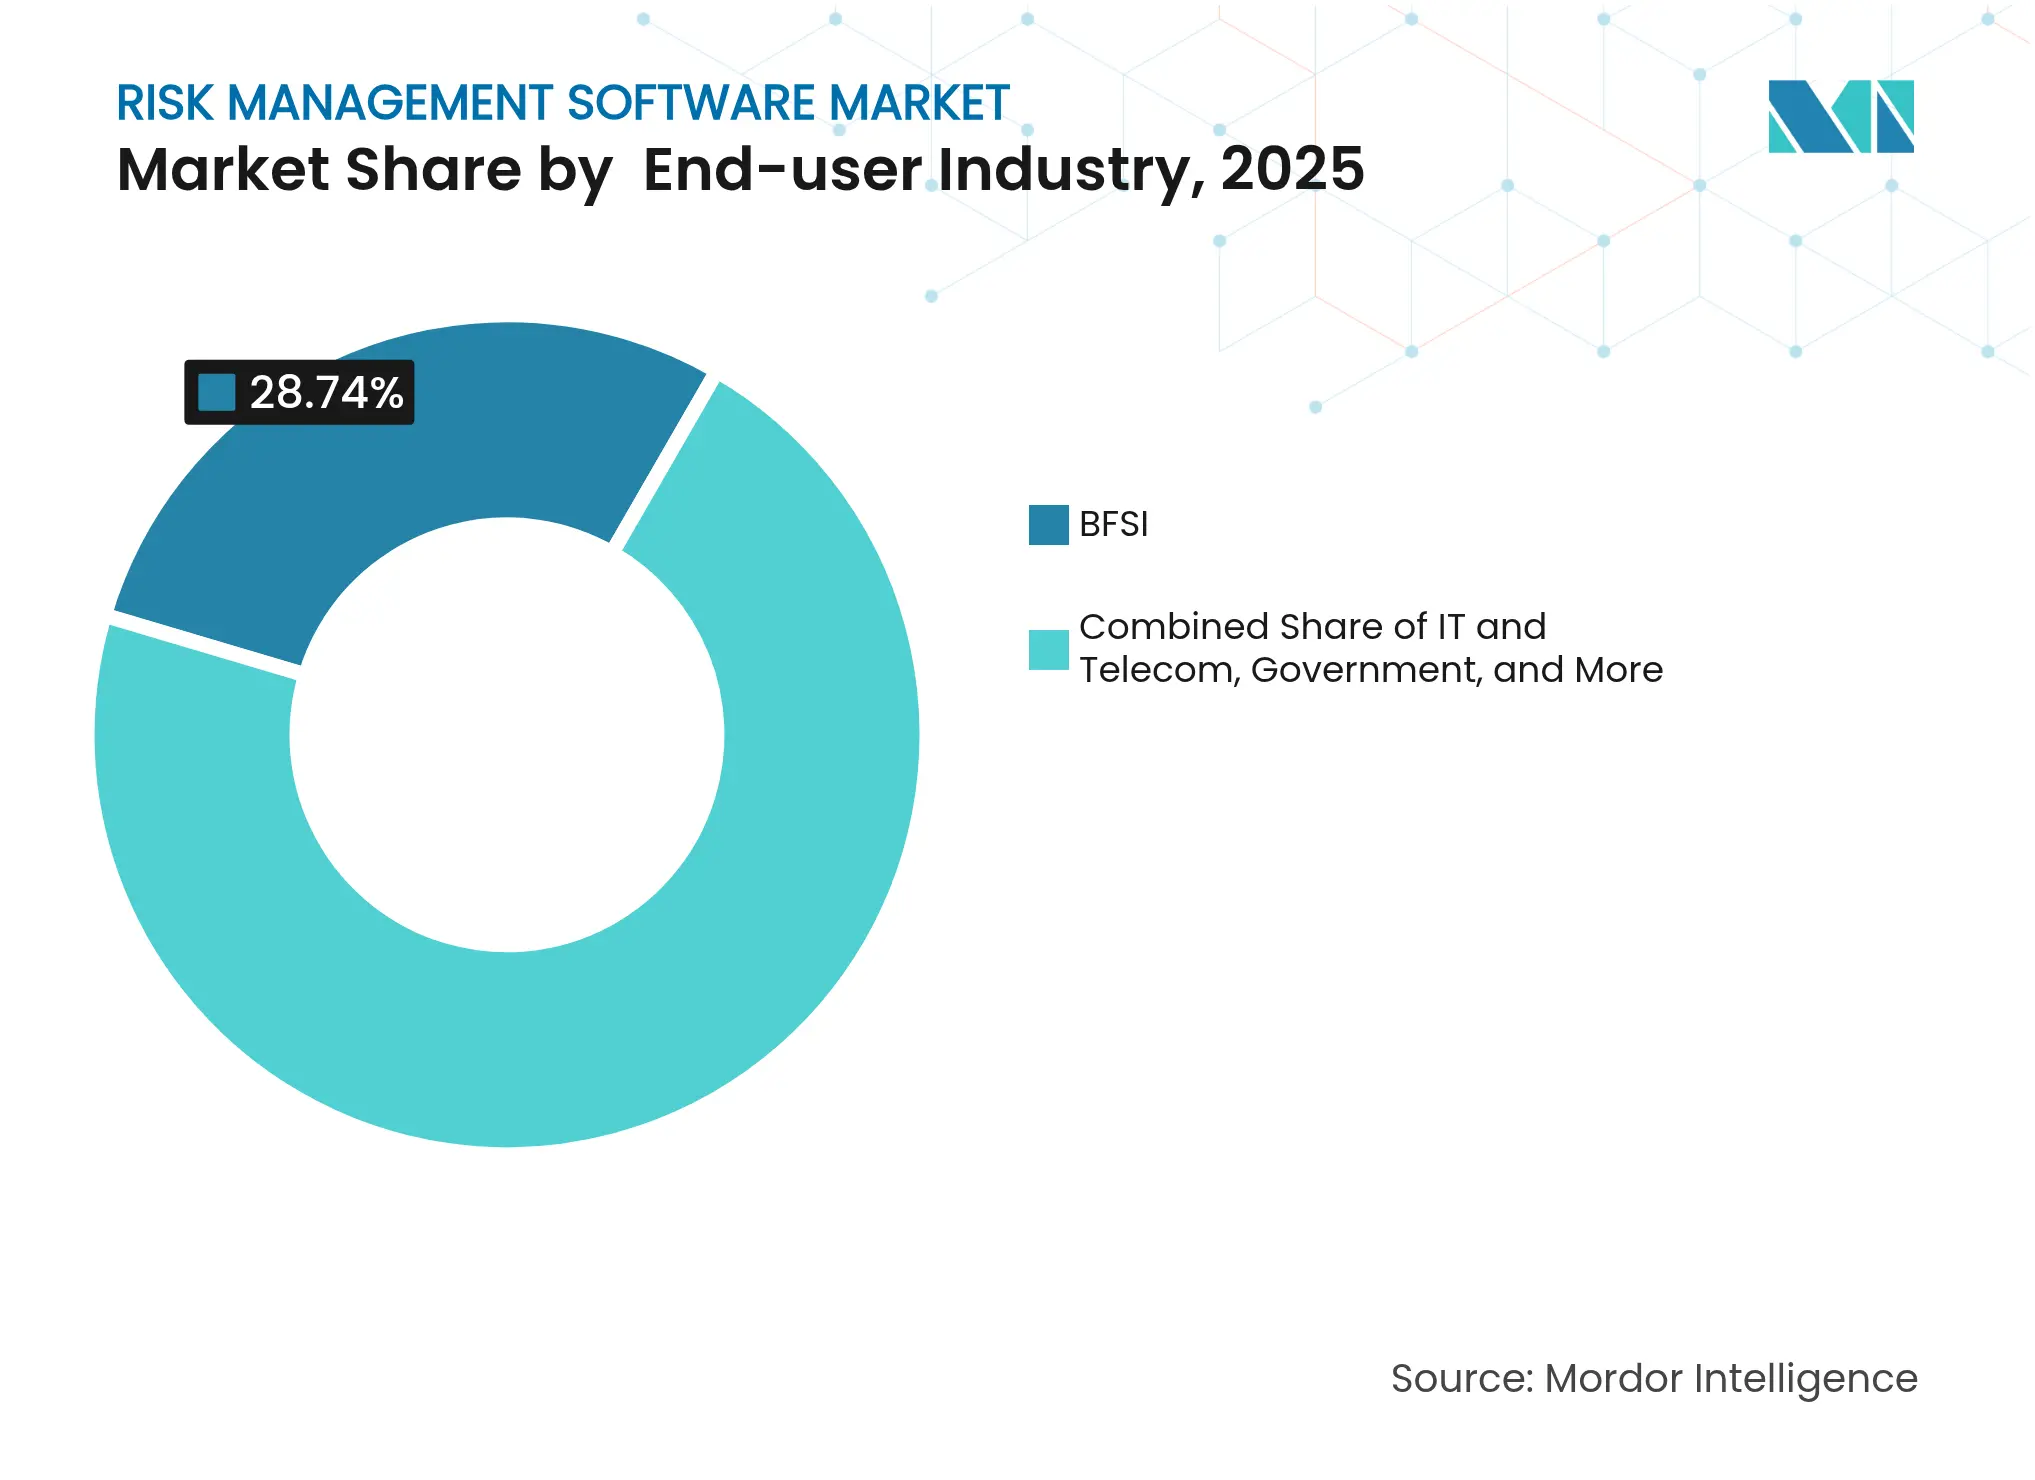
By End-user Industry: Healthcare Emerges as Growth Leader
BFSI retained 28.74% of the 2025 risk management software market size, driven by capital-adequacy rules, fraud analytics and stringent audit expectations. Healthcare, however, will register a 17.32% CAGR through 2031 as patient-safety directives and electronic health record mandates require unified oversight of clinical, operational and cyber risk. Provider networks now integrate incident-reporting, credentialing and vulnerability-management modules in a single dashboard to satisfy regulators and insurers.
Market momentum is further bolstered by increasing ransomware incidents targeting hospital systems and medical devices. Platforms tailored for healthcare embed taxonomy for adverse events, root-cause analysis and corrective-and-preventive-action tracking, capabilities that generalist GRC suites often lack. As reimbursement models penalize preventable errors, risk software shifts from compliance expense to revenue-protection asset.
Note: Segment shares of all individual segments available upon report purchase
By Risk Type: ESG and Climate Risk Reshape Priorities
Operational risk comprised 28.95% of 2025 demand, spanning business-continuity, process breakdown and supply-chain disruption modules. ESG and climate risk will record a 21.65% CAGR as CSRD, California’s Climate Accountability Act and similar statutes require granular emissions data and forward-looking scenario analysis. Boards increasingly request integrated dashboards that cross-link carbon metrics with financial exposure, reputation indices and insurance coverage.
Vendors respond by embedding physical-hazard models, transition-risk calculators and automated sustainability-report writers that map data into frameworks such as GRI and SASB. Financial institutions are extending these tools to portfolio-level analysis, while manufacturers use them to prioritize capital upgrades that cut emissions and operating costs simultaneously.
North America represented 35.74% of 2025 revenue, underpinned by SEC cyber-incident disclosure rules, the Sarbanes-Oxley Act and a deep pool of skilled implementation partners. Large banks upgraded stress-testing engines ahead of Basel III deadlines, while energy utilities integrated operational-technology cybersecurity modules to satisfy NERC-CIP updates. AI-driven risk scoring is already entering mainstream adoption as cloud vendors integrate pretrained models into their compliance suites.
Europe ranks second by value and leads in regulatory innovation. The CSRD has transformed ESG and climate-risk modules from optional add-ons to core buying criteria. The GDPR continues to influence data-architecture decisions, driving demand for field-level encryption, data-processing agreements and in-region disaster-recovery zones. Germany and France prioritize audit-ready documentation in local languages, whereas the United Kingdom emphasizes third-party-risk exchange frameworks to monitor supply-chain partners.
Asia-Pacific is the fastest-growing region at a 17.55% CAGR. Fintech expansion in Singapore, India and Indonesia creates new credit-risk and conduct-risk requirements. China’s Personal Information Protection Law (PIPL) pushes multinationals to deploy segregated instances hosted by local cloud providers. Japan’s Corporate Governance Code pressures boards to adopt continuous risk-monitoring dashboards, and Australia’s critical-infrastructure laws extend obligations beyond energy to telecommunications and health. Regional buyers increasingly favor SaaS solutions that deliver local language packs and pre-mapped regulatory libraries.

Market Concentration
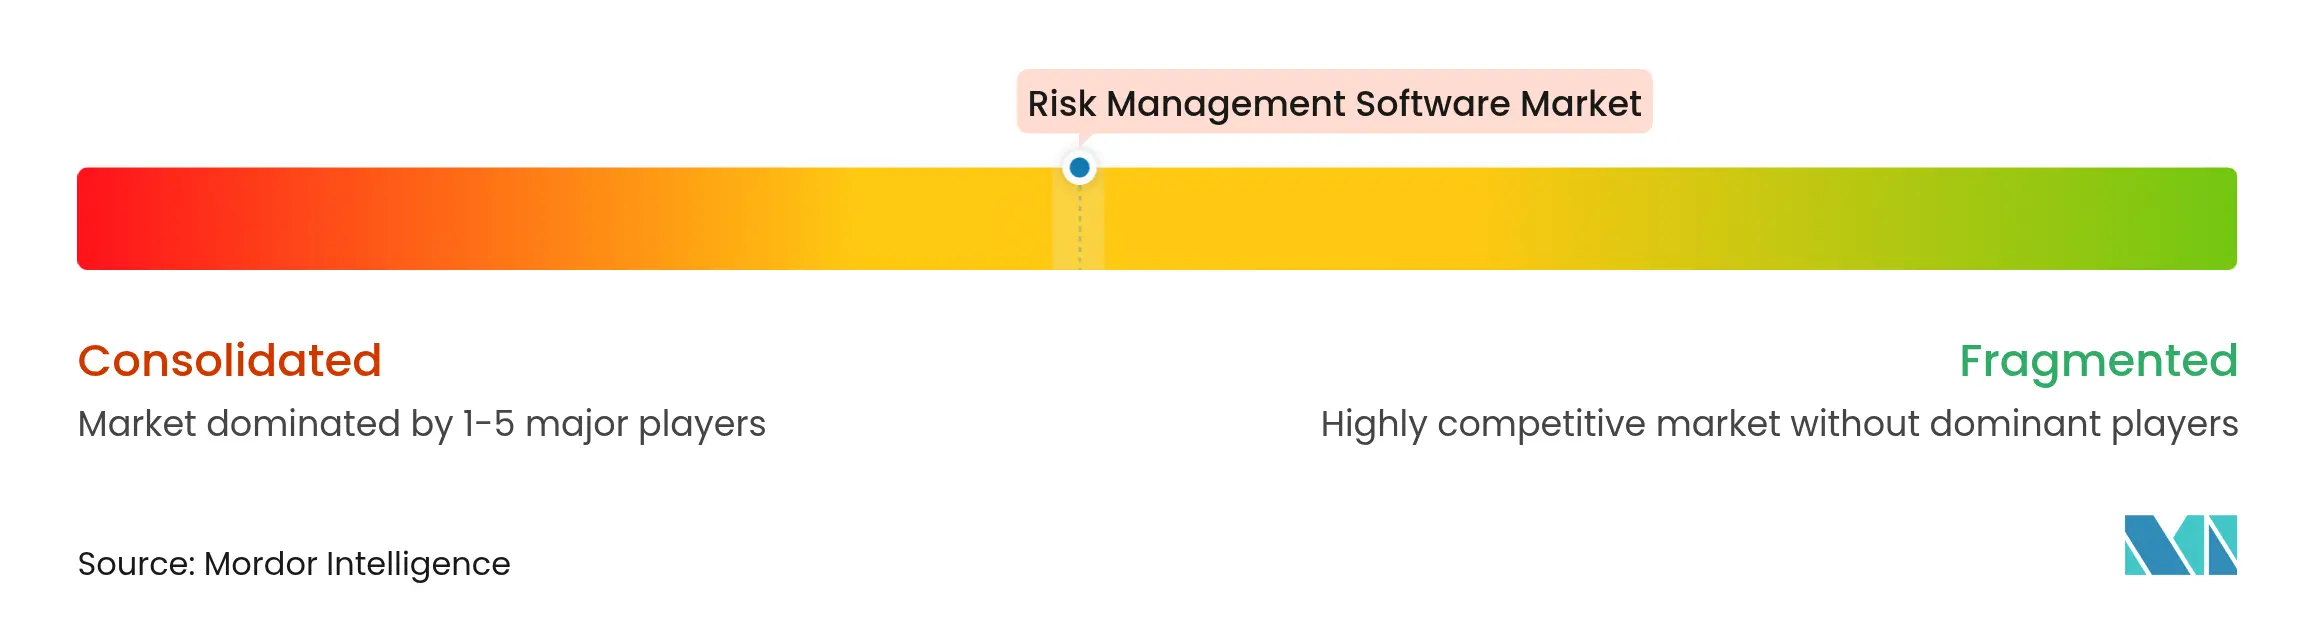
The market is moderately concentrated. Established enterprise-resource-planning providers such as SAP, Oracle and IBM leverage embedded customer footprints and integrated data models, while pure-play vendors including Riskonnect, MetricStream and LogicManager differentiate through deeper domain libraries and faster release cycles. Cloud deployment reduces vendor-lock-in, intensifying price competition and accelerating feature parity.
Strategic playbooks cluster around three themes. First, platform consolidation: Riskonnect has acquired six firms since 2020, adding analytics, claim-management and regional-localization capabilities to create a full-stack offering. Second, AI-powered differentiation: several vendors now embed large-language-model agents that draft control-test narratives and map regulations to internal policy in seconds. Third, vertical specialization: RLDatix focuses exclusively on healthcare, while Opus focuses on supply-chain risk, using deep domain taxonomies that generalists cannot easily replicate.
Channel alliances, especially with global systems integrators, are expanding as mid-market buyers seek turnkey implementations that bundle software, services and managed analytics. Meanwhile, hyperscalers are integrating native risk modules into their security suites, creating both competition and partnership opportunities for independent software vendors.

*Disclaimer: Major Players sorted in no particular order
1. INTRODUCTION
2. RESEARCH METHODOLOGY
3. EXECUTIVE SUMMARY
4. MARKET LANDSCAPE
5. MARKET SIZE AND GROWTH FORECASTS (VALUE)
6. COMPETITIVE LANDSCAPE
7. MARKET OPPORTUNITIES AND FUTURE TRENDS
Market Definitions and Key Coverage
Segmentation Overview
Detailed Research Methodology and Data Validation
Primary Research
Desk Research
Market-Sizing & Forecasting
Data Validation & Update Cycle
Why Our Risk Management Software Baseline Stands Up to Scrutiny
Benchmark comparison
| Market Size | Anonymized source | Primary gap driver | ||
|---|---|---|---|---|
USD 13.05 B (2025) | Mordor Intelligence | - | Anonymized source:Mordor Intelligence | Primary gap driver:- |
USD 17.45 B (2025) | Regional Consultancy A | Includes audit & GRC suites; limited primary validation | ||
USD 41.40 B (2024) | Trade Journal B | Broad definition spanning analytics tools; older base year, no mid-year refresh |
Pricing Strategy for Semiconductor Components
3 Min Read
Accelerating Additive Manufacturing Adoption in India
3 Min Read
Wealth Management Intelligence for the Middle East
4 Min Read
When decisions matter, industry leaders turn to our analysts. Let’s talk.