Enterprise Asset Management Market Size and Share
Market Overview
| Study Period | 2020 - 2031 |
|---|---|
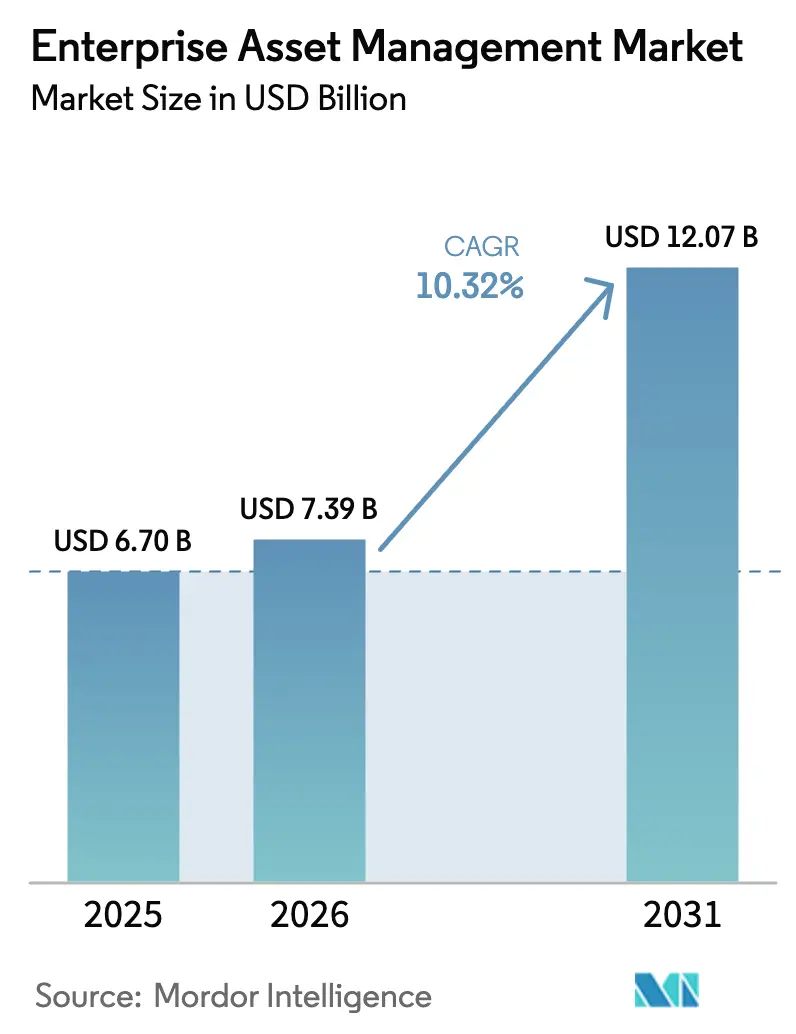
| Market Size (2026) | USD 7.39 Billion |
| Market Size (2031) | USD 12.07 Billion |
| Growth Rate (2026 - 2031) | 10.32% CAGR |
| Fastest Growing Market | Asia Pacific |
| Largest Market | North America |
| Market Concentration | Medium |
Major Players *Disclaimer: Major Players sorted in no particular order Image © Mordor Intelligence. Reuse requires attribution under CC BY 4.0. | |
Enterprise Asset Management Market Analysis by Mordor Intelligence
The enterprise asset management market size is expected to grow from USD 6.70 billion in 2025 to USD 7.39 billion in 2026 and is forecast to reach USD 12.07 billion by 2031 at 10.32% CAGR over 2026-2031. Rising demand for predictive, outcome-based maintenance, the integration of artificial intelligence with industrial IoT, and stricter ESG-linked performance mandates are reshaping asset life-cycle strategies. Aging infrastructure across power, transport, and manufacturing plants pushes owners to move from reactive work orders to predictive work models, while workforce shortages make automation-assisted maintenance indispensable. Cloud platforms gain favor because they reduce capital outlays and speed up analytics roll-outs, and regulatory frameworks in North America and the European Union reward organizations that prove asset reliability and energy efficiency. Competitive intensity grows as vendors embed generative AI and digital twin engines directly inside EAM modules, turning software upgrades into strategic levers for uptime guarantees and new service contracting models.
Key Report Takeaways
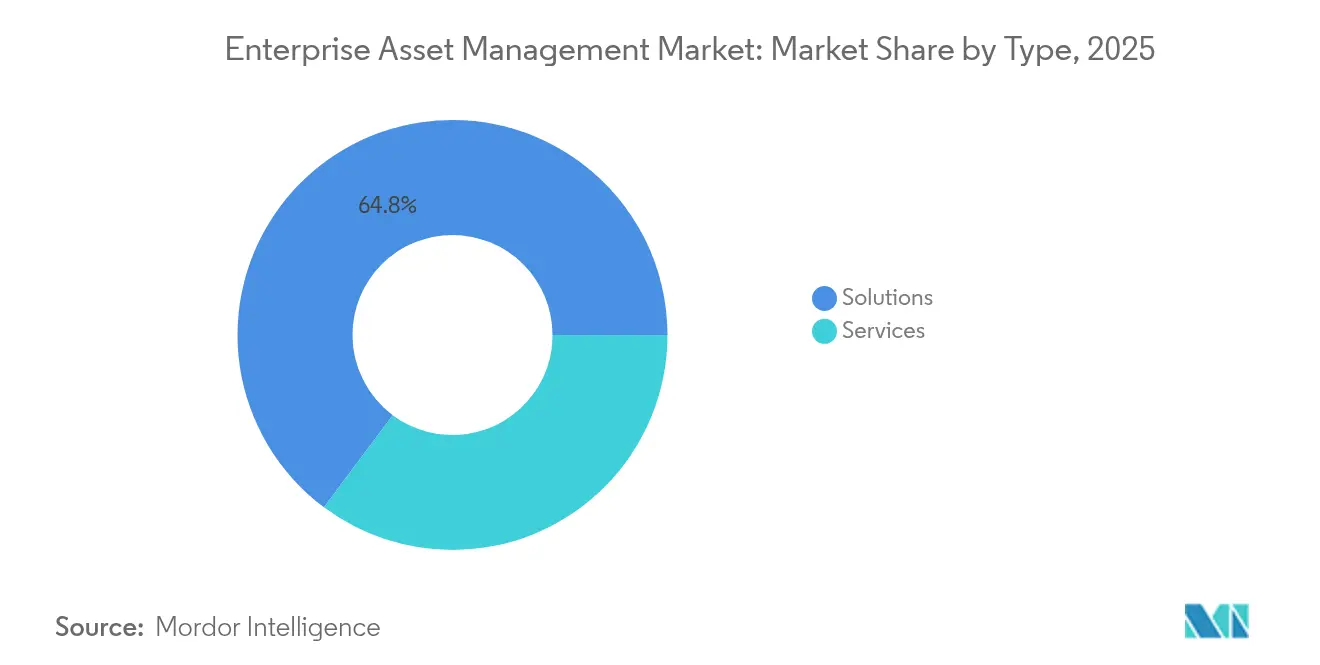
- By type, solutions contributed 64.80% of 2025 revenue, while the services segment is projected to post the fastest 13.15% CAGR to 2031.
- By deployment, the cloud model captured 62.15% of the enterprise asset management market share in 2025 and is expanding at a 13.05% CAGR through 2031.
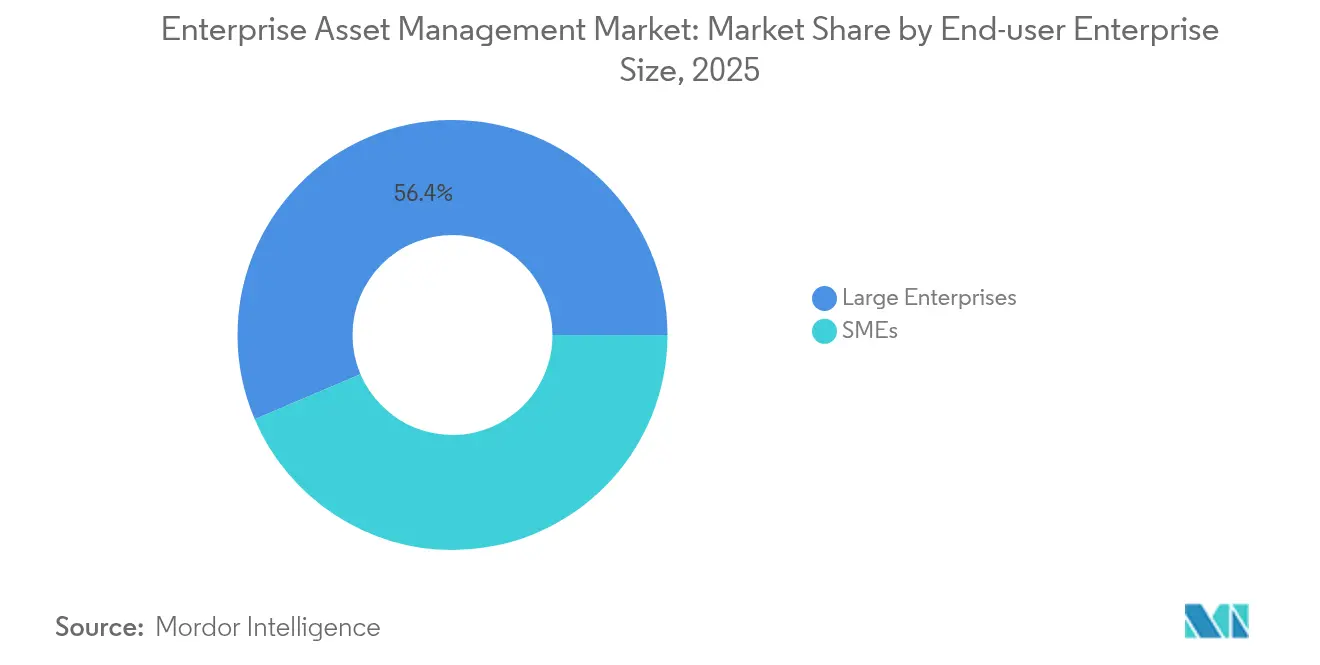
- By end-user enterprise size, large enterprises held 56.40% share of the enterprise asset management market size in 2025; small and medium enterprises are advancing at a 14.55% CAGR to 2031.
- By end-user Industry, manufacturing led with 27.10% revenue share in 2025; healthcare is poised to grow at a 15.10% CAGR to 2031.
- By geography, North America commanded 33.20% of 2025 revenue; Asia-Pacific shows the strongest 11.75% CAGR through 2031.
Note: Market size and forecast figures in this report are generated using Mordor Intelligence’s proprietary estimation framework, updated with the latest available data and insights as of 2026.
Global Enterprise Asset Management Market Trends and Insights
Drivers Impact Analysis*
| Driver | ( ~ ) % Impact on CAGR Forecast | Geographic Relevance | Impact Timeline |
|---|---|---|---|
| Asset-centric digital twins adoption | +2.1% | Global, led by North America and EU | Medium term (2-4 years) |
| Surge in IIoT-enabled predictive maintenance | +2.8% | Global, Asia-Pacific core with spill-over to MEA | Short term (≤ 2 years) |
| Cloud EAM penetration among Tier-2 firms | +1.9% | North America and EU, expanding to Asia-Pacific | Medium term (2-4 years) |
| ESG-linked asset performance mandates | +1.4% | EU-led, expanding to North America | Long term (≥ 4 years) |
| 5G-powered mobile EAM connectivity | +1.2% | Asia-Pacific core, early adoption in North America | Medium term (2-4 years) |
| Outcome-based service contracts | +1.0% | Global, mature markets first | Long term (≥ 4 years) |
| Source: Mordor Intelligence | |||
Asset-centric digital twins adoption
Digital twins give owners a live, virtual replica of every critical component, letting engineers simulate load, inspect degradation and schedule repairs before faults arise. Unilever reports tangible savings after linking twin models to energy monitoring on detergent lines, while IBM’s Maximo Application Suite now blends generative AI with physics-based twins for utility substations, bringing unstructured inspection images into maintenance workflows. The World Economic Forum lists twins among the top three factory digitization levers because they compress root-cause analysis time and extend equipment life.
Surge in IIoT-enabled predictive maintenance
Wireless vibration, thermal, and power sensors stream data into cloud analytics that flag anomalies hours or days in advance. ABB’s MACHsense-R deployment on 460 motors at a continuous-process plant cut unscheduled downtime and generated a rapid return on maintenance budgets [1]ABB Group, “MACHsense-R Condition Monitoring,” abb.com. Siemens’ Senseye platform applies machine-learning models across mixed OEM fleets, delivering a single health score that plant managers trust for shift-level decisions. The drop in sensor costs and the arrival of 5G private networks accelerate uptake across Asia-Pacific factories.
Cloud EAM penetration among Tier-2 manufacturers
Subscription platforms remove the hardware, patching and database administration burden that once discouraged mid-sized enterprises. Microsoft Cloud for Manufacturing, built on Azure and Dynamics 365, lets shop-floor supervisors launch predictive maintenance apps within weeks and scale globally without data-center builds. OECD surveys show 72% of SMEs already collect operational data but fewer than one-in-five tap available digitization grants, pointing to a large greenfield for cloud-hosted EAM [2]Organisation for Economic Co-operation and Development, “SME Digitalisation Outlook,” oecd.org.
ESG-linked asset performance mandates
European legislation now requires verified reporting on energy intensity and scope-1 emissions, turning asset reliability into a compliance metric. Schneider Electric ties supplier incentives to carbon-reduction roadmaps and uses its EcoStruxure platform to monitor equipment footprints in real time. As similar rules appear in North America, boards allocate capital to software that quantifies how every pump, switch-gear and rooftop unit affects net-zero targets.
Restraints Impact Analysis*
| Restraint | ( ~ ) % Impact on CAGR Forecast | Geographic Relevance | Impact Timeline |
|---|---|---|---|
| Legacy OT-IT integration complexity | -1.8% | Global, acute in mature industrial regions | Short term (≤ 2 years) |
| Data-sovereignty regulations | -1.2% | EU-led, expanding globally | Medium term (2-4 years) |
| Shortage of EAM-skilled maintenance engineers | -2.1% | Global, severe in North America and EU | Long term (≥ 4 years) |
| Cyber-risk across converged OT/IT assets | -1.5% | Global, critical infrastructure focus | Short term (≤ 2 years) |
| Source: Mordor Intelligence | |||
Legacy OT-IT integration complexity
Many plants still run proprietary control buses and 20-year-old PLCs that were never designed for ethernet, making data extraction cumbersome. Cisco stresses that teams now need a single security posture across historian servers, edge gateways and cloud dashboards to avoid blind spots. Honeywell categorizes most operators in phase-1 maturity, where assessments are complete but risk mitigation remains basic. Integration programs stall when budgets must also cover ruggedized networking, network segmentation and workforce training.
Shortage of EAM-skilled maintenance engineers
The U.S. Bureau of Labor Statistics forecasts 152,300 new maintenance openings each year through 2030, yet retirement and reskilling shortfalls leave posts unfilled. Modern manufacturing lines need technicians fluent in mechanical repair, PLC logic, cybersecurity hygiene and data analysis. The Society for Maintenance and Reliability Professionals advocates structured upskilling that maps every job task to competency matrices, but adoption is slow because plants run at tight margins. Talent scarcity forces owners to outsource more analytics and field work to OEMs and service integrators, adding cost layers.
*Our forecasts treat driver/restraint impacts as directional, not additive. The impact forecasts reflect baseline growth, mix effects, and variable interactions.
Segment Analysis
By Type: Services accelerate digital transformation
Solutions held 64.80% of 2025 revenue as organizations continued to license core asset registers and work-order modules. Services, however, logged the quickest 13.15% CAGR, reflecting demand for consulting, integration and managed analytics. Outcome-based agreements from Siemens and GE ensure uptime across power grids and turbines, transferring risk from asset owner to service firm. Vendors bundle remote-monitoring centers, spares optimization and AI modeling, pushing the enterprise asset management market toward subscription revenues. Organizations see services as the fast lane to predictive workflows when internal data-science talent is scarce.
Services now command 35.20% of the enterprise asset management market size for complex brownfield upgrades, and their share continues rising as digital twin pilots roll into multi-site programs. This services momentum underpins a wider shift from perpetual licences to evergreen, SLA-driven relationships that blend software, data stewardship and outcome guarantees. Operators in power distribution, mining and transport choose turnkey engagements that free maintenance managers from architecting sensor stacks, ingestion pipelines and AI models.


By Deployment: Cloud dominance accelerates
The cloud model captured 62.15% enterprise asset management market share in 2025 and leads growth at 13.05% CAGR as buyers favor OPEX fees over hardware depreciation. Multi-tenant architectures pool updates and cybersecurity patches, lifting reliability while trimming IT headcount. Hybrid designs persist in defense and regulated utilities where data residency rules apply. On-premises footprints continue to shrink, yet vendors still deliver edge nodes that buffer high-frequency sensor streams before secure upload.
Centralized repositories and browser-based analytics give field technicians asset histories on any device, shrinking mean-time-to-repair and improving audit readiness. The enterprise asset management market size for pure-cloud deployments is projected to grow, fuelled by SME adoption that remains well below penetration in large enterprises. Broader 5G coverage removes bandwidth concerns, letting factories stream machine health metrics directly to data lakes hosted by hyperscalers.
By End-user Enterprise Size: SMEs drive cloud adoption
Large enterprises controlled 56.40% of spending in 2025 thanks to multi-plant roll-outs. Yet SMEs are expanding their outlays at a 14.55% CAGR, narrowing the functionality gap with tier-one manufacturers. Pay-as-you-go licensing aligns with uneven production cycles, while low-code configuration means fewer internal specialists. OECD data show only 18% of SMEs have tapped public incentives for digitization, signifying strong latent demand once awareness programs broaden.
SMEs gravitate to bundled offers that integrate maintenance, energy management and spare-parts commerce on one portal. The enterprise asset management industry now sees cloud vendors tailoring quick-start templates for food processors, metal-working shops and regional transit agencies. This down-market momentum diversifies revenue away from mega-project dependance and spreads best-practice maintenance to plants historically run on spreadsheets and manual logs.
By End-User Industry: Healthcare emerges as growth leader
Manufacturing remained the largest adopter with 27.10% revenue share in 2025, driven by Industry 4.0 sensor retrofits and rising downtime costs. Healthcare, however, posts the strongest 15.10% CAGR as hospitals equip fleets of imaging devices, IV pumps, and beds with real-time location tags that improve utilisation. Sonitor reports equipment use rising from 42% to over 75% after RTLS introduction, freeing capital for patient services. Compliance with Joint Commission standards pushes hospitals to log every preventive check, a task now automated through EAM mobile apps.
Growth in healthcare also reflects rising surgical volumes and the need to trace sterilisation cycles. Vendors tailor dashboards that merge biomedical engineering tasks with building utilities for a holistic cost-of-care view. The enterprise asset management market size for healthcare assets is forecast to expand more than twofold by 2031 as public and private operators modernise legacy tracking systems.
Geography Analysis
North America kept its leadership with 33.20% 2025 revenue, supported by federal infrastructure legislation and a rich vendor ecosystem. IBM, Oracle, and Rockwell Automation continuously release AI modules that cut downtime for utilities and airports, while Schneider Electric invested USD 140 million to enlarge U.S. switch-gear capacity, boosting domestic supply resilience . Skilled labour shortages amplify adoption because predictive tools let fewer technicians oversee larger asset bases.
Europe benefits from mandatory sustainability disclosures and digital sovereignty drives. The EU is drafting cloud certification schemes aimed at reducing reliance on non-European hyperscalers, creating space for regional EAM providers that can guarantee data residency. Energy efficiency directives spur utilities to couple asset registries with carbon calculators, converting maintenance to a compliance lever.
Asia-Pacific is the enterprise asset management market’s fastest climber at 11.75% CAGR. China pilots 5G factory zones where CNC machines stream diagnostics through Advantech edge controllers, cutting unplanned stoppages in heavy equipment lines. India’s production-linked incentives push SMEs to digitise shop floors, and public cloud pricing in local currency removes foreign-exchange barriers. Governments in Southeast Asia channel grants toward smart-manufacturing roadmaps, fuelling new contracts for local system integrators.


Competitive Landscape
The enterprise asset management market is moderately fragmented, leaving ample room for niche entrants. Competition pivots on AI embedment, vertical templates, and service portfolios. Siemens strengthened its SaaS reach by merging Xcelerator services with IFS uptime guarantees, enabling power utilities to link substation data to automated work orders. IBM acquired AST LLC to deepen Oracle cloud consulting inside public-sector asset programs, underlining a shift toward platform ecosystems.
ServiceNow broadens scope with agentic AI that automates root-cause searches across IT and OT tickets, reducing mean-time-to-resolution for hybrid incidents. ABB bundles sensor hardware with Ability Condition Monitoring subscriptions, locking in annuity revenue and differentiating against pure-play software rivals. White-space opportunities appear in healthcare where asset tagging intersects with patient flow analytics. Start-ups pitch computer-vision inspections and generative AI chatbots that guide novice technicians through repair steps, addressing the talent gap.
Enterprise Asset Management Industry Leaders
IBM Corporation
Oracle Corporation
Hexagon AB
IFS AB
SAP SE
- *Disclaimer: Major Players sorted in no particular order

Recent Industry Developments
- June 2025: Verosoft unveiled TAG Mobi EAM, a mobile-first platform targeting manufacturing, energy and facilities.
- April 2025: Naviam launched as the largest IBM Maximo specialist after merging seven regional partners.
- February 2025: ABB deployed Ability Condition Monitoring on 460 motors at an Italian continuous-process plant, alerting crews to anomalies in real time.
- February 2025: Deloitte and AWS introduced Digital Reality Enterprise Asset Management™ to fuse spatial data with digital twins for industrial metaverse use cases.


Research Methodology Framework and Report Scope
Market Definitions and Key Coverage
Our study defines the enterprise asset management (EAM) market as worldwide revenue generated from licensed or subscribed software together with implementation, integration, support, and training services that help midsize and large organizations monitor, maintain, and optimize plants, fleets, facilities, and linear assets. We at Mordor Intelligence also track stand-alone modules such as work-order scheduling, inventory, and predictive maintenance alongside full suites delivered through cloud, on-premise, or hybrid models.
Scope exclusion: Pure financial asset tools, entry-level maintenance systems built only for micro firms, and bespoke in-house builds sit outside this scope.
Segmentation Overview
- By Type
- Solutions
- Services
- By Deployment
- Cloud
- Hybrid
- On-premises
- By End-user Enterprise Size
- Large Enterprises
- SMEs
- By End-user Industry
- Manufacturing
- Energy and Utilities
- Transportation and Logistics
- Oil and Gas
- Government and Defense
- IT and Telecom
- Healthcare
- Others
- By Geography
- North America
- United States
- Canada
- Mexico
- South America
- Brazil
- Argentina
- Rest of South America
- Europe
- Germany
- United Kingdom
- France
- Italy
- Spain
- Russia
- Rest of Europe
- Asia-Pacific
- China
- Japan
- India
- South Korea
- Australia and New Zealand
- Rest of Asia-Pacific
- Middle East and Africa
- Middle East
- Saudi Arabia
- United Arab Emirates
- Turkey
- Rest of Middle East
- Africa
- South Africa
- Nigeria
- Egypt
- Rest of Africa
- Middle East
- North America
Detailed Research Methodology and Data Validation
Primary Research
We spoke with maintenance directors, product managers, and system integrators across North America, Europe, and Asia-Pacific to verify adoption rates, discount bands, and service attach ratios. Follow-up surveys with manufacturers and utilities fine-tuned average selling prices and upgrade cycles, giving us a timely reality check.
Desk Research
Our analysts first collected capital spend series, installed IIoT node counts, regional maintenance budgets, and cloud migration rates from the World Bank, U S Census Bureau Capital Expenditure Survey, International Energy Agency, and Eurostat. Company 10-Ks, investor decks, patent data accessed through Questel, Volza shipment logs, and paid files from D & B Hoovers and Dow Jones Factiva refined vendor splits and technology signals.
A second pass compared trade journal updates and maintenance association releases; then any questionable signals were flagged for interviews before numbers flowed into our model. The sources named illustrate the breadth consulted, and many other open datasets were cross-checked for confirmation.
Market-Sizing & Forecasting
The model starts with a top-down rebuild of addressable maintenance spend by region, filters it through EAM penetration, asset intensity factors, and cloud shift assumptions, and lands on the 2025 baseline. Targeted bottom-up checks, which include supplier roll-ups and sampled ASP × license volumes, temper totals. Variables such as plant uptime goals, sensor-equipped asset stock, audit frequency, equipment age, and SaaS price erosion feed a multivariate regression blended with scenario analysis for the five-year view.
Data Validation & Update Cycle
Outputs clear anomaly screens, variance checks, and two-step peer review before sign-off. Reports refresh each year, with interim edits after large deals, new rules, or disruptive releases, so clients always receive the most current view.
Why Mordor's Enterprise Asset Management Baseline Deserves Trust
Published numbers often differ because each publisher selects unique boundaries, inputs, and refresh rhythms; yet we, according to Mordor Intelligence, narrow these gaps through disciplined scope setting and repeatable checks. Key divergence roots include whether services revenue is counted, handling of hybrid deployments, fleet overlap, currency timing, and expert validation freshness.
Benchmark comparison
| Market Size | Anonymized source | Primary gap driver |
|---|---|---|
| USD 6.70 billion (2025) | Mordor Intelligence | - |
| USD 5.87 billion (2025) | Global Consultancy A | Omits managed service revenue, uses shipment counts |
| USD 8.89 billion (2025) | Industry Journal B | Bundles wider asset software, relies on vendor bookings |
These contrasts show that by aligning with ISO 55000 principles, blending demand and supplier views, and refreshing data on a clear annual cadence, we deliver a balanced, transparent baseline decision-makers can trust.


Key Questions Answered in the Report
What is the projected value of the enterprise asset management market by 2031?
The market is forecast to reach USD 12.07 billion by 2031, growing at a 10.32% CAGR from 2026.
Which deployment model is growing fastest?
Cloud deployments lead both share and growth, holding 62.15% of 2025 revenue and expanding at a 13.05% CAGR through 2031.
Why is healthcare the fastest-growing vertical?
Hospitals need real-time tracking of high-value devices and must meet strict compliance audits, prompting a 15.10% CAGR for healthcare EAM solutions.
How are digital twins impacting asset strategies?
Digital twins give operators a virtual view of equipment, enabling scenario testing that cuts unplanned downtime and extends life cycles, adding roughly 2.1% to the market CAGR.
What challenges limit wider EAM adoption?
Key barriers include legacy OT-IT integration complexity, cybersecurity risks and a shortage of maintenance engineers trained in both mechanical and digital disciplines
Which region is expected to grow quickest?
Asia-Pacific shows the steepest trajectory with a 11.75% CAGR, fuelled by industrialisation, 5G roll-outs and supportive government digitisation programs.
Page last updated on:


