
Intelligent Apps Market Size and Share
Market Overview
| Study Period | 2020 - 2031 |
|---|---|
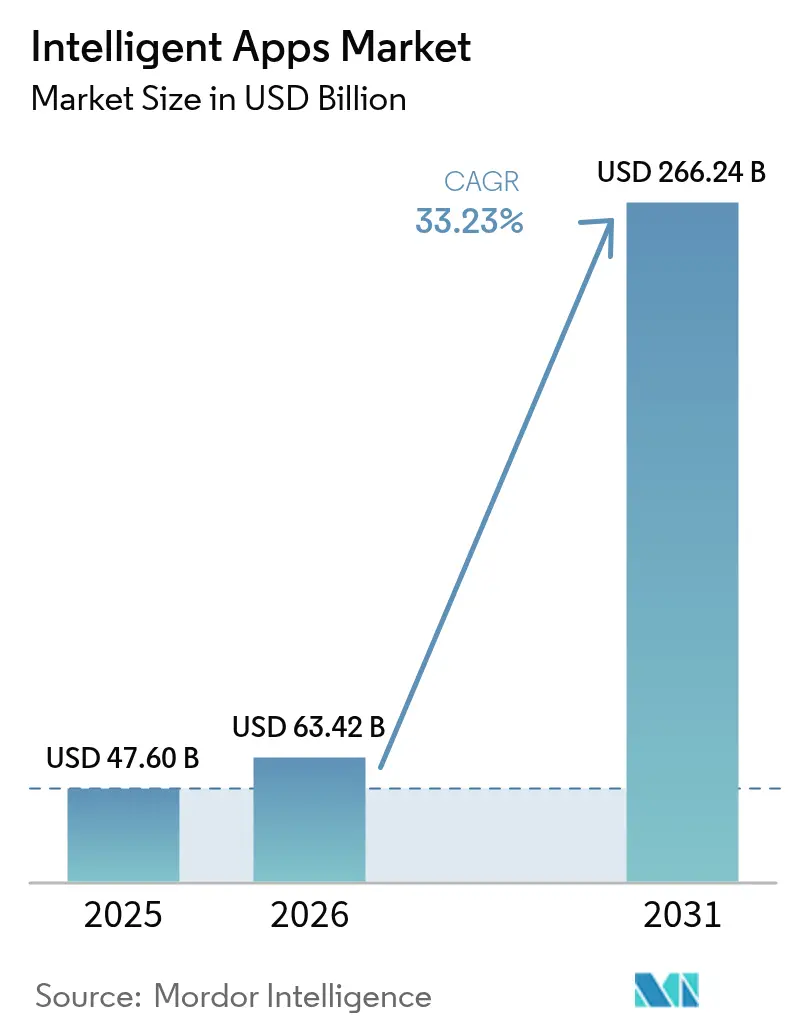
| Market Size (2026) | USD 63.42 Billion |
| Market Size (2031) | USD 266.24 Billion |
| Growth Rate (2026 - 2031) | 33.23 % |
| Fastest Growing Market | Asia Pacific |
| Largest Market | North America |
| Market Concentration | High |
Major Players *Disclaimer: Major Players sorted in no particular order Image © Mordor Intelligence. Reuse requires attribution under CC BY 4.0. | |
Intelligent Apps Market Analysis by Mordor Intelligence
The intelligent apps market size was valued at USD 47.60 billion in 2025 and estimated to grow from USD 63.42 billion in 2026 to reach USD 266.24 billion by 2031, at a CAGR of 33.23% during the forecast period (2026-2031). Rapid enterprise digital-transformation programs are pushing organizations to embed AI directly into everyday software rather than treat it as a bolt-on capability. Cloud-native tooling, pre-trained foundation models and pay-as-you-go compute pricing have removed most capital barriers, allowing even midsized firms to roll out production-grade intelligent applications inside 90 days. On the demand side, business functions now expect real-time personalization and autonomous task automation, shifting AI from experimental pilots to revenue-bearing workloads. The intelligent apps market is also benefiting from a strong mobile hardware refresh cycle that puts dedicated AI accelerators in consumer devices, opening an offline channel for low-latency inference. Finally, tightening accessibility regulations in North America and the EU are turning AI-driven compliance features—such as real-time captioning and adaptive layouts—into mandatory product requirements.
Key Report Takeaways
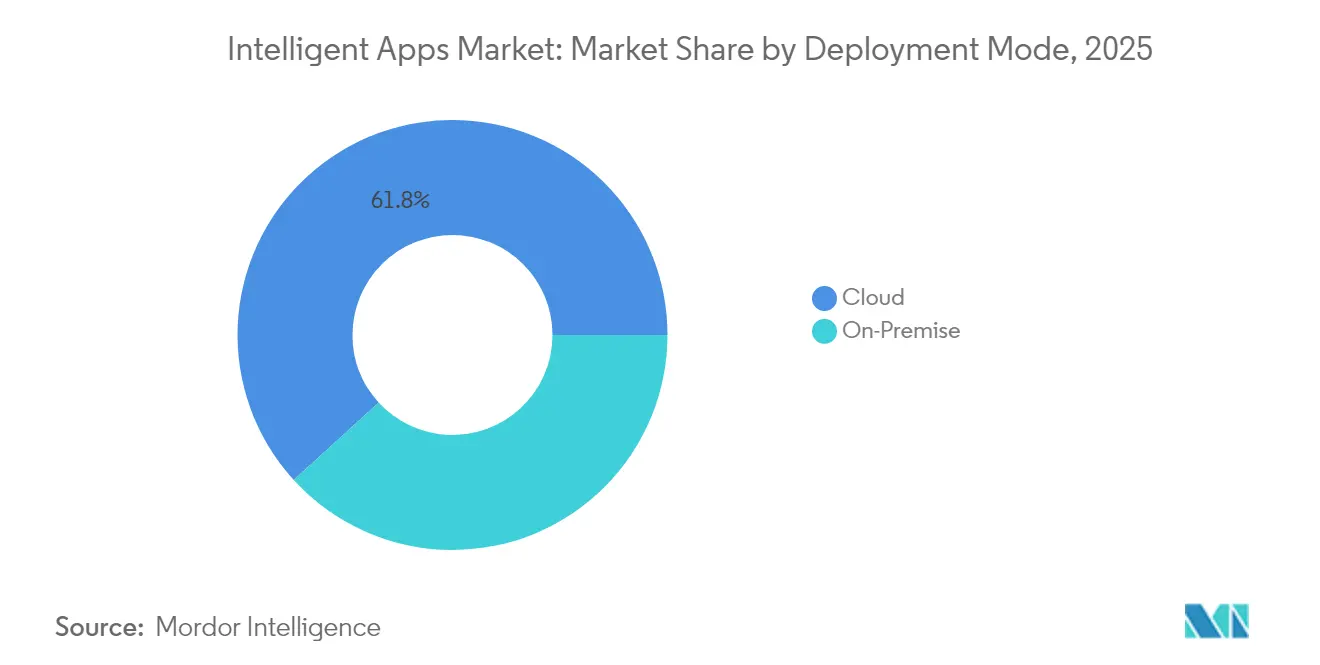
- By deployment mode, cloud services held 61.78% of the intelligent apps market share in 2025 and are growing at a 38.65% CAGR through 2031.
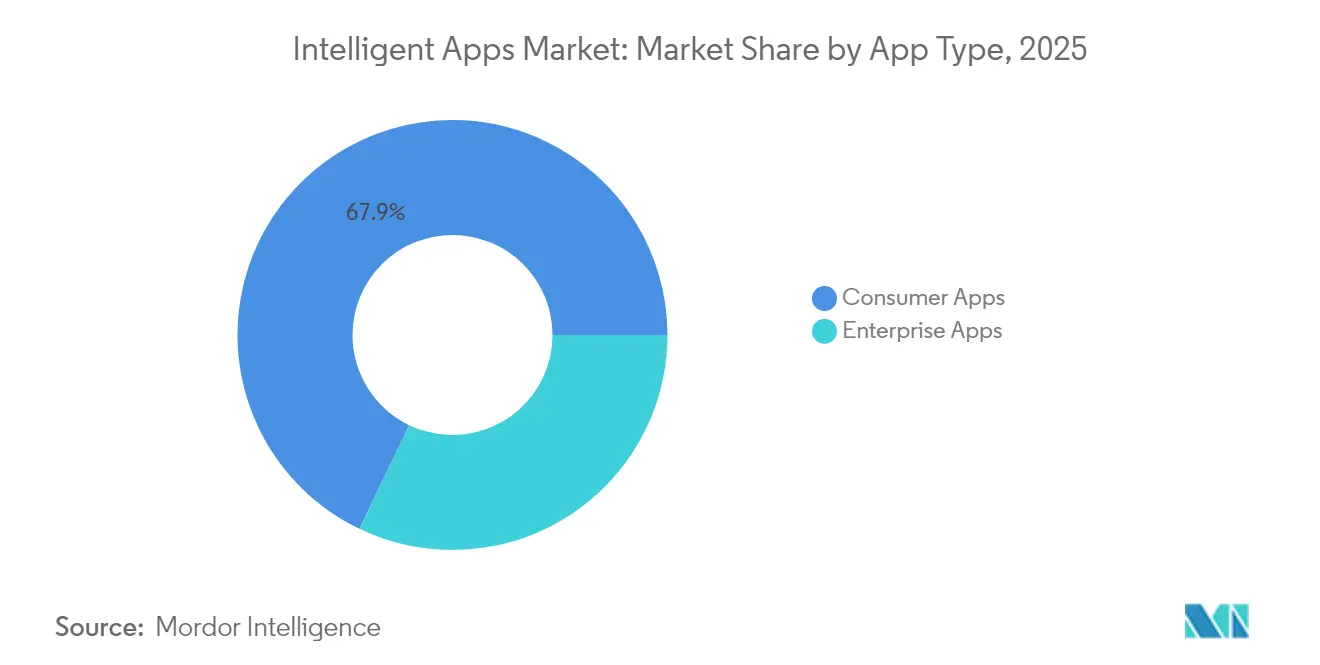
- By application type, consumer apps dominated with 67.88% revenue share in 2025, while enterprise apps post the fastest expansion at 33.75% CAGR.
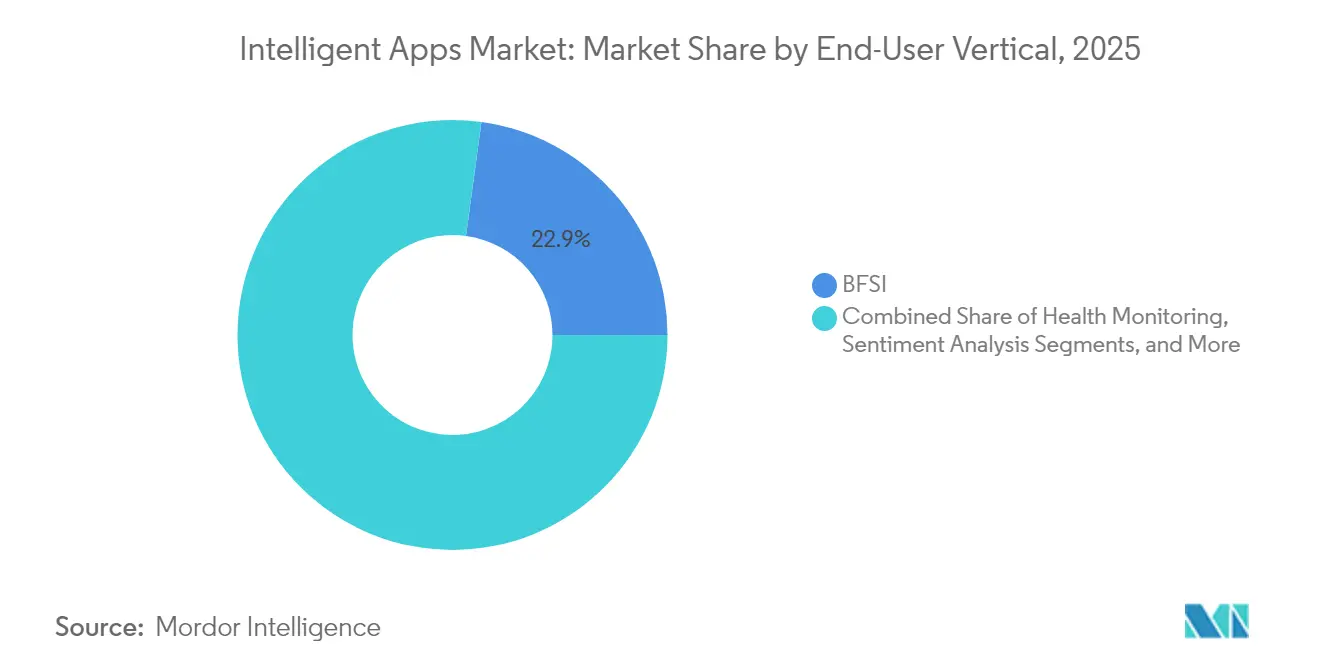
- By end-user vertical, Banking, Financial Services and Insurance contributed 22.85% of the intelligent apps market size in 2025; Healthcare and Life Sciences is advancing at a 33.45% CAGR to 2031.
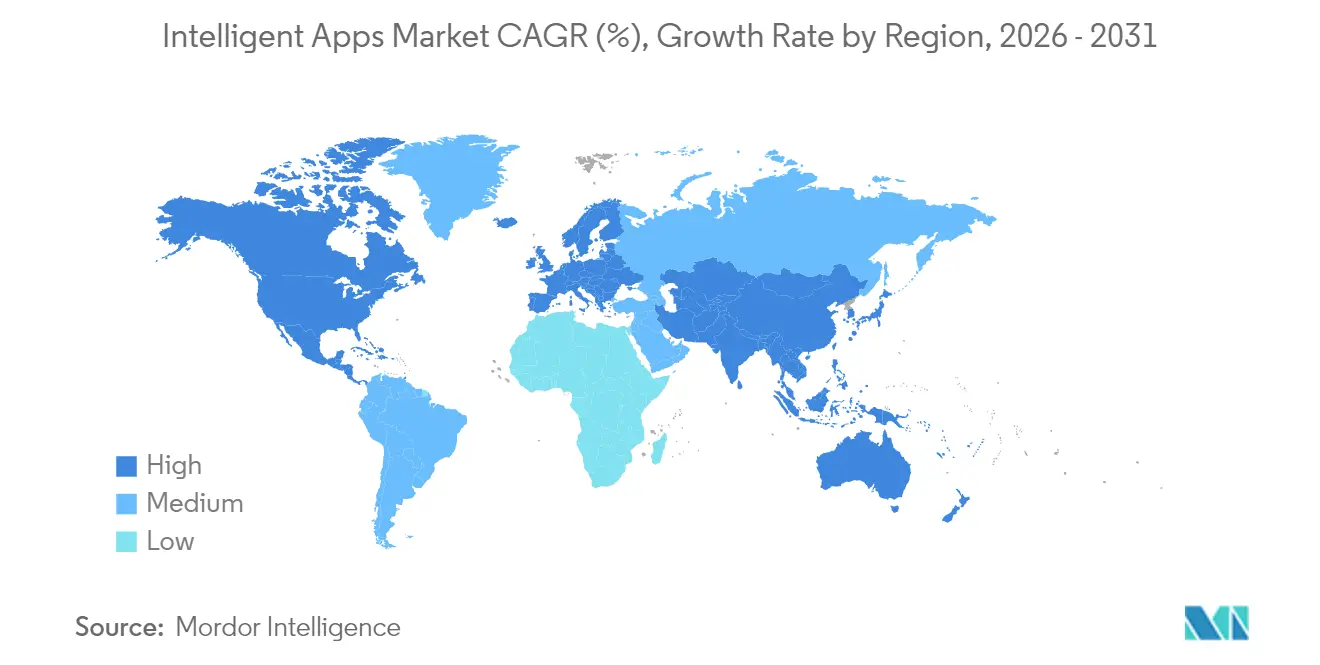
- By geography, North America accounted for 37.55% revenue share in 2025, whereas Asia-Pacific records the quickest growth at 39.18% CAGR.
Note: Market size and forecast figures in this report are generated using Mordor Intelligence’s proprietary estimation framework, updated with the latest available data and insights as of 2026.
Market Trends and Insights
Drivers Impact Analysis of Intelligent Apps Market*
| Driver | ( ~ ) % Impact on CAGR Forecast | Geographic Relevance | Impact Timeline |
|---|---|---|---|
| Smartphone proliferation and mobile-first journeys | +8.2% | Global, led by Asia-Pacific | Medium term (2-4 years) |
| Enterprise AI budgets for intelligent apps | +9.1% | North America and EU, expanding to Asia-Pacific | Short term (≤ 2 years) |
| Cloud AI platforms lowering dev barriers | +7.8% | Global, cloud-first regions | Short term (≤ 2 years) |
| On-device AI accelerators for offline use | +4.3% | North America, China, South Korea | Long term (≥ 4 years) |
| Accessibility regulations | +2.1% | North America and EU | Medium term (2-4 years) |
| Edge AI for millisecond personalisation | +3.0% | Urban 5G-enabled regions worldwide | Long term (≥ 4 years) |
| Source: Mordor Intelligence | |||
Enterprise Digital-Transformation Budgets for AI-Powered Apps
Enterprise AI spending soared 130% in 2024 to USD 13.8 billion as leadership teams prioritized revenue-generating intelligent applications over cost-cutting chatbots. More than half of large companies now expect AI to deliver top-line growth, redirecting budgets away from traditional licenses and toward AI-native platforms. Microsoft alone reported USD 13 billion in AI revenue in 2024 and allocated USD 80 billion to new infrastructure, ensuring adequate GPU capacity for corporate customers.[1]Microsoft Corporation, “FY24 Q4 Earnings Transcript,” microsoft.com Financial firms illustrate the return potential: US banks already route 73% of employee tasks through generative AI helpers, and Citi estimates USD 170 billion in profit uplift by 2028 from intelligent automation. The pattern is similar in logistics, energy and retail where AI agents now supervise high-volume, transaction-heavy workflows.
Cloud AI Platforms Lowering Development Barriers
Public-cloud AI services processed 1.3 million GPU hours in 2024 across Amazon, Microsoft and Google estates, placing industrial-grade model training within reach of mid-level developers. No-code builders and pre-trained vision, speech and language APIs let business analysts create production apps without data-science expertise. While speed-to-value accelerates, governance overhead is rising: chief risk officers must now certify every model for fairness, robustness and explainability before launch. Leaders respond by adopting centralized MLOps hubs that automate version control, bias scans and audit logs, striking a balance between rapid deployment and responsible AI.
Proliferation of Smartphones and Mobile-First Customer Journeys
Mobile AI apps generated USD 3.3 billion in 2024 revenue, up 51% year over year, spurred by device-level neural processors that run complex models locally.[2]Sensor Tower, “Generative AI Mobile App Revenue 2024,” sensortower.com Apple’s integration of ChatGPT into Siri triggered 160 million downloads by August 2024, proving mainstream appetite for conversational interfaces. By end-2028, more than half of new smartphones will ship with generative AI features, creating a vast installed base for developers. For enterprises, a mobile-first strategy slashes latency, cuts cloud egress fees and unlocks new use cases—such as industrial field inspections—where real-time inference is essential even when connectivity is poor.
Embedded On-Device AI Accelerators Enable Offline Intelligence
NVIDIA booked USD 60 billion in 2024 silicon revenue, driven by edge-class GPUs and system-on-a-chip designs for smartphones, cars and IoT rigs. As hardware reaches 10-trillion-operation benchmarks, tasks once reserved for data-center clusters now execute on handheld devices. This shift is critical for autonomous vehicles, smart-factory robots and extended-reality headsets that cannot tolerate cloud round-trip delays. Developers face fresh challenges in pruning and quantizing models to fit power-constrained environments, yet those who succeed enjoy a differentiated UX that operates even in network dead zones.
Restraints Impact Analysis of Intelligent Apps Market*
| Restraint | ( ~ ) % Impact on CAGR Forecast | Geographic Relevance | Impact Timeline |
|---|---|---|---|
| Fragmented app ecosystems and integration complexity | -4.7% | Global, affects cross-platform builds | Short term (≤ 2 years) |
| Data-privacy compliance (GDPR, CPRA) | -3.2% | EU, California, spreading worldwide | Medium term (2-4 years) |
| Shortage and cost of specialised AI hardware | -2.8% | Global supply chains | Medium term (2-4 years) |
| Brand-risk from algorithmic bias litigation | -1.9% | North America and EU courts | Long term (≥ 4 years) |
| Source: Mordor Intelligence | |||
Fragmented App Ecosystems and Integration Complexity
Developers must now reconcile half-century-old industrial controllers, three generations of ERP suites and half-dozen mobile OS versions when rolling out unified intelligent apps. The resulting integration bills can consume 20% of total project spend, especially in manufacturing where legacy machinery still lacks modern APIs. Hybrid deployments add layers of orchestration, forcing teams to juggle latency, security and data-sovereignty constraints across cloud and on-prem nodes. Vendors are countering with universal connectors and AI-centric event buses, yet interview data from CIOs suggests full interoperability will remain elusive for at least two more years.
Data-Privacy Compliance (GDPR, CPRA, etc.)
Europe’s GDPR and California’s CPRA mandate consent dashboards, algorithmic transparency and data-minimization routines that frequently strip training sets of valuable context. Financial institutions now devote up to 15% of AI budgets to compliance tooling, including data-lineage trackers and synthetic-data generators that offset access limits. Multinationals often choose to implement the strictest regional standard worldwide to avoid code forks, pushing smaller firms toward managed-service providers that bake compliance into the platform. Over the medium term, privacy-enhancing techniques such as federated learning and homomorphic encryption may lower the overhead, but current deployments still face extended testing and audit cycles.
*Our forecasts treat driver/restraint impacts as directional, not additive. The impact forecasts reflect baseline growth, mix effects, and variable interactions.
Intelligent Apps Market Segment Analysis
By Deployment Mode:
Cloud Dominance Accelerates Enterprise MigrationCloud deployments captured 61.78% of the intelligent apps market size in 2025, and the same segment is expanding at a 38.65% CAGR thanks to elastic GPU clusters and consumption-based pricing. Enterprises value the ability to spin up sandbox environments in minutes, run experiments against terabyte-scale datasets and then retire resources when finished. Meanwhile, procurement leaders report a 2-to-1 reduction in time-to-value compared with on-prem refresh cycles. A counter-trend is visible: 47% of large organizations are building GenAI workloads in-house, eyeing hybrid patterns that keep sensitive data close while exploiting cloud for burst training. Analysts note that on-prem-centric designs may cut recurring inference costs by as much as one-third for high-volume use cases.
On-premises systems, although smaller in share, are benefitting from purpose-built AI servers from HPE and Dell that bundle accelerators, high-bandwidth memory and turnkey MLOps stacks. HPE grew AI hardware revenue 16% to USD 1.5 billion in 2024, affirming latent demand among regulated industries that prize data residency and predictable latency. As a result, hybrid topologies—cloud for model development, edge or data-center for inference—are poised to define the next phase of intelligent apps market evolution.



By App Type:
Consumer Volume Meets Enterprise Value CreationConsumer-facing software delivered 67.88% of 2025 revenue, fuelled by viral companion bots and generative content tools. Network effects and app-store distribution create massive user pools where even freemium conversion rates of 3% translate into tens of millions in annual sales. Nevertheless, enterprise-grade offerings deliver higher per-seat economics, driving a 33.75% CAGR for business deployments through 2031. Corporate buyers value deep integrations with ERP, CRM and unified communications stacks that magnify productivity across thousands of employees. Microsoft’s Copilot suite showcases this dynamic, with firms reporting measurable gains that offset subscription costs in under six months. As workflows hard-wire AI agents into approval chains and knowledge bases, switching costs escalate, reinforcing vendor lock-in and expanding lifetime value.
By End-User Vertical:
Financial Services Leads, Healthcare AcceleratesBanking, Financial Services and Insurance captured 22.85% of the intelligent apps market share in 2025, the largest slice within any vertical. Institutions deploy AI agents for fraud detection, customer-service chat, and real-time compliance checks that interpret complex regulations more reliably than human teams. Pioneers such as Bank of America’s Erica and Wells Fargo’s AI fraud monitors show how conversational interfaces and continuous risk scoring shorten response times while reducing manual effort. Insurers mirror this trend by automating claims triage and policy underwriting, freeing specialist staff for higher-value advisory roles. As a result, BFSI remains the anchor customer group for platform vendors that need high-volume, high-value reference wins to validate enterprise performance.
Healthcare and Life Sciences is the fastest-growing vertical, advancing at a 33.45% CAGR through 2031 as hospitals and research centers seek to curb clinician burnout and improve diagnostic accuracy. Outside the two headline sectors, retail, manufacturing, telecoms, education and hospitality are scaling pilot projects that personalize shopping journeys, optimize factory maintenance and automate campus-wide helpdesks. Each niche rewards domain-specific data and compliance expertise, giving rise to specialist vendors that complement broad cloud platforms rather than compete head-on.
Geography Analysis
North America Intelligent Apps Market
North America commanded 37.55% of 2025 revenue, making it the largest regional contributor to the intelligent apps market. The region benefits from abundant venture capital, dense clusters of AI talent and mature cloud infrastructure. US companies alone poured USD 290 billion into AI R&D over the past five years, speeding commercialization across banking, healthcare and advanced manufacturing. Regulatory frameworks—such as NIST’s AI Risk Management Framework—offer clear guardrails that balance innovation with consumer protection, further strengthening adoption momentum.
APAC Intelligent Apps Market
Asia-Pacific is the growth engine, projected to compound at 39.18% annually through 2031. China’s USD 2.1 billion public-sector investment and Singapore’s USD 1 billion National AI Strategy 2.0 supply both capital and policy tailwinds. Mobile-first digital economies, combined with large manufacturing bases, create immediate demand for predictive maintenance, quality control and hyper-personalized commerce. Local hyperscalers, including Alibaba Cloud and Tencent Cloud, add language-specific models that accelerate regional uptake.
Europe Intelligent Apps Market
Europe occupies a middle ground where the intelligent apps market grows steadily under stricter privacy rules. The forthcoming AI Act requires mandatory risk assessments and transparency labels, nudging vendors toward explainable architectures and privacy-preserving techniques. While compliance adds friction, it also positions European providers as trusted partners for critical sectors such as healthcare and public administration, creating a differentiated export opportunity.
MEA and South America Intelligent Apps Market
South America, the Middle East and Africa remain nascent but promising. Telecom operators are rolling out low-code AI platforms that allow small retailers and fintech startups to embed chat and voice bots without in-house data-science teams. Government-backed digital-ID programs in Brazil and the UAE further expand addressable use cases by providing standardized data sources for KYC and fraud analytics.

Regulatory Landscape
Intelligent apps face tightening requirements around privacy, transparency, and model governance that shape product design, data handling, and user disclosures. In the European Union, the EU AI Act entered into force on 1 August 2024 and is rolling out in phases, with Article 50 transparency obligations for chatbots and synthetic-content labeling becoming enforceable from 2 August 2026, alongside market surveillance authority actions. The European Commission also issued implementation guidance for these transparency obligations in July 2026, clarifying expectations for providers and deployers.
In the United States, policy direction continues to point toward voluntary, industry-led standards rather than licensing or preclearance. NIST launched the AI Agent Standards Initiative in February 2026 to develop technical standards and open protocols for autonomous AI agents, aligning with enterprise adoption of agentic workflows inside applications. In June 2026, the White House issued an executive action focused on promoting advanced AI innovation and security, including measures that shape how frontier-model capabilities are evaluated and accessed, which keeps governance, documentation, and security features embedded in intelligent applications part of the mainstream procurement checklist.
Value Chain Analysis
The intelligent apps value chain starts with data acquisition and preparation (first-party enterprise and consumer data, third-party datasets, and synthetic data generation), then model supply (hyperscalers and model providers offering foundation models and APIs), followed by application development and orchestration (agent frameworks, RAG pipelines, MLOps, security and identity, observability), and finally distribution and operations through cloud marketplaces, app stores, system integrators, and managed-service providers. Cloud platforms remain the primary route for scaling training and inference, while on-device deployment depends on chip and device ecosystems that support local inference and offline functionality.
Bottlenecks increasingly cluster around integration, governance, and runtime operations rather than basic model access. Legacy application and ERP environments often lack machine-readable APIs for multi-step agent workflows, which shifts spend toward connectors, event buses, and orchestration layers that can safely invoke business systems. Infrastructure friction also shows up in GPU availability, topology-aware scheduling, and egress and data-movement costs at scale, raising the role of platform engineering, FinOps, and security tooling. As agentic applications expand inside core enterprise suites, buyers increasingly rely on systems integrators and platform partners for reference architectures that combine model endpoints, policy controls, audit logging, and production monitoring.
Competitive Landscape
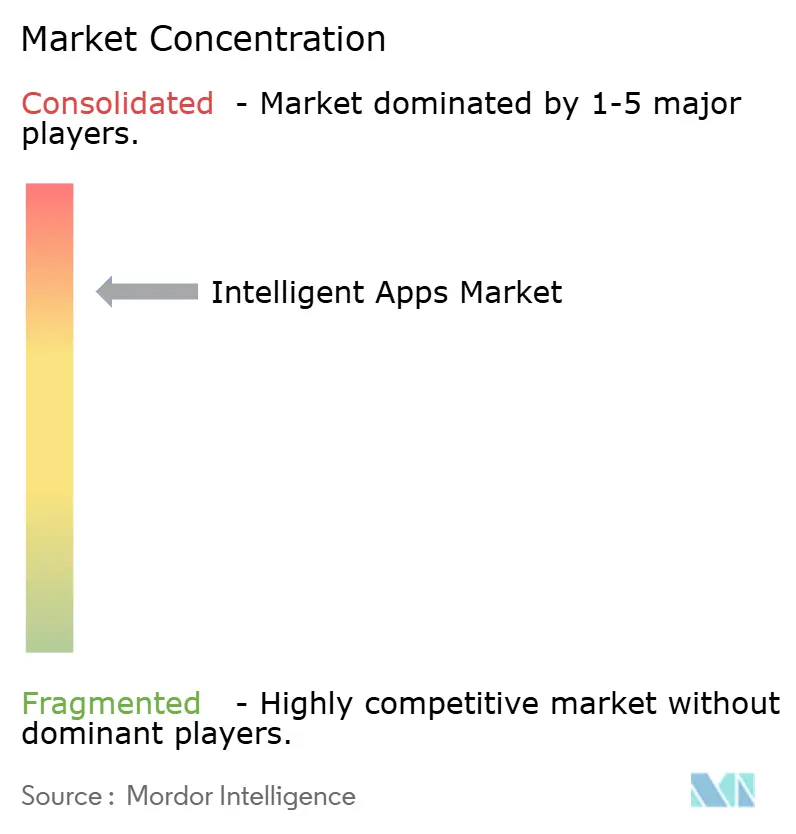
The intelligent apps market displays moderate concentration. Platform giants—Microsoft, Amazon, Google and Apple—anchor end-to-end stacks that span cloud infrastructure, orchestration frameworks and consumer endpoints. Microsoft posted USD 13 billion in AI revenue for 2024 and earmarked USD 80 billion for additional data-center build-outs, cementing scale economics that discourage new entrants. Rather than acquire outright, incumbents increasingly opt for minority stakes or joint ventures to secure frontier models while sidestepping antitrust scrutiny. Meta’s USD 14.3 billion investment for 49% of Scale AI typifies this partnership model, allowing Meta to tap curated data pipelines without dismantling Scale’s multi-client business.[3]IBM, “Global AI Adoption Index 2024,” ibm.com
White-space opportunities persist in vertical niches requiring domain know-how and compliance IP. Startups focusing on clinical-decision support, risk analytics or autonomous factory lines leverage specialized datasets and subject-matter expertise to differentiate. Incumbent ERP providers also wield influence: SAP, Oracle and Salesforce embed AI across order management and HR modules, bundling features at marginal cost to defend against stand-alone disruptors. Looking forward, open-source foundation models and sovereign-cloud initiatives may loosen platform lock-in, but network effects around data and distribution will keep bargaining power tilted toward ecosystem leaders.
Intelligent Apps Industry Leaders
IBM Corporation
Apple Inc,
Microsoft Corporation
Google LLC
Amazon Web Services
- *Disclaimer: Major Players sorted in no particular order
Intelligent Apps Market Companies Covered in this Report
- Microsoft Corporation
- Amazon Web Services Inc.
- Google LLC
- Apple Inc.
- IBM Corporation
- Oracle Corporation
- Salesforce Inc.
- SAP SE
- Baidu Inc.
- Intel Corporation
- Hewlett Packard Enterprise
- Clarifai Inc.
- Adobe Inc.
- ServiceNow Inc.
- Alibaba Cloud (Alibaba Group)
- Tencent Holdings Ltd.
- NVIDIA Corporation
- UiPath Inc.
- Zoho Corporation
- Workday Inc.

Market Opportunities and Future Outlook
Near-term whitespace centers on governed agent building and operations inside the systems where enterprises already run finance, HR, supply chain, and customer operations. Oracle introduced an AI-native builder experience for Oracle AI Agent Studio in July 2026, enabling agent creation and deployment directly within Oracle Fusion Cloud Applications, while SAP expanded SAP Business AI with an SAP AI Agent Hub in July 2026 to manage AI agents and LLMs across enterprise environments. These moves point to demand for specialist vendors and integrators that provide orchestration, RAG grounding, testing, and policy enforcement across heterogeneous stacks, particularly for customers running hybrid topologies.
A second opportunity is compliance-by-design and security hardening as standards and enforcement timelines become more concrete. ETSI released ETSI EN 304 223 in May 2026 to define baseline cybersecurity requirements for AI systems across the lifecycle, and the European Commission issued transparency guidance in July 2026 tied to EU AI Act obligations effective 2 August 2026. In parallel, the White House June 2026 executive action highlighted benchmarking and secure innovation for advanced AI models, reinforcing demand for auditable model usage, content labeling, access controls, and monitoring. Vendors that package these controls as reusable components, and pair them with tools that reduce integration burden with legacy systems, can address an ongoing blocker to moving intelligent apps from pilots into production.
Recent Industry Developments in Intelligent Apps Market
- July 2026: IBM announced updates to its IBM Bob agentic software development platform, adding multi-agent capabilities and specialized modernization workflows for IBM Z, IBM i, and Java environments. The release targets enterprise application modernization where intelligent features must be embedded into legacy estates, expanding addressable use cases beyond greenfield cloud apps.
- June 2026: IBM and Google Cloud announced a strategic partnership to scale AI with human expertise and AI-powered delivery, including the launch of a Google Cloud Practice within IBM Consulting. The collaboration links IBM Consulting Advantage with Gemini Enterprise capabilities, strengthening enterprise delivery capacity for intelligent applications built on cloud platforms.
- June 2025: Meta invested USD 14.3 billion for a 49% stake in Scale AI and aligned leadership around advancing frontier AI research. The move reinforced the strategic importance of high-quality data and labeling pipelines, a key input that affects the performance and reliability of intelligent applications.


Intelligent Apps Market Report Scope and Research Methodology
Market Definition and Coverage
For this study, the intelligent apps market covers software applications sold or delivered through the cloud where embedded AI meaningfully changes the user experience through learning, prediction, or automated decisions over time.
Scope exclusions: We exclude AI infrastructure tools, standalone developer frameworks, and traditional rule based apps that do not include a self learning loop.
Segments Covered in This Report
- By Deployment Mode
- On-Premise
- Cloud
- By App Type
- Consumer Apps
- Enterprise Apps
- By End-User Vertical
- BFSI
- Retail and E-commerce
- Healthcare and Life Sciences
- Media and Entertainment
- Telecom and IT
- Hospitality and Travel
- Manufacturing
- Education
- By Geography
- North America
- United States
- Canada
- Mexico
- South America
- Brazil
- Argentina
- Rest of South America
- Europe
- Germany
- United Kingdom
- France
- Italy
- Russia
- Spain
- Switzerland
- Rest of Europe
- Asia-Pacific
- China
- India
- Japan
- South Korea
- Malaysia
- Singapore
- Vietnam
- Indonesia
- Rest of Asia-Pacific
- Middle East and Africa
- Middle East
- Saudi Arabia
- United Arab Emirates
- Turkey
- Rest of Middle East
- Africa
- Nigeria
- South Africa
- Rest of Africa
- Middle East
- North America
Data Sources, Market Sizing, and Validation
Desk Research
Desk research was used to set clean boundaries for what counts as an intelligent app and what sits outside the market, which is important in software because categories overlap fast. We reviewed public sources such as NIST AI resources, OECD AI policy materials, U.S. Bureau of Economic Analysis digital economy releases, Eurostat ICT statistics, and ITU indicators to understand adoption signals and country level digital readiness.
We also used company filings, investor presentations, earnings call transcripts, product documentation, and reputable press to map product positioning and how vendors describe embedded AI features across app portfolios. For cross checks, we referenced paid subscriptions that help with company financials and intelligence, patent databases, and news and financials, since these are useful for tracking product launches, partnerships, and commercialization pace. The desk research sources listed here are illustrative, and many other public documents and datasets were also reviewed to collect, verify, and clarify inputs.
Primary Interviews and Surveys
Primary work was used to pressure test assumptions that are hard to see in public documents, especially what buyers pay for AI enabled features and how fast deployments move from pilot to scaled use. We spoke with demand side leaders and supply side experts across key regions, so adoption patterns in North America, Europe, and Asia were reflected in the final model.
Distribution of primary research fieldwork respondents
| Company type | Respondent position | Region |
|---|---|---|
| Top tier: 33% | CXOs: 14% | APAC: 45% |
| Mid tier: 51% | Functional/Unit leaders: 27% | EMEA: 33% |
| Smaller Players: 16% | Managers: 59% | Americas: 22% |
Market-Sizing & Forecasting
The sizing starts with a top-down build where software spend is reconstructed into a demand pool for AI shaped applications, and then filtered by adoption rates that were validated by interviews. Once that spine was built, selective bottom-up approximations were used to keep totals realistic, such as sampled price per user or per workload times the implied user base, and channel checks on packaged versus cloud delivery.
Key inputs were kept practical and repeatable, including cloud application adoption rates, enterprise AI feature attach rates within common app categories, subscription pricing ranges, seat or active user expansion patterns, and the pace of new feature launches tied to machine learning and natural language interfaces. Where a bottom-up view had gaps (for example, when revenue is reported inside a broader software line item), we used conservative allocation keys based on product mix statements and then revalidated the split through primary feedback.
For forecasting, scenario analysis was used so growth can be linked to a small set of observable drivers, including enterprise AI budgets, cloud migration pace, regulatory attention on AI use in apps, and expected shifts in pricing from bundled to usage based models. The final forecast path was selected after checking that regional growth and product adoption patterns stayed consistent with expert expectations and with past software cycle behavior.
Data Validation & Update Cycle
Outputs were checked through several steps so the numbers do not rely on one assumption. We compared results against independent signals such as reported software revenue trends, AI feature adoption statements, and regional digital readiness indicators, and then investigated outliers before sign off.
When large variances showed up across regions or app types, we rechecked definitions, currency conversions, and implied pricing, and then followed up with additional expert inputs if needed. The report is refreshed annually, with interim updates when major product shifts, regulations, or macro events materially change demand. Before delivery, an analyst completes a fresh review pass so clients receive the most current view supported by the same repeatable steps.
Mordor Intelligence's Intelligent Apps Market Sizing Compared With Other Published Estimates
Published market sizes can look far apart because intelligent apps sit close to broader AI software and cloud application categories, so even small boundary choices can move the total. Differences also come from how providers treat bundled AI features versus separately priced add ons, and from which year is used as the anchor for growth.
Cloud app adoption signals, AI feature attach rates discussed in interviews, and vendor revenue mix disclosures are the checks that tie Mordor Intelligence's estimate to applications where embedded AI actively shapes user workflows, instead of counting adjacent AI tools that do not function as an end user app. When other publishers expand scope into app store economics, managed services, or wider AI software, the market total increases quickly, and the spread can remain even if the growth story is similar.
Benchmark comparison
| Source | Market Size | Gaps in Research Methodology |
|---|---|---|
| Mordor Intelligence | USD 63.42 B (2026) | |
| Trade Journal A | USD 95.70 B (2022) | Uses an earlier base year and a broader software framing that can capture more AI enabled application revenue that is not strictly tied to intelligent app specific functionality, and this can shift the starting point upward. |
| Regional Consultancy B | USD 40.99 B (2024) | Includes additional layers such as app store type and services around deployments, which can change what is counted as market revenue and can also alter pricing assumptions used in the model. |
The table shows that year selection and scope are the two biggest reasons totals diverge, especially in software markets that bundle features. By keeping the counted revenue tied to AI shaped application usage and then cross checking prices and adoption with interviews, the final number stays traceable to clear inputs that can be reviewed and repeated.


Key Questions Answered in the Report
What is the current intelligent apps market size?
The intelligent apps market size stands at USD 63.42 billion in 2026 and is projected to reach USD 266.24 billion by 2031.
Which deployment model grows fastest?
Cloud deployments exhibit the quickest expansion, registering a 38.65% CAGR while already holding 61.78% share in 2025.
Which is the fastest growing region in Intelligent Apps Market?
Asia Pacific is estimated to grow at the highest CAGR over the forecast period (2026-2031).
Which vertical generates the highest revenue today?
Banking, Financial Services and Insurance leads, accounting for 22.85% of 2025 revenue as institutions deploy intelligent apps for fraud detection and customer service.
Which region offers the strongest growth outlook?
Asia-Pacific is forecast to rise at a 39.18% CAGR through 2031, buoyed by large-scale government AI investments and mobile-first digital economies.
How are regulations shaping intelligent app design?
GDPR, CPRA and upcoming EU AI Act rules require privacy-by-design, algorithmic transparency and risk assessments, prompting vendors to embed compliance mechanisms from the outset.
Page last updated on:


 Your data is secure and never sold or shared.


