App Development Market Size and Share
Market Overview
| Study Period | 2020 - 2031 |
|---|---|
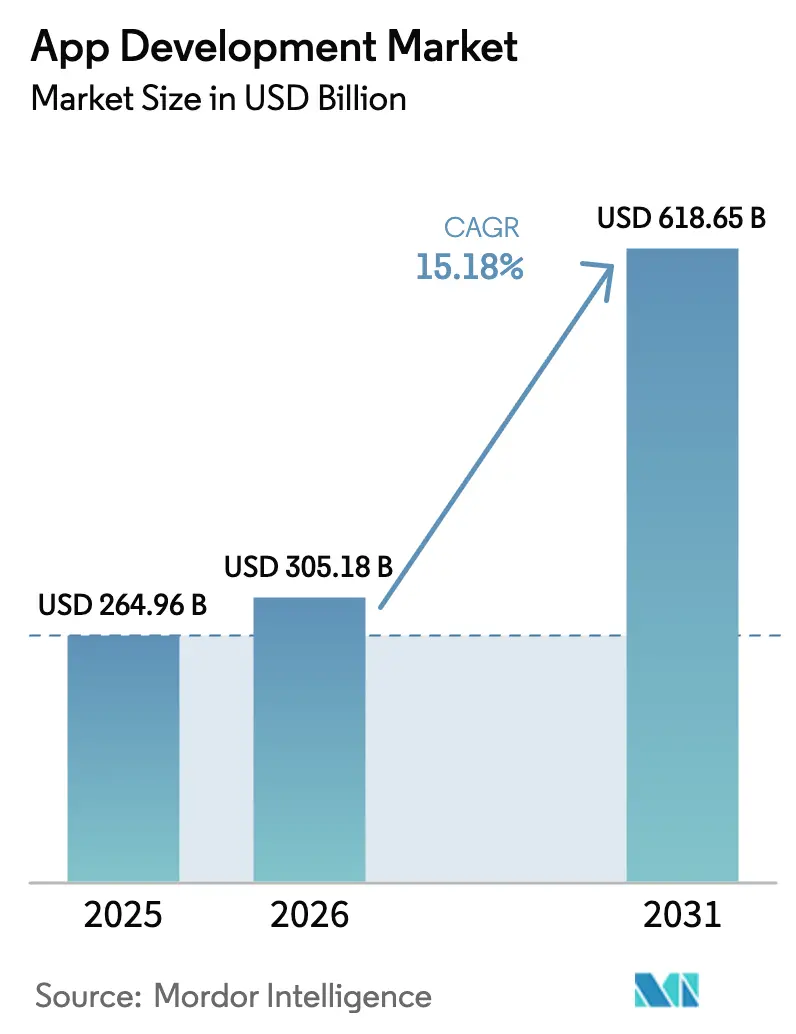
| Market Size (2026) | USD 305.18 Billion |
| Market Size (2031) | USD 618.65 Billion |
| Growth Rate (2026 - 2031) | 15.18% CAGR |
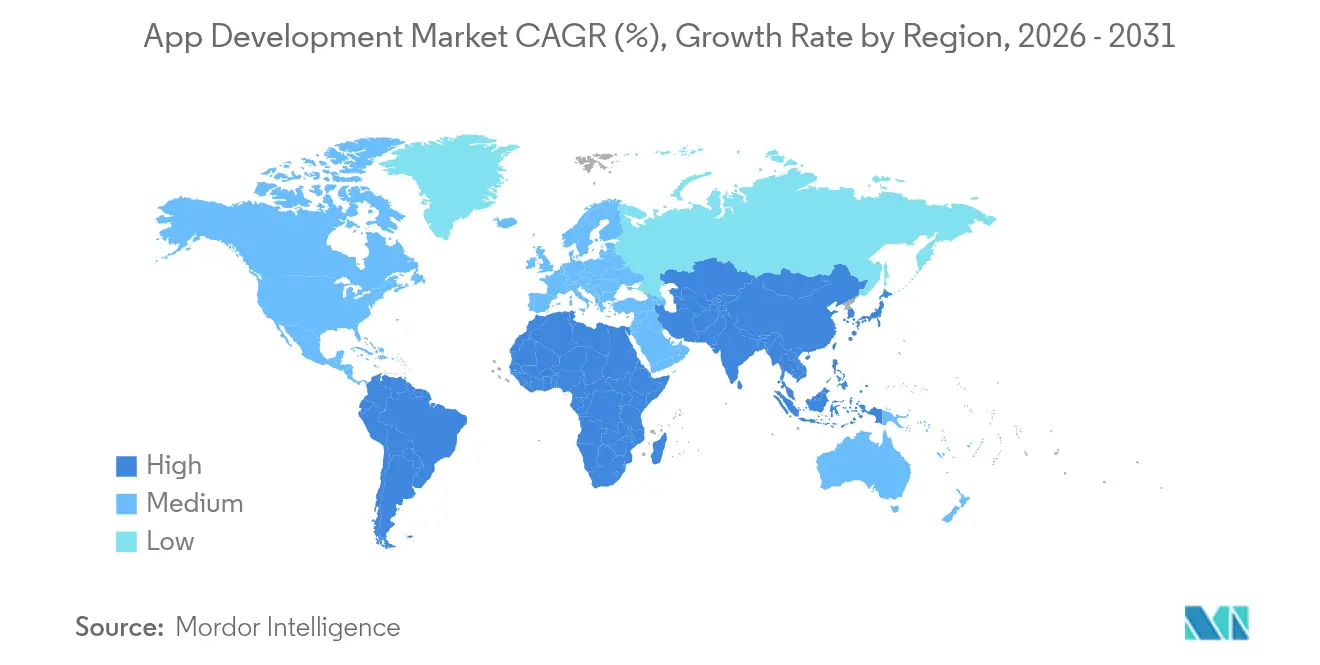
| Fastest Growing Market | Asia Pacific |
| Largest Market | Asia Pacific |
| Market Concentration | Medium |
Major Players *Disclaimer: Major Players sorted in no particular order Image © Mordor Intelligence. Reuse requires attribution under CC BY 4.0. | |
App Development Market Analysis by Mordor Intelligence
The App Development Market size was valued at USD 264.96 billion in 2025 and estimated to grow from USD 305.18 billion in 2026 to reach USD 618.65 billion by 2031, at a CAGR of 15.18% during the forecast period (2026-2031).
Rapid digitization, record levels of enterprise IT outlays, and a decisive pivot toward intuitive low-/no-code toolchains explain most of the expansion. Generative AI is reducing coding effort while citizen-developer programs let business teams ship minimum-viable products in days, helping enterprises contain developer shortages. Cloud-native patterns coupled with 5G-enabled edge nodes improve latency-sensitive workloads and attract new demand from manufacturing, automotive, gaming, and healthcare. Regionally, Asia-Pacific leads on both absolute volume and speed thanks to vast mobile-first user bases, supportive policy frameworks, and super-app ecosystems that insist on frequent feature refreshes.
Key Report Takeaways
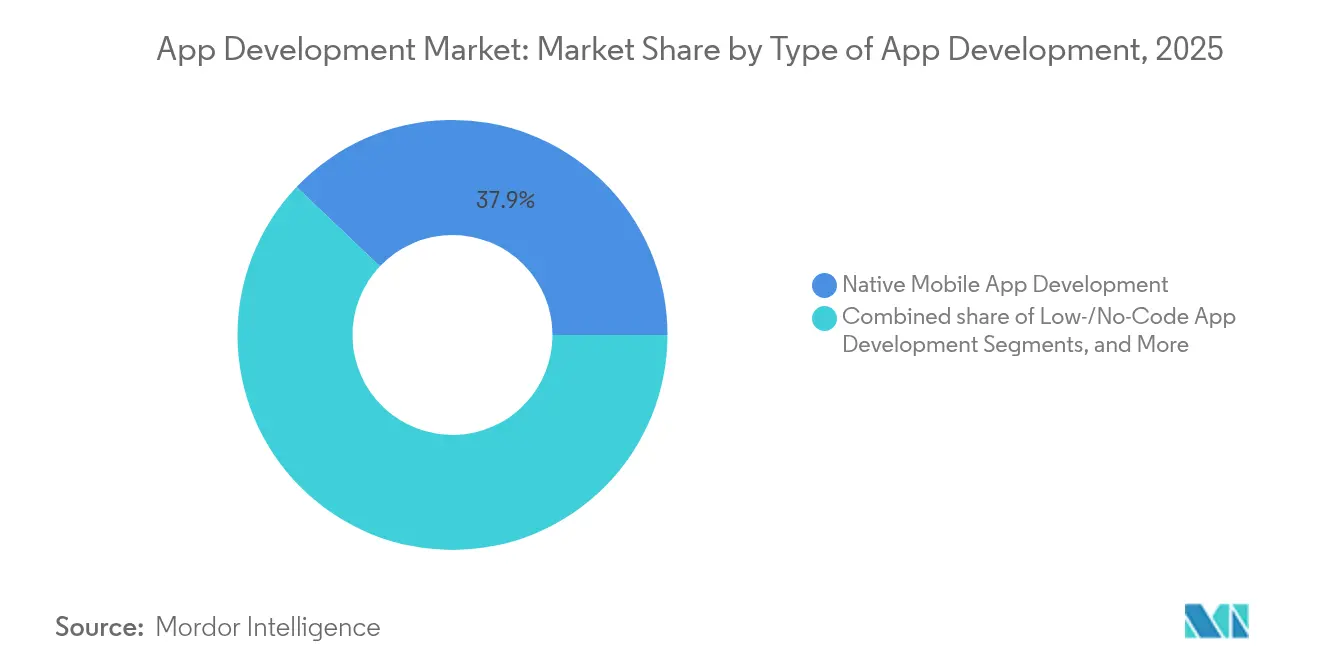
- By type of app development, low-/no-code platforms secured 29.65% CAGR through 2031 while native mobile maintained 37.92% revenue share in 2025.
- By deployment model, cloud-based delivery held 57.35% of App Development market share in 2025 and is forecast to grow at 21.8% CAGR.
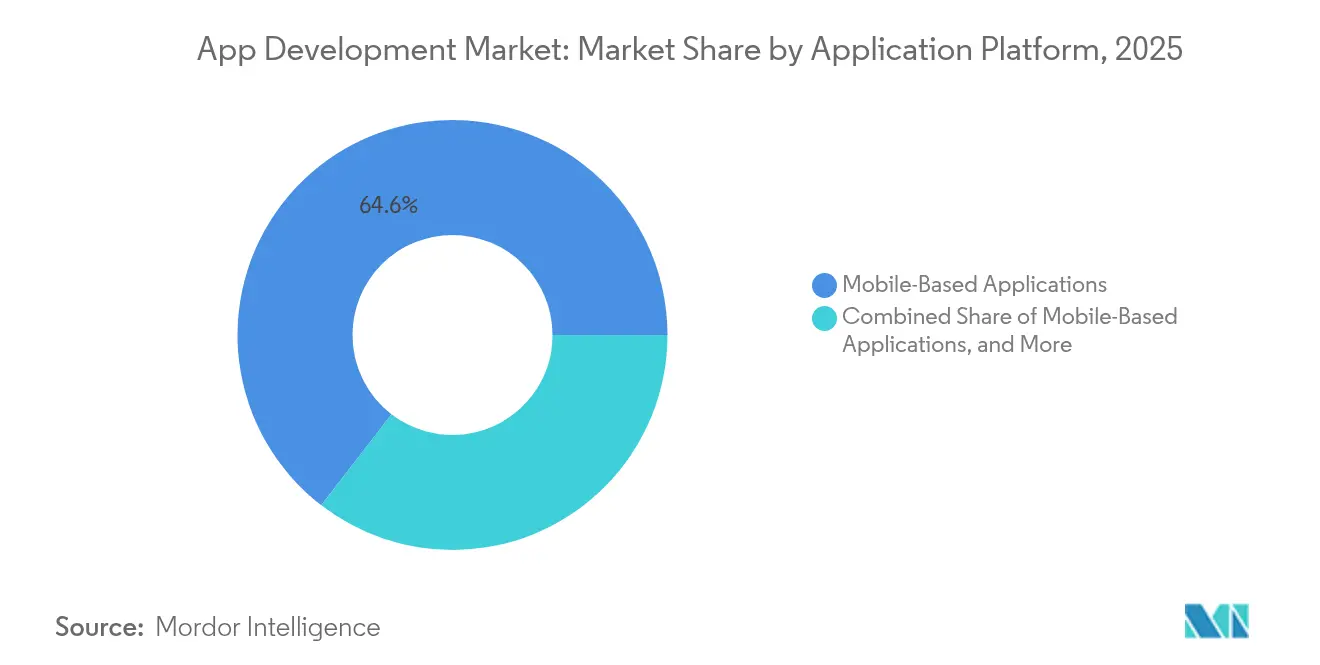
- By application platform, mobile commanded 64.55% share of the App Development market size in 2025; multiexperience solutions record the strongest 18.1% CAGR to 2031.
- By end-user industry, gaming contributed 39.6% of revenue in 2025 whereas health-and-fitness apps are expanding at 19.9% CAGR.
- By geography, Asia-Pacific led with 38.05% revenue share in 2025 and continues to post an 17.9% CAGR through 2031.
Note: Market size and forecast figures in this report are generated using Mordor Intelligence’s proprietary estimation framework, updated with the latest available data and insights as of 2026.
Global App Development Market Trends and Insights
Drivers Impact Analysis*
| Driver | (~) % Impact on CAGR Forecast | Geographic Relevance | Impact Timeline |
|---|---|---|---|
| Explosion in citizen-development and low-code platforms | +4.2% | Global; strongest in North America and Europe | Medium term (2-4 years) |
| Integration of generative AI into dev toolchains | +3.8% | Global; led by North America and Asia-Pacific | Short term (≤2 years) |
| 5G and edge computing enable richer UX | +2.1% | Asia-Pacific core; spill-over to North America and Europe | Long term (≥4 years) |
| Accelerated digital transformation budgets | +2.9% | Global; emphasis on developed markets | Medium term (2-4 years) |
| Enterprise demand for multiexperience apps | +1.8% | North America and Europe; expanding to Asia-Pacific | Medium term (2-4 years) |
| Rise of super-apps in emerging markets | +1.4% | Asia-Pacific, Middle East, Latin America | Long term (≥4 years) |
| Source: Mordor Intelligence | |||
Explosion in citizen-development and low-code platforms
Business users are now assembling sophisticated workflows with drag-and-drop configurators, shrinking release cycles from quarters to weeks. Microsoft Power Apps demonstrates scale, integrating pretrained AI models that automate form recognition and chat responses. More than 60% of CIOs cite acute developer shortages, making low-code the fastest workaround [1]Alpha Software, “CIO Survey: 60% Report Developer Shortage,” alphasoftware.com. Vertical flavours—such as HIPAA-ready templates for hospitals—signal maturing demand. As integration connectors grow, the App Development market welcomes participants previously locked out by coding barriers.
Integration of generative-AI into dev toolchains
Code-completion agents like GitHub Copilot and AWS Q Developer raise individual throughput by nearly 20%, allowing teams to redirect hours toward design and security reviews. IBM’s AI-assisted portfolio surpassed USD 6 billion in quarterly revenue in 2025, proving that large enterprises actively procure AI-native tooling. Secure sandboxes from Gitpod mitigate data-leak risks when models ingest proprietary code. Beyond code, AI now autowrites test cases, documentation, and CI/CD scripts, embedding intelligence across the full software supply chain.
5G and edge computing enable richer UX
Ultra-low-latency links let apps process data near the point of generation, which benefits AR collaboration, connected vehicles, and industrial automation. MongoDB’s work with Verizon 5G Edge illustrates how local data tiers deliver sub-50 ms round-trips for inventory updates. Asia-Pacific is adding tenfold more 5G lines by 2030 than any other region, ensuring a receptive base for bandwidth-intensive services. Red Hat supports hybrid control planes so developers deploy containers seamlessly from core clouds to ruggedized edge clusters.
Accelerated digital transformation budgets
Boards treat software as primary value creation, steering roughly 15% of IT allocations into retiring technical debt while funding cloud-native pilots that modernize legacy estates. As competitive gaps shrink across sectors, incremental digital features—such as instant credit scoring inside retail apps—become must-have. The resulting project pipeline sustains double-digit growth in the App Development market despite cyclical macro pressures.
Restraints Impact Analysis*
| Restraint | (~) % Impact on CAGR Forecast | Geographic Relevance | Impact Timeline |
|---|---|---|---|
| Stricter app-store privacy requirements | -1.9% | Global; stronger enforcement in North America and Europe | Short term (≤2 years) |
| Talent shortage of full-stack developers | -2.3% | Global; acute in North America and Europe | Medium term (2-4 years) |
| Fragmented device/OS ecosystem escalates QA cost | -1.1% | Global; higher impact in diverse regions | Medium term (2-4 years) |
| Escalating mobile-app security threat landscape | -1.4% | Global; concentrated in high-adoption zones | Short term (≤2 years) |
| Source: Mordor Intelligence | |||
Stricter app-store privacy requirements
Apple’s App Tracking Transparency has already rejected 12% of submissions for non-compliant data collection, obliging developers to embed consent prompts, data catalogs, and signed SDK manifests . Similar clauses in GDPR, CCPA, and China’s PIPL force regionalized builds, inflating test matrices and delaying launches. Monetization models reliant on user profiling face margin pressure, compelling publishers to pivot toward contextual ads and premium pricing.
Talent shortage of full-stack developers
Demand for senior engineers outpaces supply by an estimated 85.2 million positions heading into 2030, driving salary inflation that squeezes small and mid-sized firms. Scarcity extends to security engineers and AI integrators, prolonging delivery schedules and elevating project risk. Many enterprises react by upskilling domain experts through low-code curricula, yet complex backend integration still requires specialist oversight, constraining throughput in critical systems.
*Our forecasts treat driver/restraint impacts as directional, not additive. The impact forecasts reflect baseline growth, mix effects, and variable interactions.
Segment Analysis
By Type of App Development: Low-Code Platforms Advance Democratization
Low-/no-code solutions accelerate faster than any other approach, scaling at 29.65% CAGR, while native builds still occupy the highest revenue pool at 37.92% in 2025. These trends contribute materially to the overall App Development market. Business analysts configure workflows, dashboards, and AI chatbots directly on platforms like Power Apps, curbing backlog growth and releasing scarce professional developers for high-complexity tasks. Enterprises also formalize governance to prevent uncontrolled app sprawl, introducing center-of-excellence models that balance agility with security controls. Venture funding concentrates on niche low-code players for banking, insurance, and manufacturing, proving that specialization drives value. Native builds endure where GPU acceleration, haptic feedback, or OS-tight integration is vital, particularly in AAA mobile games. Yet even native teams augment productivity with AI-generated boilerplate, eroding some historical cost barriers.
Cross-platform frameworks have matured into robust ecosystems that reconcile performance with maintainability, further broadening the App Development market. Flutter and React Native secure community mindshare through hot-reload and unified theming, attracting start-ups that demand early-stage velocity. Hybrid wrappers hold relevance for line-of-business utilities inside large corporations that prioritize uniform device coverage. Together these options enlarge strategic choice sets, enabling CIOs to align tooling with talent profiles and long-term maintenance budgets. The net outcome is a pluralistic tooling landscape where low-/no-code, cross-platform, and native paths coexist, collectively pushing the App Development industry toward higher cadence releases and lowered total cost of ownership.


By Deployment Model: Cloud Infrastructure Builds Structural Dominance
Cloud implementations controlled 57.35% of App Development market share in 2025 and are expected to sustain a sturdy 21.8% CAGR through 2031. The shift owes much to elastic scaling, global PoPs, and built-in DevOps toolchains that reduce operational toil. Hyperscalers bundle database, AI inference, and security add-ons, encouraging workload consolidation. Enterprises now operate multicloud estates to hedge vendor risk and comply with data-locality statutes, yet a common set of container orchestration patterns ensures portability. IBM reports that roughly 80% of decision-makers already run hybrid blueprints that unite on-prem and public zones. Such architectures enable sensitive datasets to reside behind the firewall while interaction layers remain cloud-hosted, maintaining compliance without sacrificing reach.
On-premises deployments persist where latency guarantees or air-gap mandates supersede elasticity. Regulators in banking, healthcare, and defense often prescribe sovereign hosting, prompting vendors to offer turnkey appliance models that support cloud-native runtimes inside private racks. Edge nodes supplied by telecom operators bring compute milliseconds from user devices, ideal for AR retail try-ons and vehicle telemetry. These edge regions interlink with central clouds via service meshes, so developers program once and deploy anywhere, reinforcing the expansive trajectory of the App Development market.
By Application Platform: Mobile Supremacy Meets Multiexperience Momentum
Smartphones remain the center of gravity, translating into 64.55% of revenue in 2025 for the App Development market. High device penetration and habitual in-app purchase behavior underpin robust monetization. Progressive Web Apps narrow the gap between mobile and desktop, letting brands reach un-downloaded audiences without store commissions. Voice, chat, and wearables are now folded into multiexperience designs that post the highest 18.1% CAGR, reflecting omnichannel strategies across banking, retail, and public services. Users expect persistent sessions that shift from handset to browser to smart speaker without losing context, forcing backend orchestration layers to track identity and state.
Enterprises invest in design-system libraries and event-driven backends that serve multiple front-end clients, thereby extending the App Development market size through enhanced lifetime customer value. Experimentation with VR meetings, in-car dashboards, and kiosk interfaces illustrates how digital touchpoints proliferate beyond the traditional duality of mobile-and-web. While fragmentation raises QA overhead, revenue upside from immersive and frictionless interactions typically justifies expanded test budgets and drives incremental platform license sales.
By End-User Industry: Gaming Strength Coexists with Health and FinTech Upswings
Gaming generated 39.6% of 2025 revenue, owing to sophisticated monetization loops and e-sports culture that thrives on frequent content drops. Cross-device progression and cloud streaming further enlarge reachable audiences. Health-and-fitness apps accelerate at a rapid 19.9% CAGR, propelled by wearable integrations that track vitals and support chronic care management. These patterns broaden the App Development market as insurers reimburse digital therapeutics and employers subsidize wellness subscriptions. FinTech teams exploit super-app blueprints that merge payments, credit, and investments, particularly in Asia-Pacific where underbanked populations skip legacy channels. Regulatory sandboxes ease pilots, yet full compliance still requires rigorous audit logs and encryption.
Retailers roll out AI-powered product recommendations and augmented reality try-ons that boost conversion rates, while travel operators deploy contactless check-in and dynamic itinerary notifications. Education applications now blend synchronous classes with adaptive quizzes, maintaining traction even as physical campuses reopen. Each vertical brings unique compliance and integration requirements, stimulating demand for domain-specific accelerators inside the App Development market.
Geography Analysis
Asia-Pacific accounted for 38.05% of global revenue in 2025 and continues to deliver the fastest 17.9% CAGR. Mobile technologies contributed USD 880 billion to the region’s GDP in 2023 and supported 13 million jobs, laying a fertile base for continued digital-service expansion . The proliferation of super-apps such as WeChat, Paytm, and Grab blurs the line between social, commerce, and finance, compelling enterprises to launch API-first micro-services that plug into these ecosystems. Government programs like India’s Digital Public Infrastructure and Singapore’s Smart Nation funnel grants and tax incentives into start-up studios, while local cloud regions lower latency and satisfy data-residency rules. Together these forces amplify the App Development market.
North America ranks second in value, driven by enterprise software incumbents and a mature venture capital network. Home-grown platform vendors such as Microsoft, Google, and Amazon continually raise the abstraction layer—low-code studios, serverless runtimes, integrated ML APIs—allowing product teams to iterate quickly. Compliance with sectoral regulations (HIPAA, FedRAMP, PCI) steers design choices but also differentiates specialized providers. Consumer adoption is stable rather than explosive, yet average revenue per user remains among the world’s highest, preserving profit pools for subscription and SaaS monetization. Academic-industry alliances fuel steady research pipelines, particularly in AI coding assistants and quantum-safe encryption, thereby sustaining the long-term competitiveness of the App Development market.
Europe occupies a nuanced position: it enforces the planet’s strictest privacy statutes while championing digital sovereignty. GDPR’s influence spreads globally, prompting privacy-by-design blueprints that vendors subsequently reuse in other markets. Initiatives like GAIA-X and the proposed European Data Act stimulate domestic cloud capacity and cross-border data portability. Although growth trails Asia-Pacific, the region excels in sector solutions for automotive, industrial IoT, and financial services, often anchored by German engineering standards or Nordic mobile payment heritage. Public-sector tenders for e-government portals enlarge addressable demand, and funding from the EU’s Digital Europe Programme subsidizes SME adoption, subtly lifting the App Development market size in the bloc.

Competitive Landscape
The App Development market shows moderate concentration. Tata Consultancy Services posted USD 30.18 billion in FY 2025, leveraging domain consulting and large offshore delivery hubs to win end-to-end digital transformation deals[3]Tata Consultancy Services, “FY 2025 Annual Report,” tcs.com. Infosys generated USD 19.3 billion and prioritizes generative-AI accelerators and design-thinking workshops to distinguish its service catalogue. IBM recorded USD 62.8 billion and folds watsonx AI tooling into hybrid-cloud build-operate-transfer engagements. Collectively, these firms scale multidisciplinary teams, managed services, and intellectual-property components that raise entry barriers for smaller agencies.
Cloud hyperscalers intensify rivalry by offering native low-code studios bundled with compute credits. Microsoft Power Platform and Google AppSheet reduce total cost for green-field apps and siphon work from traditional custom-code projects. Emerging pure-play low-code vendors respond with vertical depth—HIPAA workflows, core-banking adapters, or IEC-62304 medical software templates—to counter generalized hyperscaler suites. M&A activity remains brisk as large vendors purchase point solutions to fill portfolio gaps; examples include Wix’s USD 80 million acquisition of Base44 to enrich natural-language development features and OpenAI’s reported buy-out of Windsurf to own AI test automation.
Investors also back niche specialists concentrating on edge orchestration, API security scanning, and AI-generated test coverage, betting that multi-cloud heterogeneity and compliance pressures will keep demand diversified. Service companies form alliances with cloud and low-code platforms to secure co-selling routes and minimize channel conflict. Competitors differentiate on vertical accelerators, proprietary AI models, or outcome-based pricing. The resulting landscape is dynamic, with incumbents defending breadth while challengers win depth, collectively propelling the App Development market toward higher specialization.
App Development Industry Leaders
Accenture plc
Cognizant Technology Solutions Corporation
Tata Consultancy Services Limited
Infosys Limited
IBM Corporation
- *Disclaimer: Major Players sorted in no particular order


Recent Industry Developments
- June 2025: Wix.com completes USD 80 million acquisition of Base44, adding “Vibe Coding” natural-language development to its low-code platform.
- June 2025: Launch exits beta after onboarding 2,000+ early adopters across 10 countries, enabling production-ready full-stack apps in under 15 minutes without code.
- June 2025: Anthropic’s Claude AI unveils a no-code builder that lets non-developers create AI-powered applications within a chat interface.
- April 2025: Seamgen secures majority investment from Itility Group to expand mobile-app development capacity.


Research Methodology Framework and Report Scope
Market Definitions and Key Coverage
Our study defines the app development market as the revenue generated from planning, coding, testing, deployment, and maintenance of new mobile, web, and multiexperience applications that are commissioned by third-party clients or built for internal enterprise use. Activities tied purely to app store advertising, handset pre-loads, and device hardware are outside scope.
Scope Exclusion: Pre-installed operating-system utilities and white-label app reselling are excluded.
Segmentation Overview
- By Type of App Development
- Native Mobile App Development
- Low-/No-Code App Development
- Progressive Web App (PWA) Development
- Hybrid App Development
- Cross-Platform App Development
- Enterprise App Development Platforms
- By Deployment Model
- On-Premises
- Cloud-Based
- By Application Platform
- Web-Based Applications
- Mobile-Based Applications
- Multiexperience / Omnichannel Apps
- By End-User Industry
- Gaming
- Music and Entertainment
- Health and Fitness
- Social Networking
- Retail and E-commerce
- Travel and Hospitality
- Learning and Education
- FinTech and Banking
- Others
- By Geography
- North America
- United States
- Canada
- Mexico
- South America
- Brazil
- Argentina
- Rest of South America
- Europe
- Germany
- United Kingdom
- France
- Italy
- Spain
- Russia
- Rest of Europe
- Asia-Pacific
- China
- Japan
- India
- South Korea
- Australia and New Zealand
- Rest of Asia-Pacific
- Middle East and Africa
- Middle East
- Saudi Arabia
- United Arab Emirates
- Turkey
- Rest of Middle East
- Africa
- South Africa
- Nigeria
- Egypt
- Rest of Africa
- Middle East
- North America
Detailed Research Methodology and Data Validation
Primary Research
Mordor analysts interviewed app publishers, third-party dev studios, low-code platform product managers, and digital transformation leaders across North America, Europe, and Asia-Pacific. These calls clarified average project budgets, regional pricing spreads, and upcoming regulatory impacts, which we then cross-checked through an online survey of enterprise IT buyers.
Desk Research
We gathered baseline indicators from tier-1 public sources such as UN Comtrade shipment codes for smartphones, U.S. Census ICT spending tables, Eurostat digital-service turnover, the GSM Association's mobile economy databook, and patent families in Questel that map to cross-platform development tools. Company 10-Ks, investor decks, and technology conference transcripts helped us capture prevailing pricing models and demand pulses. Data pulls from D&B Hoovers, Dow Jones Factiva, and Marklines (for infotainment tie-ins) enriched supplier financials and competitive actions. Many other open datasets were referenced; the list above is illustrative, not exhaustive.
Market-Sizing & Forecasting
We applied a top-down reconstruction that starts with regional ICT services outlays and reallocates spend to custom application work using mobile penetration rates, developer hour intensity, and share of wallet benchmarks. Supplier roll-ups and sampled average selling price times project volume served as selective bottom-up checks to recalibrate totals. Key variables include smartphone installed base, cloud migration pace, low or no code adoption ratios, hourly developer rates, and median app refresh cycles. A multivariate regression model links these drivers to historical market values; forecasts to 2030 use ARIMA with expert-validated scenario bounds. Where primary data were thin, we interpolated missing values via regional analogs and tightened them after respondent callbacks.
Data Validation & Update Cycle
Outputs pass three gates: automated variance scans against prior editions, peer review by a second analyst team, and management sign-off. Any deviation above two standard deviations triggers recontact with sources. Our database refreshes every twelve months, and mid-cycle revisions occur when sizable funding rounds, policy shifts, or platform fee changes materially alter assumptions.
Why Our App Development Baseline Commands Confidence
Published estimates often diverge because firms pick different service buckets, cost bases, and refresh cadences.
The largest gaps stem from (a) inclusion of software license revenue by some publishers, (b) use of project count extrapolations without price normalization, and (c) static currency conversions that ignore quarterly rate swings. Mordor reports only fee-based development services, applies blended regional ASPs that reflect cloud shift discounts, and revisits inputs annually.
Benchmark comparison
| Market Size | Anonymized source | Primary gap driver |
|---|---|---|
| USD 264.96 B (2025) | Mordor Intelligence | - |
| USD 511.55 B (2025) | Global Consultancy A | Bundles platform license and maintenance fees into service value |
| USD 330.61 B (2025) | Regional Consultancy B | Uses install base times monetization rate without validating average project budgets |
| USD 257.94 B (2024) | Trade Journal C | Employs developer headcount roll-ups, assumes uniform utilization across regions |
In sum, by anchoring the market to verifiable spending records, stress testing with live practitioner inputs, and refreshing findings on a disciplined schedule, Mordor Intelligence delivers a balanced, transparent baseline that decision-makers can rely on.


Key Questions Answered in the Report
What is the current value of the App Development market?
The App Development market stands at USD 305.18 billion in 2026 and is on track to hit USD 618.65 billion by 2031.
Which region is expanding the fastest?
Asia-Pacific leads growth with an 17.9% CAGR, driven by 5G roll-outs, large mobile user bases, and supportive digital policies.
How significant are low-/no-code platforms?
Low-/no-code approaches post a 29.65% CAGR, enabling business users to produce applications rapidly and easing developer shortages.
What share do cloud deployments hold?
Cloud models captured 57.35% of App Development market share in 2025 and are growing at 21.8% CAGR as enterprises migrate workloads.
Page last updated on:


