Mobile Business Intelligence Market Size and Share
Market Overview
| Study Period | 2020 - 2031 |
|---|---|
| Market Size (2026) | USD 24.35 Billion |
| Market Size (2031) | USD 66.28 Billion |
| Growth Rate (2026 - 2031) | 22.18% CAGR |
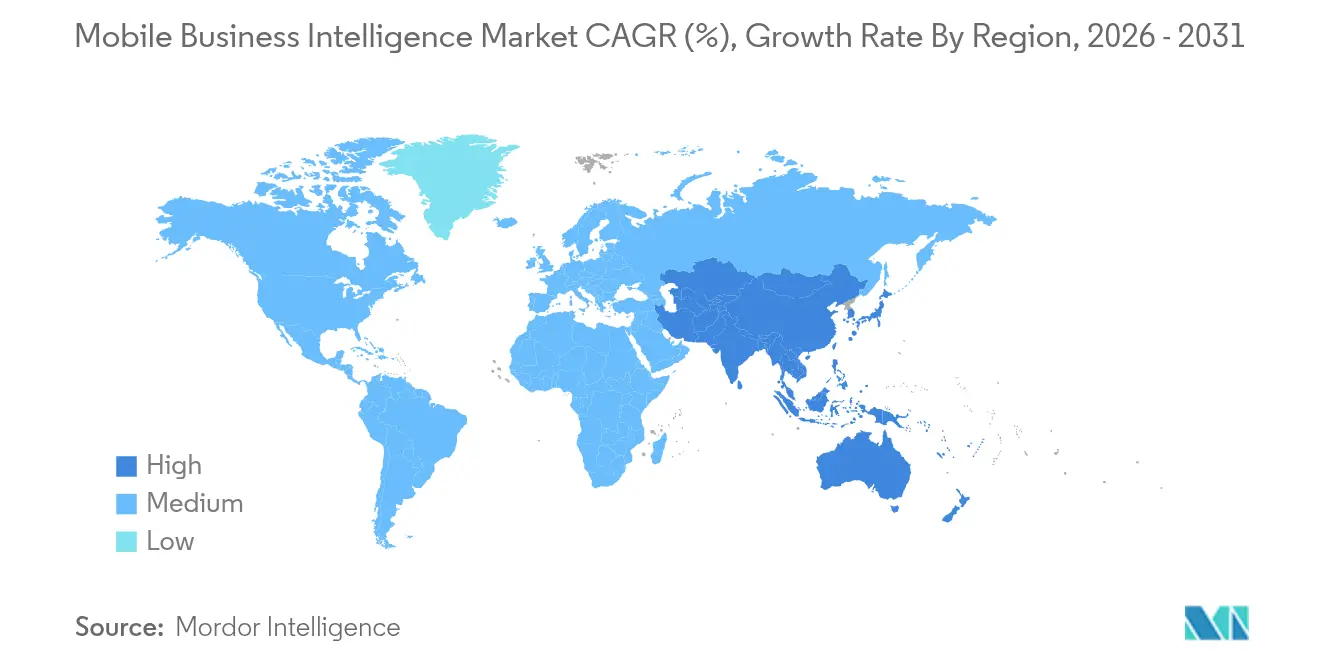
| Fastest Growing Market | Asia Pacific |
| Largest Market | North America |
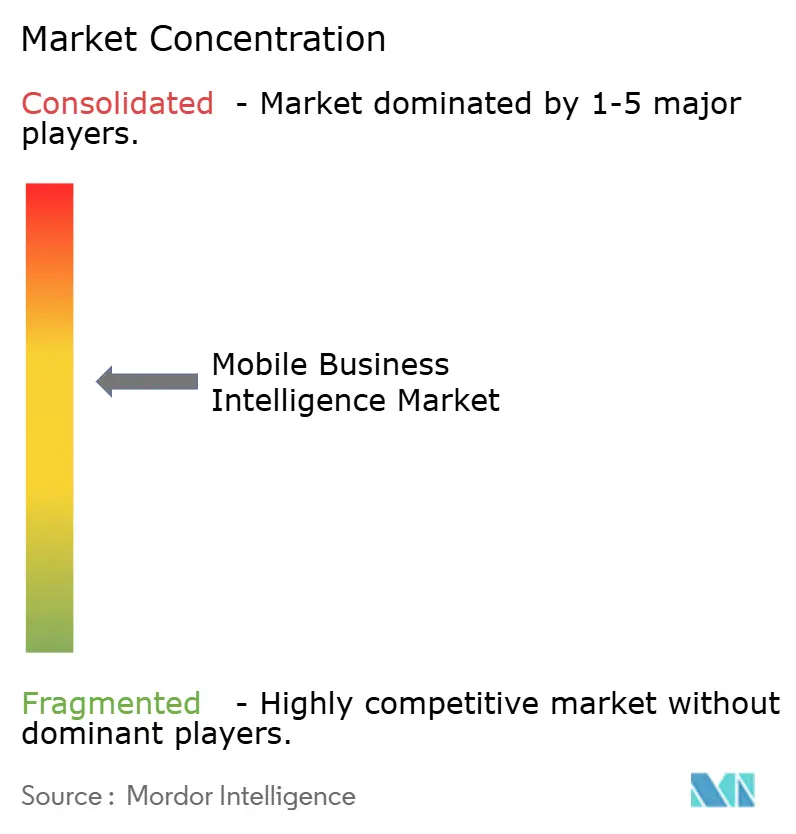
| Market Concentration | Medium |
Major Players *Disclaimer: Major Players sorted in no particular order Image © Mordor Intelligence. Reuse requires attribution under CC BY 4.0. | |

Mobile Business Intelligence Market Analysis by Mordor Intelligence
Mobile business intelligence market size in 2026 is estimated at USD 24.35 billion, growing from 2025 value of USD 19.93 billion with 2031 projections showing USD 66.28 billion, growing at 22.18% CAGR over 2026-2031. This growth reflects the urgency to democratize data access beyond fixed desktops so that distributed employees can act on insights in real time. Strong tailwinds include 5G maturation that lowers latency, the spread of edge computing that keeps processing close to data sources, and the injection of generative AI that simplifies query creation for non-technical users[1]GSMA, “The Mobile Economy 2025,” gsma.com. Software solutions continue to outsell services, yet demand for implementation and managed offerings expands quickly as firms wrestle with complex cloud, AI, and security requirements. North America retains leadership because of mature mobility frameworks, but Asia-Pacific offers the highest upside as local enterprises accelerate digital transformation under mobile-first mandates.
Key Report Takeaways
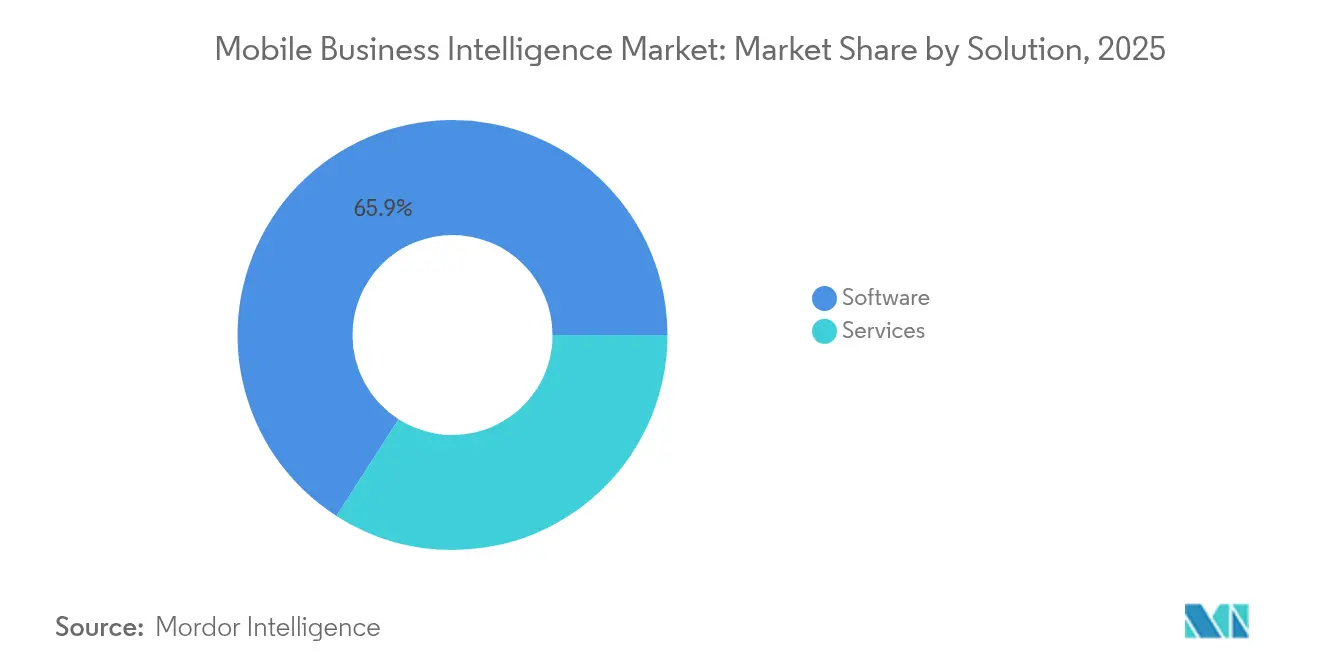
- By solution, software dominated with 65.92% revenue share in 2025, while services are forecast to grow at a 23.70% CAGR through 2031.
- By organization size, large enterprises held 74.35% of the mobile business intelligence market share in 2025; small and medium enterprises are projected to expand at a 23.35% CAGR through 2031.
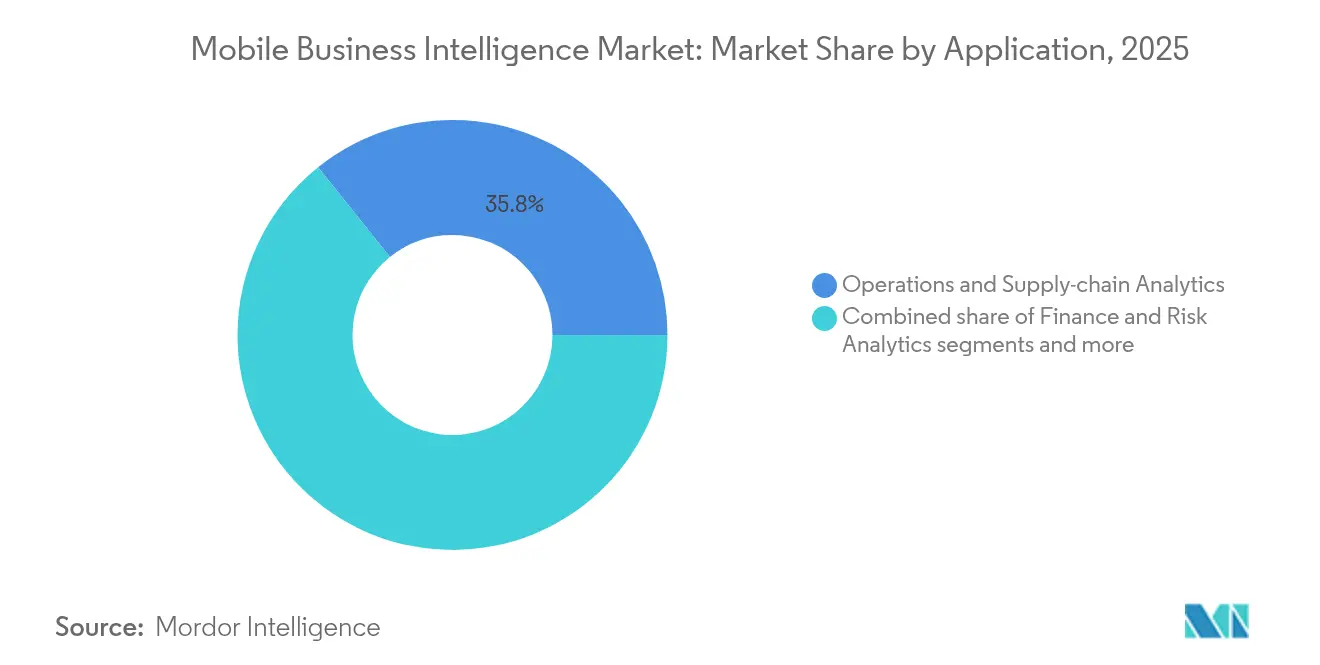
- By application, operations and supply-chain analytics captured 35.75% of the mobile business intelligence market size in 2025, whereas customer experience analytics is set to post the fastest 23.05% CAGR to 2031.
- By end-user vertical, IT and telecommunications led with 25.10% revenue share in 2025; BFSI is expected to be the fastest-growing vertical at 22.65% CAGR through 2031.
- By geography, North America commanded 36.25% of the mobile business intelligence market in 2025, while Asia-Pacific is anticipated to register the highest 22.85% CAGR to 2031.
Note: Market size and forecast figures in this report are generated using Mordor Intelligence’s proprietary estimation framework, updated with the latest available data and insights as of 2026.
Global Mobile Business Intelligence Market Trends and Insights
Drivers Impact Analysis*
| Driver | (~) % Impact on CAGR Forecast | Geographic Relevance | Impact Timeline |
|---|---|---|---|
| Cloud-first mobile BI adoption among large enterprises | +4.2% | Global, with early gains in North America and EU | Medium term (2-4 years) |
| Surge in 5G/edge deployments enabling real-time analytics | +3.8% | Asia-Pacific core, spill-over to North America | Short term (≤2 years) |
| BYOD expansion and MDM integration in SMEs | +3.1% | Global, particularly strong in Asia-Pacific and MEA | Medium term (2-4 years) |
| Embedded analytics within SaaS apps and mobile workflows | +2.9% | North America and EU, expanding to Asia-Pacific | Long term (≥4 years) |
| Generative-AI-powered natural-language query interfaces | +2.7% | Global, concentrated in developed markets | Short term (≤2 years) |
| Telco-led “network analytics-as-a-service” offerings | +2.1% | Asia-Pacific and MEA, emerging in Europe | Long term (≥4 years) |
| Source: Mordor Intelligence | |||
Cloud-first Mobile BI Adoption Among Large Enterprises
Large corporations are swapping on-premises stacks for cloud-native mobile BI so global staff can reach dashboards without VPN friction. More than 52,000 companies actively use Microsoft Power BI, embedding analytics into Microsoft 365 work streams. The shift lowers total cost of ownership because server upkeep disappears and elastic resources scale during peak usage. SAP Analytics Cloud similarly links live transactional data with mobile visualizations while preserving strict identity controls[2]SAP, “SAP Analytics Cloud Product Documentation,” sap.com. As this model proliferates, mobile business intelligence market penetration deepens across regulated sectors that once resisted cloud migration.
Surge in 5G/Edge Deployments Enabling Real-time Analytics
Standalone 5G networks now run in seven Asia-Pacific countries, undergirding a USD 880 billion regional mobile economy that prizes responsive analytics. Edge computing moves processing to local gateways so mobile dashboards refresh in milliseconds, a necessity for factory predictive-maintenance alerts and retail shelf-stocking decisions. Financial-trading desks in Tokyo already exploit sub-millisecond feeds to price derivatives on handheld devices. These examples illustrate how 5G plus edge collectively raise usage intensity inside the mobile business intelligence market.
BYOD Expansion and MDM Integration in SMEs
Seventy percent of SMEs express awareness of analytics tools, and many now reach them first on employee-owned phones because SaaS delivery removes capital obstacles. Case studies from Croatian SMEs confirm that productivity rises when staff consult mobile dashboards, though budget limits and skill gaps still stall some pilots. Modern mobile-device-management suites containerize business apps and allow remote wipes, addressing most privacy concerns. Microsoft Intune’s screenshot-blocking for iOS illustrates continuous hardening that reassures finance teams about sensitive KPI exposure.
Embedded Analytics Within SaaS Apps and Mobile Workflows
SaaS vendors now bake analytics straight into mobile interfaces, eliminating context switching between CRM and BI tools. Salesforce’s planned USD 8 billion purchase of Informatica highlights demand for built-in data management that outputs predictive insights to field sellers on phones. Tableau Next pushes “agentic” analytics, where AI agents surface anomalies directly inside mobile views instead of waiting for users to open static dashboards. Industry-specific SaaS platforms replicate the pattern, giving health-care clinicians bedside decision support without extra training.
Restraints Impact Analysis*
| Restraint | (~) % Impact on CAGR Forecast | Geographic Relevance | Impact Timeline |
|---|---|---|---|
| Persistent security and privacy concerns on personal devices | −2.8% | Global, particularly acute in regulated industries | Medium term (2-4 years) |
| Limited mobile dashboard usability for complex analysis | −2.1% | Global, affecting enterprise adoption rates | Short term (≤2 years) |
| Data-governance fragmentation across multi-cloud estates | −1.9% | North America and EU, expanding globally | Long term (≥4 years) |
| App-store policy changes throttling SDK data capture | −1.4% | Global, with iOS/Android policy dependencies | Medium term (2-4 years) |
| Source: Mordor Intelligence | |||
Persistent Security and Privacy Concerns on Personal Devices
Sixty percent of enterprises cite mobile security as the main barrier to broader BI rollout despite clear sales-performance gains. BYOD policies mingle consumer and corporate apps, raising leakage risks that new Apple privacy manifests only partly mitigate. Banks and hospitals often restrict mobile BI to company-issued phones, slowing penetration in high-value verticals even as encryption and biometric log-ins improve.
Limited Mobile Dashboard Usability for Complex Analysis
Small screens hinder side-by-side visual comparisons and multi-step filtering, reducing analyst productivity versus desktop setups. Academic experiments show cognitive load rises when users must remember prior views instead of pinning them onscreen, hampering situation awareness during complex tasks. Vendors respond by prioritizing fewer but sharper indicators on mobiles, yet power users still revert to laptops for deep dives, capping certain revenue streams in the mobile business intelligence market.
*Our forecasts treat driver/restraint impacts as directional, not additive. The impact forecasts reflect baseline growth, mix effects, and variable interactions.
Segment Analysis
By Solution: Services Accelerate Through AI Integration
Software remains the revenue cornerstone, supplying visualization tools, query engines and governance layers that earned a 65.92% share in 2025. These offerings anchor most enterprise analytics stacks and integrate with identity suites, data warehouses and low-code platforms. Still, surging demand for implementation, customization and managed operations means service providers are booking faster contracts than license vendors. Many clients now outsource fine-tuning of large language models, edge-deployment scripts and zero-trust controls because internal teams lack bandwidth. The mobile business intelligence market size for services is projected to expand at high double-digit CAGR through 2031 as organizations shift from pure software spend toward outcome-based engagements.
Consulting firms bundle data engineering, user-training and day-two optimization so clients can unlock value soon after go-live. Managed-services partners sign multiyear agreements to keep mobile apps patched, monitor usage and refine semantic layers, freeing business units to focus on insight consumption instead of platform care. MicroStrategy’s listing on Google Cloud Marketplace illustrates the trend: automated provisioning trims deployment timelines, while certified partners step in for ongoing governance. These patterns reinforce a service-rich growth arc likely to continue even as self-service tooling improves.


By Organization Size: SME Adoption Driven by Cloud Economics
Large enterprises controlled 74.35% revenue in 2025 because they possess global operations, ample IT staff, and compliance obligations that favor robust mobile BI suites. They embed analytic graphs into ERP and CRM workflows so thousands of employees can track KPIs in the field. Multi-tenant governance, single sign-on, and fine-grained role controls satisfy auditors in finance, healthcare, and public-sector domains. Despite this dominance, the small-business segment now logs the briskest expansion as turnkey SaaS lowers entry barriers.
SMEs appreciate pay-as-you-go subscriptions, automated scaling, and wizard-based report builders that appear within familiar productivity suites. The mobile business intelligence market size for SMEs is forecast to climb steeply as founders seek instant visibility into cash flow, inventory, and customer sentiment without spinning up expensive on-prem databases. Croatian survey data shows that adoption success correlates with top-management sponsorship and clear performance targets. As app stores flood with pre-built connectors to Shopify, QuickBooks, and Stripe, smaller firms can join data-driven cultures without hiring data scientists, underscoring why this cohort will keep outpacing the overall mobile business intelligence industry.
By Application: Customer Experience Analytics Leads Growth
Operations and supply-chain analytics held 35.75% of 2025 revenue thanks to IoT-linked factories, fleet telematics, and warehouse systems that broadcast metrics to supervisors on tablets. These use cases thrive when edge nodes preprocess sensor streams so only anomalies travel to a cloud dashboard, saving bandwidth and enabling real-time intervention. The mobile business intelligence market continues to prize uptime gains and cost avoidance yielded by predictive maintenance pathways.
Customer-experience analytics meanwhile records the highest 23.05% CAGR because every interaction point—store beacons, chatbots, loyalty apps—spits out data that marketing teams can adjust on the fly. Field sellers view propensity scores before meetings, while service agents see churn risk gauges as soon as a call arrives. In hospitality, geo-fenced promotions trigger only when a guest’s mobile app beacons inside the lobby. These responsive moments shrink decision cycles from hours to seconds and directly impact revenue, explaining why boards approve incremental analytics budgets even during cost-control periods. Where data stays sparse, AI fills gaps with look-alike modeling, sustaining the growth curve.
By End-user Vertical: BFSI Accelerates Through Regulatory Compliance
IT and telecommunications enterprises led with a 25.10% share in 2025 by virtue of deep in-house engineering talent and constant network-performance monitoring needs. Staff rely on phone dashboards to diagnose traffic spikes, allocate spectrum, and alert customers during outages. Telecoms also monetize anonymized location data, adding external revenue lines that flow back into analytics enhancements.
BFSI shows the sharpest 22.65% CAGR as banks deploy mobile BI for fraud detection, instant credit scoring, and branch foot-traffic analysis. Regulators now require near real-time suspicious-activity reports, making handheld dashboards essential for compliance officers. Insurers blend weather feeds with claim histories to pre-stage adjusters before storms hit. Fin-tech challengers push incumbents faster by offering clients portfolio heat maps inside consumer apps, setting new service benchmarks. Each advance reinforces mobile BI’s status as a regulatory and competitive necessity, driving sustained investment.
Geography Analysis
North America kept 36.25% of global revenue in 2025, anchored by ubiquitous LTE-Advanced coverage, swift 5G roll-outs, and enterprise familiarity with mobile security frameworks. Silicon Valley vendors pilot novel features—voice query, camera-based data capture—domestically before global releases, giving the region early productivity gains. Tight integrations with Microsoft Entra ID and Okta simplify identity propagation from desktop to phone, boosting active-user counts. High labor costs also motivate firms to chase analytics-driven efficiency, ensuring continued budget allocation for upgrades in the mobile business intelligence market.
Asia-Pacific stands out with a projected 22.85% CAGR through 2031 as governments subsidize 5G spectrum and mandate data-localization that favors cloud regions inside national borders. China’s e-commerce giants stream petabyte-scale telemetry into real-time dashboards that optimize flash sales in minutes. India’s Unified Payments Interface pushes billions of daily transactions into analytics clouds, letting banks refine fraud models on smartphones carried by rural agents. Many ASEAN manufacturers skip legacy MES systems and adopt mobile dashboards first, illustrating a leapfrog effect that expands the mobile business intelligence market size faster than any other region.
Europe posts steady expansion under the weight of GDPR, sustainability targets, and Industry 5.0 strategies. Utilities use mobile BI to monitor renewable generation, while carmakers rely on handheld analytics to coordinate just-in-sequence deliveries. Strict privacy rules encourage pseudonymization and on-device encryption, raising development complexity but also differentiating vendors that pass compliance audits. Meanwhile, Latin America and the Middle East and Africa open fresh territory. Brazil’s PIX instant-payment network feeds behavioral data to fintechs hungry for mobile insights. Gulf telcos bundle analytics dashboards with enterprise data plans, selling one-stop mobility plus intelligence to oil-field operators, hospitals, and smart-city managers.

Competitive Landscape
The market shows moderate concentration because a quartet of platform giants—Microsoft, SAP, IBM, and Salesforce—own broad product suites, large partner ecosystems, and entrenched enterprise contracts. Their roadmaps focus on embedding generative AI throughout the stack, automating data preparation, visualization, and even narrative explanation inside mobile apps. IBM alone earmarked USD 150 billion in cumulative AI investments, including watsonx X and domain-specific model hubs, underscoring the escalating budget bar for top-tier innovators. These incumbents cross-sell BI modules into ERP, CRM, and office software, creating lock-in that dampens share erosion.
Nimble challengers such as ThoughtSpot, Sisense, and Domo compete by simplifying UX and targeting greenfield mid-market accounts. They tout sub-five-minute deployment and consumption-based pricing, resonating with digital natives who scorn perpetual licenses. Several specialize: ThoughtSpot builds search-first experiences; Sisense wraps analytics into vertical SaaS; Domo stresses embedded connectors for citizen developers. Edge-focused players emerge too, pitching container-portable runtimes that analyse machine data at the factory line before syncing summaries to the cloud. Such specialization diversifies the mobile business intelligence market without yet unseating the leaders.
Strategic partnerships intensify rivalry. Snowflake leverages Microsoft Azure OpenAI Service so customers can tap large language models inside Teams chats, pulling live metrics without leaving collaboration threads. MicroStrategy’s Marketplace listing fast-tracks procurement for Google Cloud tenants and unlocks revenue-share incentives for service partners. Telcos form analytics alliances to bundle bandwidth, compute, and dashboards in one invoice. Collectively, these maneuvers sharpen competitive edges and accelerate product cycles, ensuring end users receive frequent innovations that keep demand high.
Mobile Business Intelligence Industry Leaders
IBM Corporation
Microsoft Corporation
SAP SE
SAS Institute
MicroStrategy Incorporated
- *Disclaimer: Major Players sorted in no particular order

Recent Industry Developments
- May 2025: Microsoft shipped Power BI mobile updates that added shortcut tiles, offline caching and cross-chart drill paths to improve in-route decision making.
- May 2025: Tableau unveiled “Tableau Next,” an agentic analytics layer that lets AI co-pilots automate KPI alerts, commentary and recommended actions on smartphones.
- April 2025: MicroStrategy ONE became available on Google Cloud Marketplace with Auto AI bot for conversational insights and rapid mobile provisioning.
- March 2025: Samsung introduced Galaxy S25 with on-device generative AI that accelerates report rendering and a Project Moohan headset blending XR with BI overlays.


Research Methodology Framework and Report Scope
Market Definitions and Key Coverage
Our study defines the mobile business intelligence market as all software platforms and related professional or managed services that let employees build, view, and interact with dashboards or data visualizations on smartphones or tablets, whether deployed in the cloud or on-premise. Valuation reflects end-user spending in constant 2025 USD.
We exclude hardware sales, desktop-only analytics tools, and generic reporting modules shipped without a mobile interface from the scope.
Segmentation Overview
- By Solution
- Software
- Mobile BI Platforms
- Data Visualization Tools
- Dashboard and Reporting Apps
- Services
- Professional Services
- Managed Services
- Software
- By Organization Size
- Large Enterprises
- Small and Medium Enterprises (SMEs)
- By Application
- Sales and Marketing Analytics
- Finance and Risk Analytics
- Operations and Supply-chain Analytics
- HR and Workforce Analytics
- Customer Experience Analytics
- By End-user Vertical
- BFSI
- IT and Telecommunications
- Healthcare and Life Sciences
- Retail and E-commerce
- Government and Public Sector
- Other End-user Verticals
- By Geography
- North America
- United States
- Canada
- Mexico
- Europe
- Germany
- United Kingdom
- France
- Italy
- Spain
- Rest of Europe
- Asia-Pacific
- China
- Japan
- India
- South Korea
- Australia
- Rest of Asia-Pacific
- South America
- Brazil
- Argentina
- Rest of South America
- Middle East and Africa
- Middle East
- Saudi Arabia
- United Arab Emirates
- Turkey
- Rest of Middle East
- Africa
- South Africa
- Egypt
- Nigeria
- Rest of Africa
- Middle East
- North America
Detailed Research Methodology and Data Validation
Primary Research
We interviewed mobile BI product managers, cloud architects, enterprise IT leaders, and regional channel partners across North America, Europe, and Asia-Pacific. These discussions validated license fee ranges, usage intensity, penetration bottlenecks, and upcoming regulatory triggers, letting us reconcile secondary findings and close data gaps.
Desk Research
Our analysts drew upon tier-1 public datasets such as International Telecommunication Union mobility statistics, GSMA Intelligence 5G coverage maps, OECD digital transformation indicators, and national ICT surveys to anchor user base and connectivity metrics. Company filings, investor presentations, and reputable press accessed through D&B Hoovers and Dow Jones Factiva clarified revenue splits, pricing bands, and competitive moves. Peer-reviewed journals and trade associations like the Cloud Industry Forum added depth on adoption patterns and use cases. The sources named are illustrative; many additional publications informed data collection, validation, and assumption checks.
Market-Sizing & Forecasting
We start with a top-down construct that begins at global enterprise software outlay, isolates analytics spending, and then applies a mobile penetration ratio derived from smartphone workforce share and BYOD prevalence. Supplier revenue roll-ups and sampled average selling price × user counts serve as bottom-up reasonableness checks before final alignment. Key variables include annual smartphone penetration in the workforce, average mobile BI license price, 5G population coverage, enterprise cloud migration rate, and median dashboard refresh frequency; each trajectory is tested through multivariate regression supported by scenario analysis to capture regulatory or macro shocks.
Data Validation & Update Cycle
Automated outlier and currency consistency tests precede dual-analyst peer review; unusual variances trigger reconfirmation with prior respondents. Mordor analysts refresh the model every twelve months, with interim updates issued whenever material events, such as major vendor pricing changes or disruptive regulation, arise. A final analyst pass just before publication ensures clients receive the latest view.
Why Our Mobile Business Intelligence Baseline Commands Reliability
Published estimates often diverge because firms apply different service mixes, currencies, and refresh cadences. Mordor's disciplined scope alignment, variable selection, and yearly update cycle provide decision makers with a dependable baseline.
Key gap drivers include studies that omit services, roll mobile BI into broader analytics software, or extend growth using unvalidated license multipliers. Some keep static exchange rates or apply a single global growth factor, inflating totals and masking regional nuance.
Benchmark comparison
| Market Size | Anonymized source | Primary gap driver |
|---|---|---|
| USD 19.93 B (2025) | Mordor Intelligence | |
| USD 16.89 B (2024) | Global Consultancy A | Services excluded; base year differs; no currency normalization |
| USD 15.40 B (2023) | Trade Journal B | Bundles mobile BI within desktop analytics; uniform historical CAGR |
| USD 14.25 B (2024) | Regional Consultancy C | Applies aggressive smartphone growth and ignores price erosion |
The comparison shows that Mordor Intelligence delivers a balanced, transparent figure anchored to verifiable variables and repeatable steps, giving executives a solid foundation for strategic planning.


Key Questions Answered in the Report
What is the current size of the mobile business intelligence market?
The market is valued at USD 24.35 billion in 2026 and is forecast to climb to USD 66.28 billion by 2031, reflecting a 22.18% CAGR.
Which region is growing the fastest for mobile BI solutions?
Asia-Pacific shows the highest growth momentum with a projected 22.85% CAGR through 2031, powered by rapid 5G roll-outs and mobile-first digital initiatives.
Why are services outpacing software in growth?
Enterprises need specialized help with AI integration, edge deployments, and security hardening, so the services segment is expanding at a 23.70% CAGR despite software retaining the larger revenue share.
How do 5G and edge computing influence mobile BI adoption?
They cut latency to sub-millisecond levels, enabling real-time analytics for manufacturing, retail, and financial trading use cases, which adds a +3.8% uplift to the overall market CAGR.
What is the biggest barrier to broader enterprise uptake?
Security and privacy concerns on employee-owned devices remain the chief obstacle, subtracting an estimated 2.8% from the market’s CAGR forecast.
Which industry vertical will grow the fastest?
BFSI is projected to expand at a 22.65% CAGR as banks and insurers adopt mobile dashboards for fraud detection, compliance monitoring, and personalized customer engagement.
Page last updated on:


