Intelligent Network Market Size and Share
Market Overview
| Study Period | 2020 - 2031 |
|---|---|
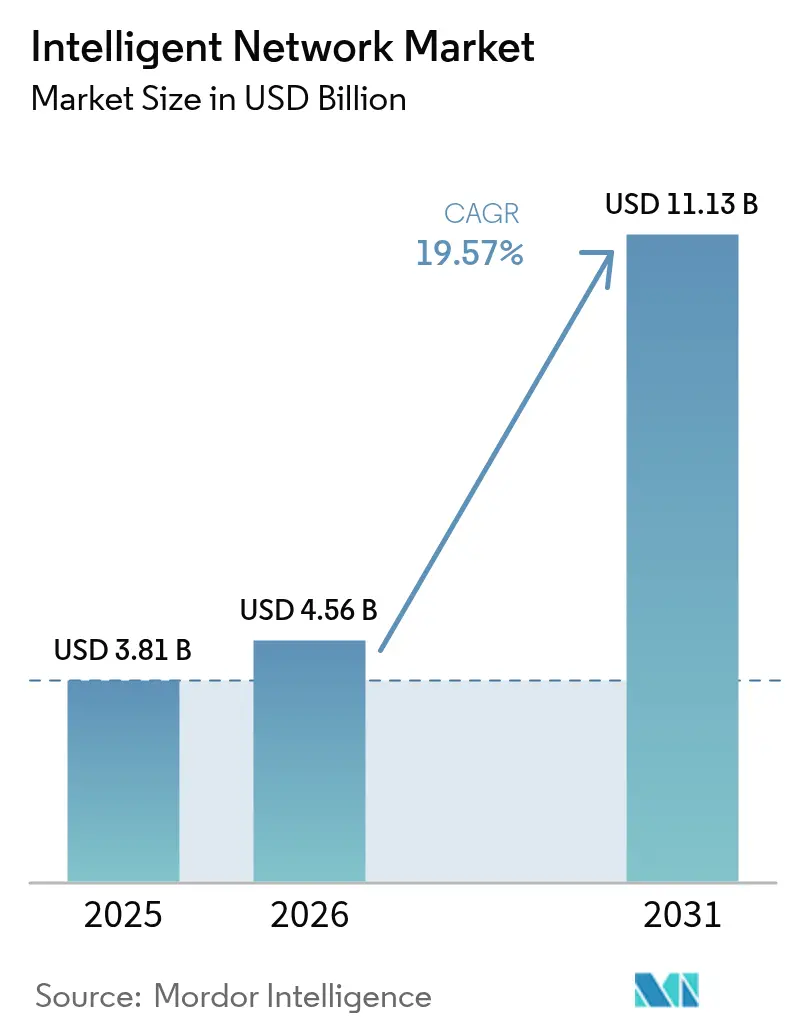
| Market Size (2026) | USD 4.56 Billion |
| Market Size (2031) | USD 11.13 Billion |
| Growth Rate (2026 - 2031) | 19.57% CAGR |
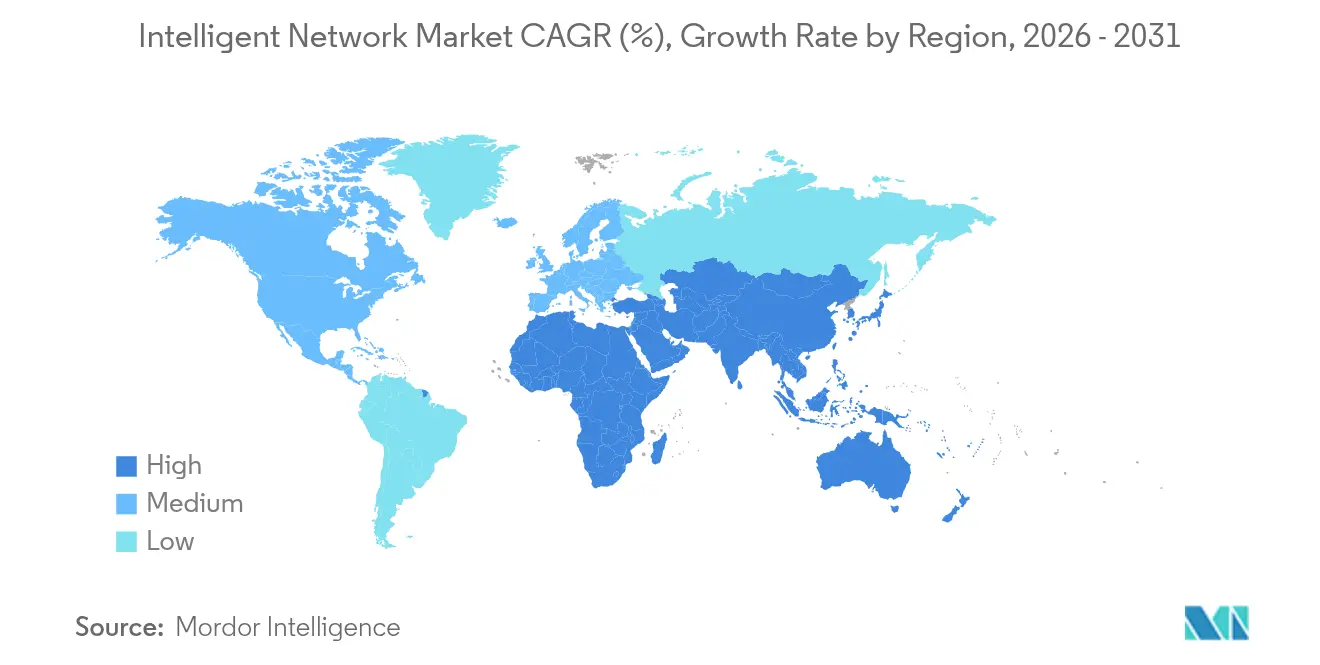
| Fastest Growing Market | Asia Pacific |
| Largest Market | North America |
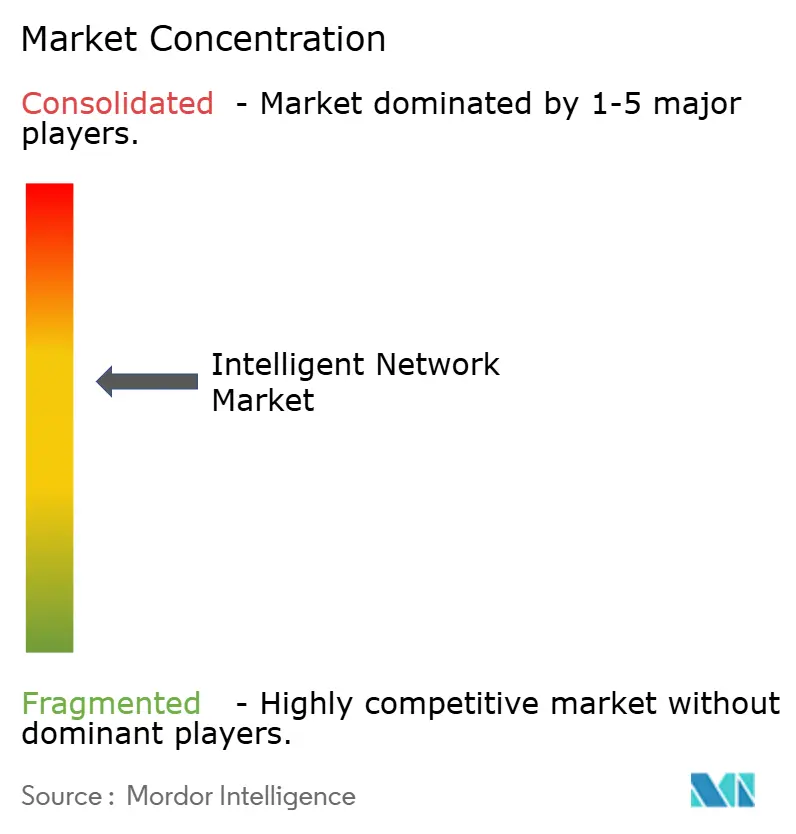
| Market Concentration | Medium |
Major Players *Disclaimer: Major Players sorted in no particular order Image © Mordor Intelligence. Reuse requires attribution under CC BY 4.0. | |
Intelligent Network Market Analysis by Mordor Intelligence
The intelligent network market size was valued at USD 3.81 billion in 2025 and estimated to grow from USD 4.56 billion in 2026 to reach USD 11.13 billion by 2031, at a CAGR of 19.57% during the forecast period (2026-2031). Strong momentum comes from surging telco investment in AI-driven orchestration, with global spending on that capability expected to climb from USD 6 billion in 2024 to USD 20 billion in 2028. Hyperscale data-center operators are committing USD 215 billion to infrastructure during 2025 alone, a scale that forces networks to manage traffic spikes autonomously. Software automation suites already command 42% of the component landscape, while cloud/SaaS deployments account for 55% of implementations as enterprises seek agility without heavy capital outlays. Large enterprises contribute 61.5% of current adoption, yet small and medium enterprises are accelerating as AI networking tools become easier to consume. Network analytics leads all applications with 33% share, and telecom service providers remain the largest end-user group at 47% share. Regionally, North America holds 37% revenue share, but APAC is advancing fastest at 24.9% CAGR thanks to its USD 300 billion AI ecosystem and aggressive 5G rollouts.
Key Report Takeaways
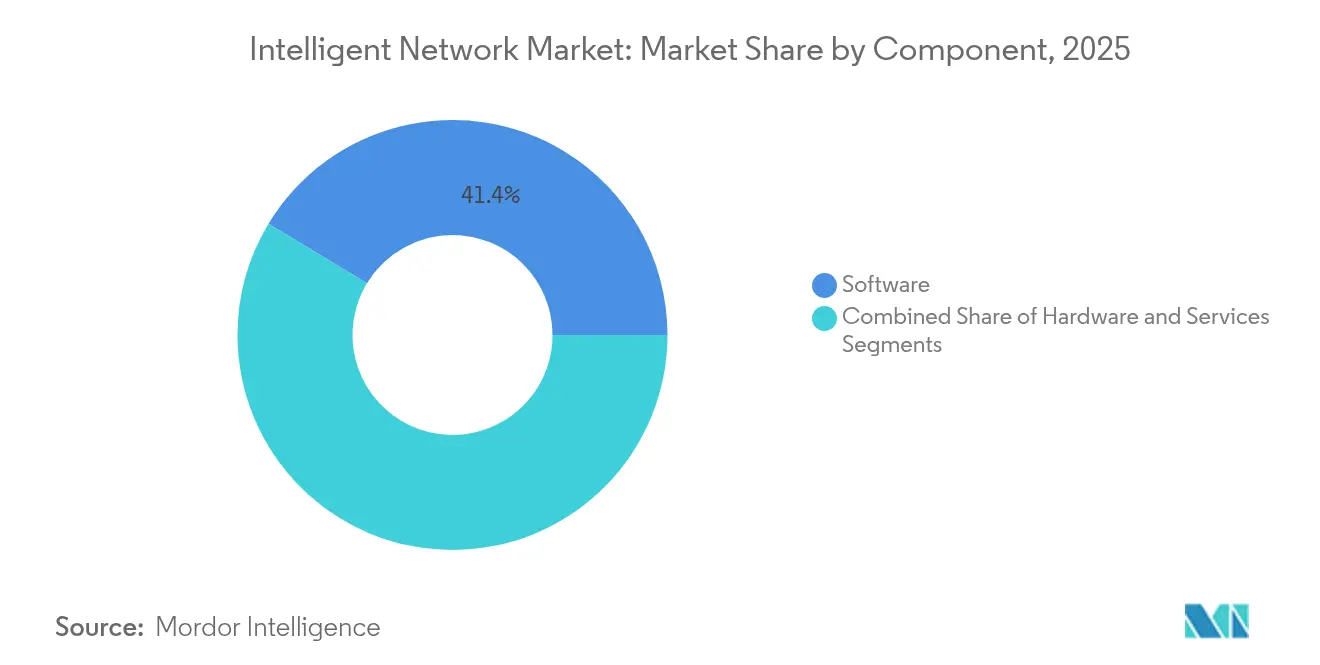
- By component, software automation suites led with 41.35% revenue share in 2025; services are projected to grow at a 23.3% CAGR through 2031.
- By deployment mode, cloud/SaaS held 54.25% of the intelligent network market share in 2025, while hybrid deployments will post the fastest 27.6% CAGR to 2031.
- By enterprise size, large enterprises captured 60.70% share of the intelligent network market size in 2025, whereas SMEs are set to expand at a 25.9% CAGR.
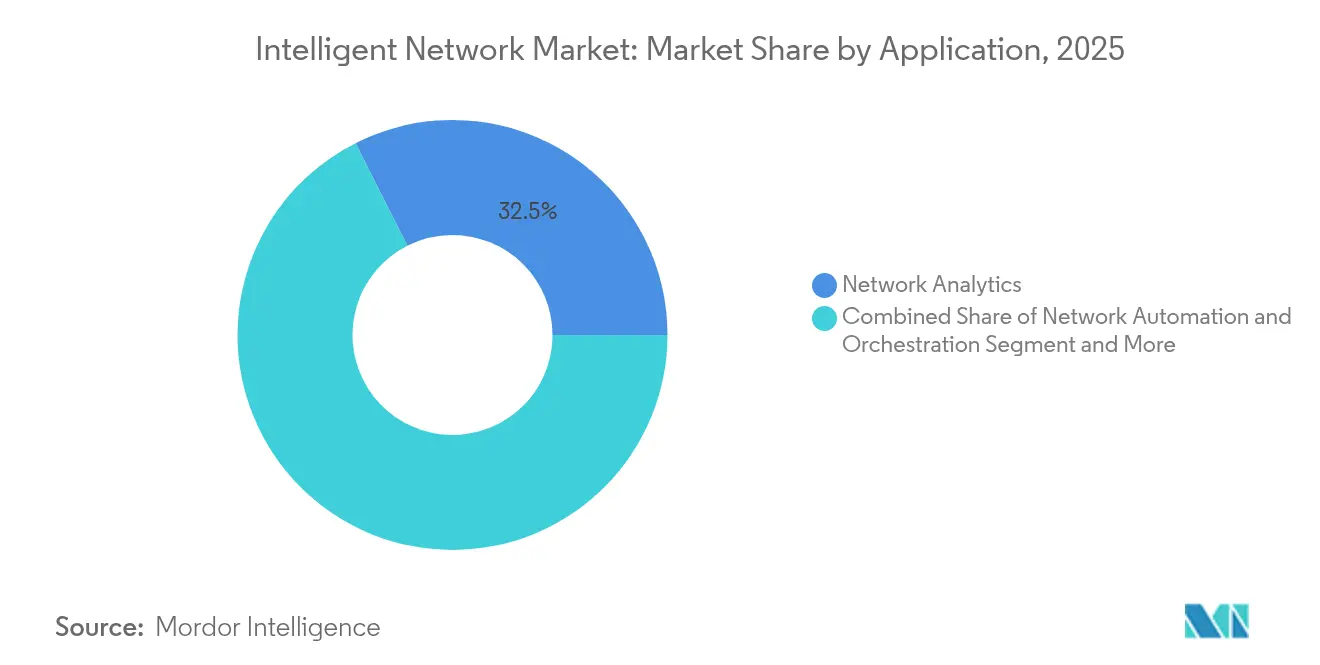
- By application, network analytics accounted for 32.45% of the intelligent network market size in 2025; intent-based networking is forecast to rise at a 26.9% CAGR.
- By end-user, telecom service providers commanded 46.40% intelligent network market share in 2025; hyperscale cloud providers will register the highest 24.1% CAGR.
- By geography, North America contributed 36.65% revenue in 2025, yet APAC will advance at a 23.5% CAGR to 2031.
- Nokia, Infinera and Cisco jointly accounted for a combined 19.55% share of the global optical and core intelligent network market in 2025.
Note: Market size and forecast figures in this report are generated using Mordor Intelligence’s proprietary estimation framework, updated with the latest available data and insights as of 2026.
Global Intelligent Network Market Trends and Insights
Drivers Impact Analysis*
| Driver | (~) % Impact on CAGR Forecast | Geographic Relevance | Impact Timeline | |
|---|---|---|---|---|
| 5G & IoT traffic surge | 4.20% | Global, with APAC leading adoption | Medium term (2-4 years) | |
| Exponential data-center bandwidth demand | 5.80% | North America & EU core, expanding to APAC | Short term (≤ 2 years) | |
| CSP pivot to cloud-native cores | 3.10% | Global, with Europe and North America early adopters | Medium term (2-4 years) | |
| Telco "AI factories" for sovereign AI workloads | 2.40% | National focus, early gains in UAE, Singapore, China | Long term (≥ 4 years) | |
| Energy-efficiency mandates (Scope-3) on networks | 1.90% | EU leading, spreading to North America and APAC | Long term (≥ 4 years) | |
| Open-API monetisation (Network-as-Code) | 2.30% | Global, with hyperscale markets prioritized | Medium term (2-4 years) | |
| Source: Mordor Intelligence | ||||
5G and IoT Traffic Surge Drives Infrastructure Modernization
Mobile data traffic is exploding on newly built 5G networks, with average use in the Gulf expected to hit 30 GB per smartphone in 2025. Operators therefore deploy intelligent networking that reallocates capacity in real time. Ericsson’s intent-based automation project with ATandT illustrates the shift, as the 5G Standalone core now prioritizes slices without manual intervention. Enterprises are also adopting 5G to power smart factories and autonomous vehicles, creating new revenue paths for carriers that embrace AI orchestration.
Exponential Data-Center Bandwidth Demand Reshapes Network Architecture
Hyperscalers such as Lumen Technologies have secured USD 5 billion in AI connectivity contracts, doubling inter-city fiber over the next five years. Arista’s Etherlink AI spine supports 460 Tbps, enabling XPU clusters beyond 100,000 nodes. To meet training loads, operators migrate from 400 G to 800 G and even 1.6 T optics while adopting rollable-ribbon fiber that boosts duct capacity.
CSP Pivot to Cloud-Native Cores Accelerates Automation
Ericsson and Google Cloud now provide a carrier-grade 5G core-as-a-service that scales elastically and troubleshoots via AI, cutting time-to-market for new services. Telefónica’s Autonomous Network Journey aims for a common data fabric and level 4 automation within 18 months, reducing repetitive tasks and OPEX
Telco “AI Factories” Emerge for Sovereign AI Workloads
More than 15 operators intend to build AI data centers valued at USD 100 million each to process confidential workloads locally. These sovereign AI factories appeal to governments and sensitive verticals that cannot ship data overseas and generate a differentiated revenue stream despite limited short-term volume.
Restraints Impact Analysis*
| Restraint | (~) % Impact on CAGR Forecast | Geographic Relevance | Impact Timeline |
|---|---|---|---|
| Scarcity of AI-networking skill sets | -2.80% | Global, acute in North America and Europe | Short term (≤ 2 years) |
| Legacy integration complexity | -2.10% | Global, particularly in established markets | Medium term (2-4 years) |
| Power-draw of AI accelerators inflating OPEX | -1.60% | Data center concentrated regions | Short term (≤ 2 years) |
| Data-sovereignty & cross-border traffic rules | -1.40% | EU, China, emerging in other regions | Long term (≥ 4 years) |
| Source: Mordor Intelligence | |||
Scarcity of AI-Networking Skill Sets Limits Rollouts
High demand for engineers fluent in AI frameworks and routing protocols is pushing wages up and elongating project timelines. Managed services and no-code automation mitigate the gap but only partially.
Legacy Integration Complexity Slows Transformation
Legacy transport, routing and service-edge devices from multiple vendors use proprietary operating systems, element managers and command syntax that rarely map one-to-one with the open YANG or gRPC models underpinning modern intent-based controllers. Engineers therefore spend weeks building translation layers and regression tests to ensure that each policy change in the new controller is rendered accurately on every older platform, a process that inflates migration budgets and extends maintenance windows. Because some legacy chassis lack the API hooks or CPU headroom required for real-time telemetry streaming, operators must keep dual control planes—traditional CLI for brownfield nodes and the new north-bound intent engine for greenfield nodes—until hardware refresh cycles finish, doubling operational complexity and licence fees in the interim. Even after integration, hidden firmware inconsistencies can trigger unplanned resets when software-defined overlays push advanced features like segment routing to devices that were never certified for them, exposing operators to SLA penalties and brand damage. To mitigate those risks, leading carriers build digital-twin test beds that emulate thousands of multivendor nodes, allowing change-impact analysis before live rollout; however, the simulation infrastructure adds fresh capital expense and demands scarce software-testing talent. These factors collectively encourage phased, domain-by-domain transitions—often starting with non-critical enterprise VPN services—rather than a big-bang switchover, thereby deferring a portion of intelligent network spending into later budget cycles.
*Our forecasts treat driver/restraint impacts as directional, not additive. The impact forecasts reflect baseline growth, mix effects, and variable interactions.
Segment Analysis
By Component: Software Automation Suites Lead Transformation
Software automation captured 41.35% of revenue in 2025 and remains the anchor of the intelligent network market. Vendors deliver closed-loop orchestration, anomaly detection and capacity prediction as modular services that shorten mean-time-to-repair. Hardware retains relevance for high-performance routing, though price pressures intensify as white-box alternatives rise. Professional services grow fastest at 23.3% CAGR, covering design, multi-vendor integration and continuous optimization. Their contribution to the intelligent network market size is projected to climb steadily through 2031, reflecting buyers’ need for specialized expertise.
In the second half of the decade, platform-centric models will shift revenue mix further toward subscriptions. Cisco reported 100% security-software growth after recent acquisitions, signalling how incumbents can pivot. Start-ups such as NextHop AI focus on hyperscale scenarios that traditional appliances cannot address, giving operators diversified sourcing options.


By Deployment Mode: Cloud/SaaS Dominates Enterprise Adoption
Cloud/SaaS models accounted for 54.25% of the intelligent network market in 2025 and will expand at 27.1% CAGR, as organizations consume orchestration, analytics and policy as turnkey services. Elastic consumption suits unpredictable AI traffic bursts and sidesteps capital budgeting hurdles. Hybrid models are gaining traction among firms with sovereignty mandates, keeping critical control planes on-premises. This pragmatic mix lets buyers leverage cloud scalability while maintaining compliance. On-premises deployments, although slower, still matter for ultra-low-latency industrial sites.
Advanced SaaS offerings also update autonomously, easing skills shortages while bringing new capabilities online faster. Vendors embed AIOps into service layers, generating predictive insights that reduce ticket volume by up to 50%. Consequently, the intelligent network market share for legacy perpetual-license appliances will likely shrink each year of the forecast period.
By Enterprise Size: Large Organizations Still Dominant but SMEs Accelerate
Large enterprises controlled 60.70% of revenue in 2025 owing to deeper pockets and cross-domain complexity. However, SME demand grows at 25.9% CAGR as simplified cloud consoles and subscription pricing remove historic barriers. Only one in three European SMEs currently prioritize full digitalization; thus, latent upside remains significant. Vendors increasingly launch “SME Express” bundles that orchestrate WAN, LAN and security from a single portal. These packages align with tight budgets, shifting the intelligent network industry toward broader base adoption.
Government subsidy schemes that fund broadband and 5G for smaller businesses also spur adoption. As AI tools become plug-and-play, SMEs will transition from reactive troubleshooting to predictive maintenance, narrowing the digital gap with large rivals by 2030.
By Application: Network Analytics Leads, Intent-Based Networking Surges
Network analytics held 32.45% share in 2025 and continues as the cornerstone of visibility and assurance. Advanced telemetry translates petabytes of flow records into actionable insights that cut outage minutes and improve customer experience scores. Intent-based networking (IBN) shows the fastest 26.9% CAGR. Malaysia’s Digital Nasional Berhad used Ericsson’s Operations Engine to cut complaint resolution time 90%, proving IBN’s operational impact. Automation and policy engines run in parallel, enforcing QoS and compliance across multi-domain estates.
Self-optimizing network functions like Nokia’s MantaRay have scaled past 1 million live cells, underscoring maturity. By 2030, IBN and SON will converge as integrated control loops, providing end-to-end closed-loop assurance. These dynamics will see the intelligent network market size for analytics and IBN applications eclipse all other categories.
By End-User: Telecom Providers Lead, Hyperscalers Accelerate
Telecom service providers owned 46.40% revenue share in 2025, compelled to automate sprawling RAN, transport and core layers while meeting stringent SLA commitments. They pursue zero-touch operations to cut OPEX by up to 40% over five years. Cloud hyperscalers register the fastest 24.1% CAGR, reflecting insatiable AI training bandwidth and preference for bespoke fabrics. Internal development teams at Google and Meta increasingly build ASIC-based switches and open-source NOS yet still rely on specialist vendors for optics and telemetry.
Managed network services players, such as NTT DATA, embed intelligent networking in multi-tenant platforms, differentiating on proactive service assurance. Enterprises across finance, healthcare and manufacturing collectively add steady demand, drawn by measurable ROI through reduced downtime and higher application throughput.
Geography Analysis
North America commands 36.65% of 2025 revenue, fuelled by hyperscaler CAPEX and early adoption of AI orchestration. Lumen’s USD 5 billion AI network contract pipeline highlights sustained investment. Yet the region’s forecast 17.1% CAGR trails global averages as market penetration rises, and competitive intensity grows.
APAC is the engine of future expansion, posting 23.5% CAGR. China’s national AI strategy and large-scale 5G rollouts underpin demand. Singapore and the UAE are creating sovereign AI hubs that require ultra-secure, low-latency connectivity. Regional mobile penetration will reach 50% by 2030, adding 751 million new subscribers and necessitating AI-driven capacity scaling. Major projects such as China Mobile’s terabit optical backbone show commitment to next-generation infrastructure.
Europe maintains moderate growth while leading sustainability mandates. EE’s cell-sleep initiative cut energy use materially, showcasing how green regulation encourages intelligent architectures. Telefónica’s program to achieve level 4 autonomy across EU networks sets the template for operational excellence. However, strict data-sovereignty laws complicate cross-border service delivery, slowing certain pan-regional offerings.

Competitive Landscape
The intelligent network market is moderately concentrated. Cisco leverages its installed base, recording USD 1.25 billion in AI infrastructure orders for fiscal 2025 and pledging USD 1 billion to AI-focused start-ups. Nokia’s USD 2.3 billion Infinera acquisition will yield roughly 20% global optical share, bolstering its North American footprint. Arista exceeded USD 2 billion quarterly revenue for the first time in Q1 2025, propelled by AI cluster networking.
New entrants such as NextHop AI, founded by Arista’s former COO, attracted USD 110 million to target hyperscale niches that require custom silicon and telemetry pipelines unattainable through mainstream hardware. Cloud giants intensify vertical integration; Google aims for level 5 autonomy over its 2-million-mile fiber estate by 2025. Partnerships remain pivotal: Ericsson and Google Cloud fuse telecom-grade cores with cloud elasticity, while Nokia collaborates with Vodafone Idea on region-wide SON deployments.
Service differentiation hinges on depth of AI algorithms, breadth of API exposure and availability of professional services. Incumbents that package hardware, software and managed operations maintain advantage, but specialized start-ups can win where customization and agility trump scale.
Intelligent Network Industry Leaders
Cisco Systems
Huawei
Ericsson
Nokia
Juniper Networks
- *Disclaimer: Major Players sorted in no particular order

Recent Industry Developments
- June 2025: Ericsson and Google Cloud launched carrier-grade 5G Core-as-a-Service with AI troubleshooting, offering elastic scaling for CSPs.
- May 2025: Arista Networks announced record Q1 2025 revenue above USD 2 billion, driven by AI networking demand and new cluster load-balancing technology.
- April 2025: Lumen Technologies partnered with Google Cloud to deliver 400 Gbps AI network links to 50,000+ sites.
- March 2025: Telenor and Ericsson showcased agentic AI for autonomous RAN optimization, reducing manual decisions.


Global Intelligent Network Market Report Scope
An intelligent network is basically a network that provides specific technical capabilities and services outside the standard network spectrum. An intelligent network allows functionality to be flexibly distributed at various nodes on and off the network and also allows the architecture to be modified. This provides the network operator with the ability to develop and control services more efficiently.
| Hardware |
| Software |
| Services |
| On-Premises |
| Cloud / SaaS |
| Small and Medium-sized Enterprises |
| Large Enterprises |
| Network Analytics |
| Network Automation and Orchestration |
| Intent-based Networking |
| Traffic Management and Policy |
| Self-optimising Networks (SON) |
| Telecom Service Providers |
| Cloud / Hyperscale Providers |
| Managed Network Service Providers |
| Enterprises and Verticals |
| North America | United States | |
| Canada | ||
| Mexico | ||
| South America | Brazil | |
| Argentina | ||
| Rest of South America | ||
| Europe | Italy | |
| United Kingdom | ||
| Germany | ||
| France | ||
| Rest of Europe | ||
| Asia-Pacific | India | |
| China | ||
| Japan | ||
| Rest of Asia-Pacific | ||
| Middle East and Africa | Middle East | Israel |
| Saudi Arabia | ||
| United Arab Emirates | ||
| Rest of Middle East | ||
| Africa | South Africa | |
| Nigeria | ||
| Kenya | ||
| Rest of Africa | ||
| By Component | Hardware | ||
| Software | |||
| Services | |||
| By Deployment Mode | On-Premises | ||
| Cloud / SaaS | |||
| By Enterprise Size | Small and Medium-sized Enterprises | ||
| Large Enterprises | |||
| By Application | Network Analytics | ||
| Network Automation and Orchestration | |||
| Intent-based Networking | |||
| Traffic Management and Policy | |||
| Self-optimising Networks (SON) | |||
| By End-user | Telecom Service Providers | ||
| Cloud / Hyperscale Providers | |||
| Managed Network Service Providers | |||
| Enterprises and Verticals | |||
| By Geography | North America | United States | |
| Canada | |||
| Mexico | |||
| South America | Brazil | ||
| Argentina | |||
| Rest of South America | |||
| Europe | Italy | ||
| United Kingdom | |||
| Germany | |||
| France | |||
| Rest of Europe | |||
| Asia-Pacific | India | ||
| China | |||
| Japan | |||
| Rest of Asia-Pacific | |||
| Middle East and Africa | Middle East | Israel | |
| Saudi Arabia | |||
| United Arab Emirates | |||
| Rest of Middle East | |||
| Africa | South Africa | ||
| Nigeria | |||
| Kenya | |||
| Rest of Africa | |||


Key Questions Answered in the Report
What is the current size of the intelligent network market?
The intelligent network market is valued at USD 4.56 billion in 2026 and is on track to reach USD 11.13 billion by 2031, reflecting a 19.57% CAGR during the forecast period (2026-2031).
Which component segment leads the intelligent network market?
Software automation suites lead, holding 41.35% revenue share in 2025, because operators prioritize closed-loop orchestration to trim manual tasks.
Why is APAC the fastest-growing intelligent network region?
APAC benefits from a USD 300 billion AI ecosystem, rapid 5G adoption and sovereign AI initiatives, driving a 23.5% CAGR through 2031.
How are energy-efficiency mandates affecting intelligent network deployments?
EU and UK operators deploy AI power-management tools such as cell-sleep and SON systems, delivering up to 30% energy savings while meeting Net-Zero targets.
Which application is growing fastest within the intelligent network market?
Intent-based networking posts a 26.9% CAGR, illustrated by deployments that cut customer-service tickets 90% and alarm counts 500%.
Page last updated on:


