
Automobile Rental and Leasing Market Size and Share
Market Overview
| Study Period | 2019 - 2031 |
|---|---|
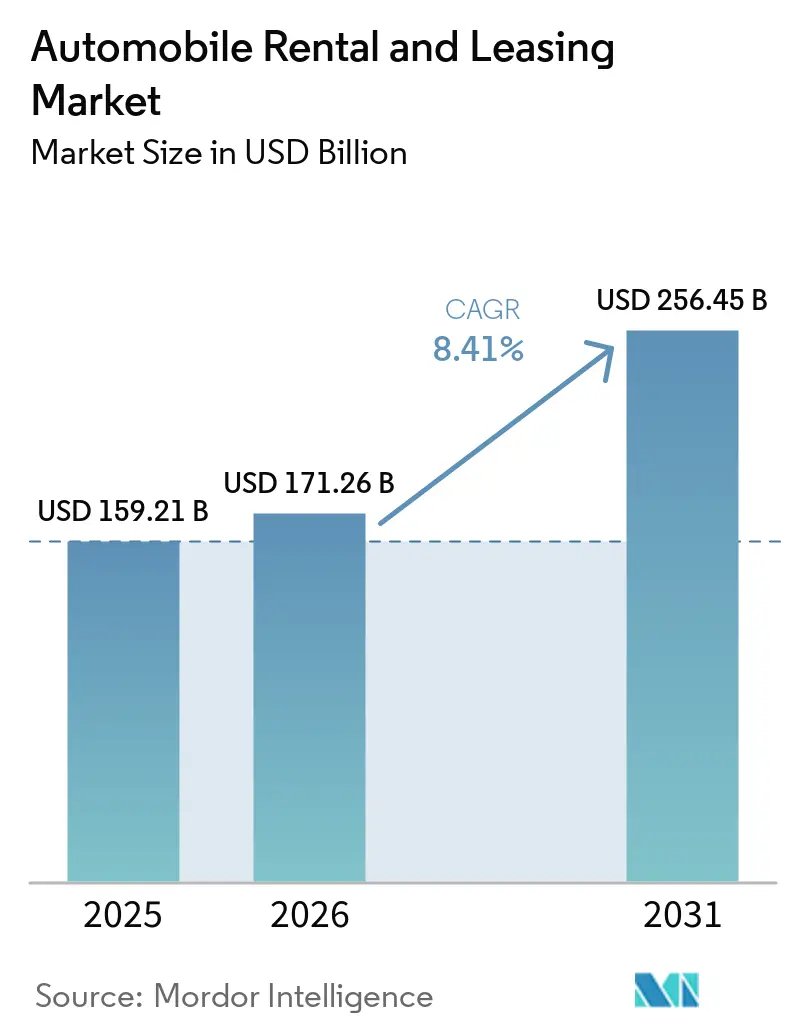
| Market Size (2026) | USD 171.26 Billion |
| Market Size (2031) | USD 256.45 Billion |
| Growth Rate (2026 - 2031) | 8.41 % |
| Fastest Growing Market | Asia Pacific |
| Largest Market | North America |
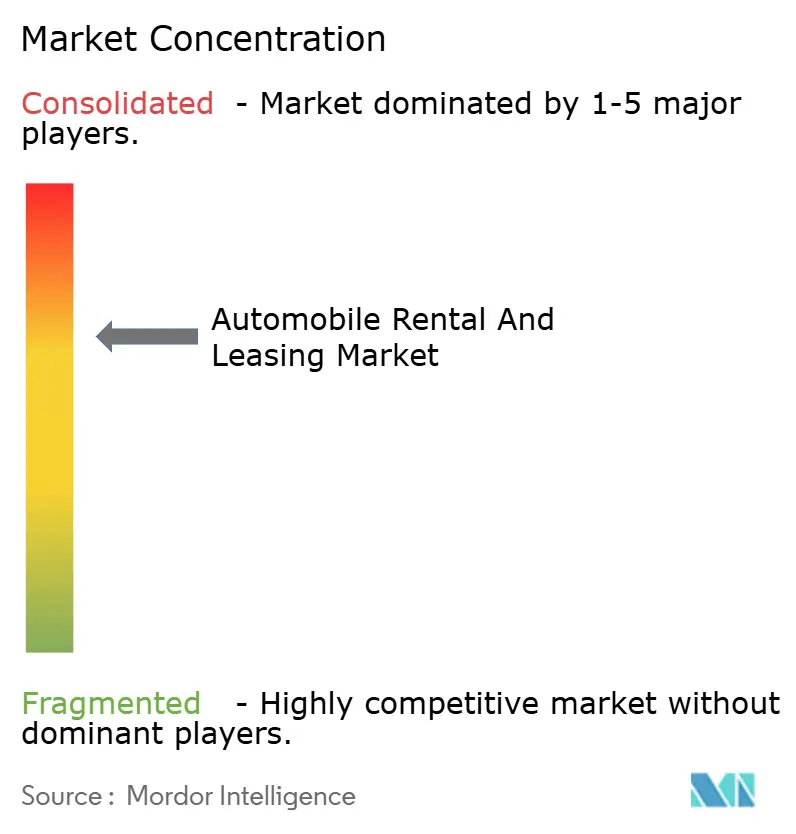
| Market Concentration | Medium |
Major Players *Disclaimer: Major Players sorted in no particular order Image © Mordor Intelligence. Reuse requires attribution under CC BY 4.0. | |
Automobile Rental and Leasing Market Analysis by Mordor Intelligence
The automobile rental and leasing market size was valued at USD 159.21 billion in 2025 and estimated to grow from USD 171.26 billion in 2026 to reach USD 256.45 billion by 2031, at a CAGR of 8.41% during the forecast period (2026-2031). Growth rests on structural shifts such as mandatory fleet electrification, vehicle-to-grid pilots that monetize idle assets, and AI-driven yield tools incorporating more than 50 real-time variables. Operators must absorb a decent collapse in electric-vehicle residual values while securing incremental grid-services income and managing a financing environment where fleet acquisition costs rose significantly between 2023 and 2025. Divergent segment dynamics are visible: commercial vehicles outpace passenger cars as e-commerce logistics reshapes last-mile delivery, and leasing expands faster than rentals as corporates seek off-balance-sheet solutions. Competitive intensity has deepened with peer-to-peer platforms capturing a minimum of United States leisure bookings and incumbents launching counter-models.
Key Report Takeaways
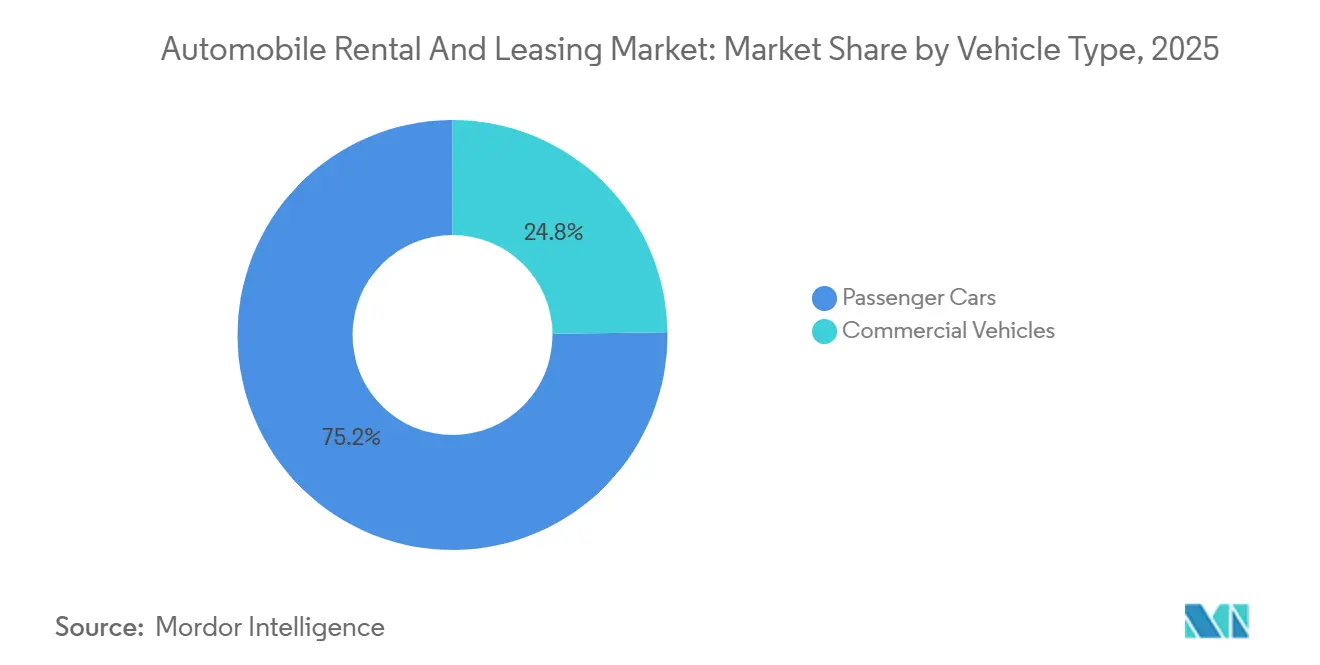
- By vehicle type, passenger cars led with 75.16% revenue share in 2025; commercial vehicles are forecast to expand at an 8.43% CAGR to 2031.
- By service type, rental services held 67.37% of the automobile rental and leasing market share in 2025, while leasing recorded the highest projected CAGR at 8.51% through 2031.
- By mode of booking, online channels accounted for 63.23% of transactions in 2025 and are advancing at an 8.45% CAGR through 2031.
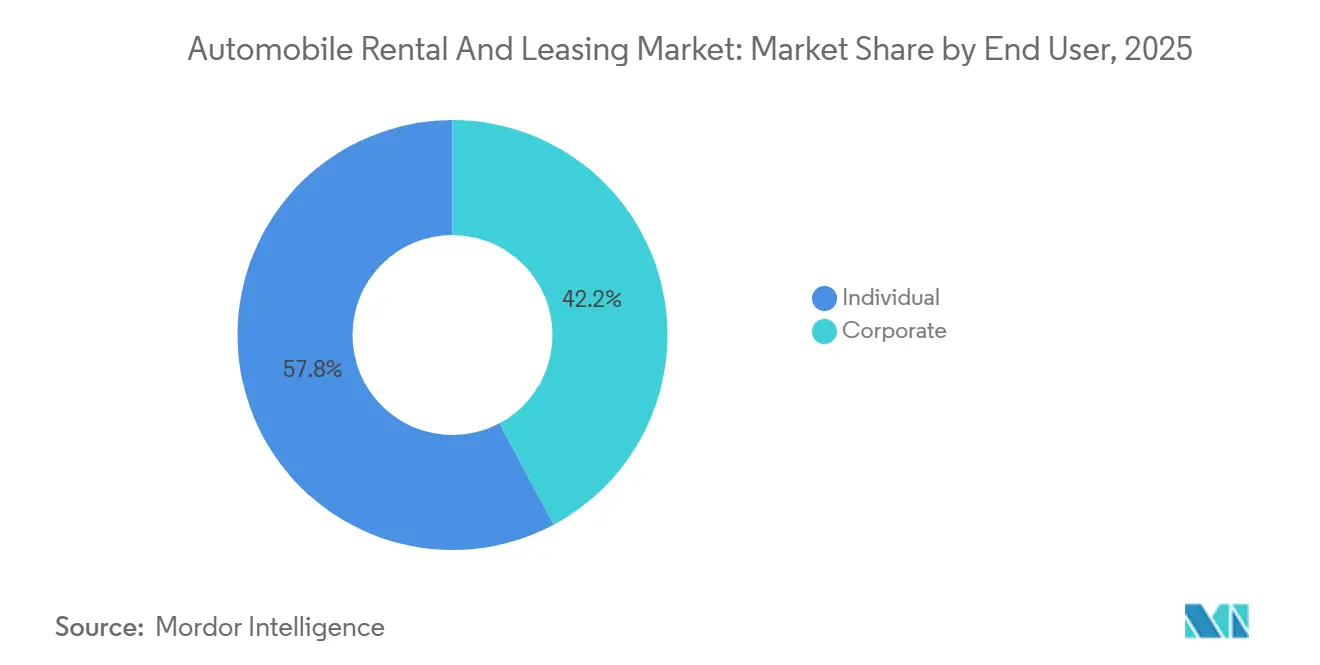
- By end user, individual customers represented 57.75% of 2025 revenue, whereas corporate demand is forecast to rise at an 8.54% CAGR to 2031.
- By propulsion, internal-combustion vehicles made up 81.26% of the 2025 fleet inventory; electric vehicles are growing fastest at an 8.56% CAGR through 2031.
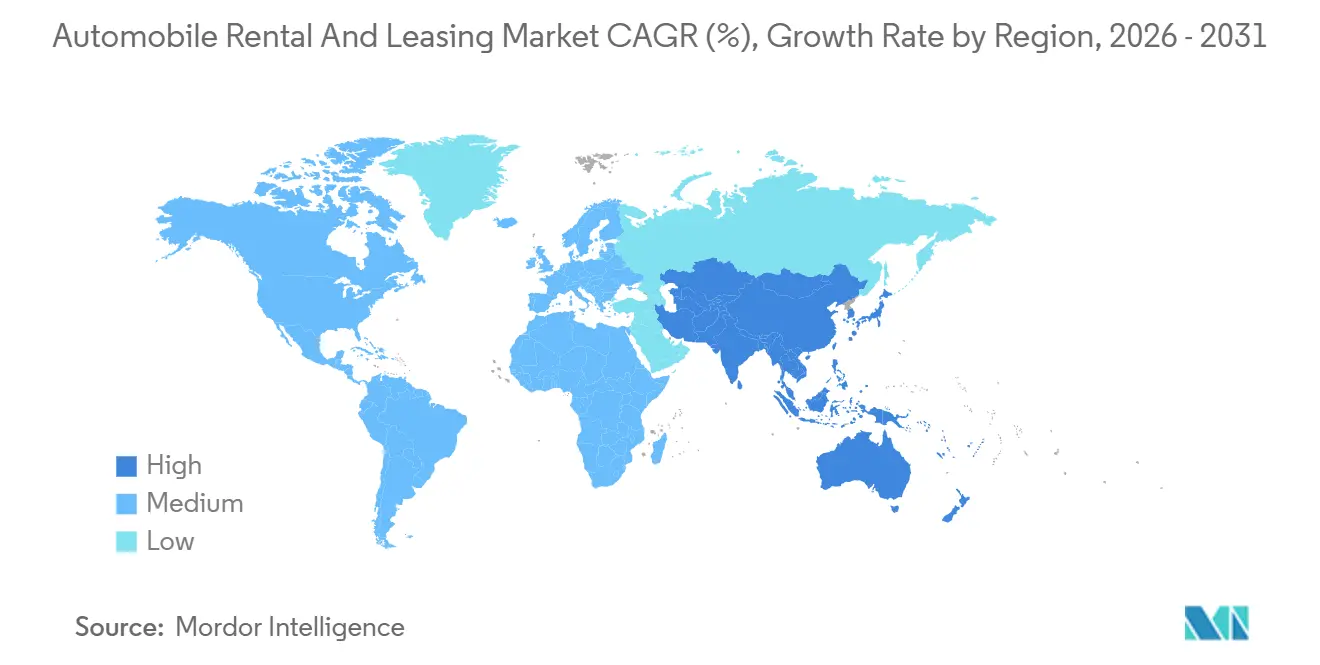
- By geography, North America led with 32.37% of 2025 revenue, while Asia Pacific is set to grow at an 8.47% CAGR to 2031.
Note: Market size and forecast figures in this report are generated using Mordor Intelligence’s proprietary estimation framework, updated with the latest available data and insights as of January 2026.
Global Automobile Rental and Leasing Market Trends and Insights
Drivers Impact Analysis*
| Driver | (~) % Impact on CAGR Forecast | Geographic Relevance | Impact Timeline |
|---|---|---|---|
| Recovery in Global Business and Leisure Travel | +1.5% | Global, with North America and Europe leading business travel normalization | Short term (≤ 2 years) |
| Government Incentives Accelerating Fleet Electrification | +1.2% | North America (IRA credits), Europe (Clean Vehicles Directive), China (NEV mandate) | Medium term (2-4 years) |
| E-Commerce-Led Demand | +1.0% | North America and Europe for last-mile delivery; Asia Pacific tier-2/3 cities | Medium term (2-4 years) |
| Mobile/Online Booking Penetration Surge | +0.8% | Global, with Asia Pacific core showing highest conversion rates, spill-over to Middle East and Africa | Short term (≤ 2 years) |
| AI-Enabled Dynamic Pricing and Predictive Maintenance | +0.7% | Global, early gains in North America and Western Europe | Long term (≥ 4 years) |
| Vehicle-To-Grid (V2G) Revenue Streams Turn Rental Fleets into Grid Assets | +0.5% | National pilots in California, NYC, Balearic Islands; early commercial deployment | Long term (≥ 4 years) |
| Source: Mordor Intelligence | |||
Recovery in Global Business and Leisure Travel
By mid-2025, business trips nearly returned to pre-pandemic levels. In contrast, leisure journeys not only recovered but also exceeded previous benchmarks. This increase in leisure travel has driven corporate daily rates significantly higher than leisure rates [1]“2025 Air Passenger Market Update,” International Air Transport Association, iata.org. Fleet managers are now leveraging AI forecasting, repositioning vehicles well in advance of major events. A prominent European operator, after integrating predictive rebalancing, reported a notable improvement in asset utilization. Saudi Arabia, with its Vision 2030 initiative, aims to attract a substantial number of visitors by the end of the decade. This ambitious target, combined with relatively low rental penetration compared to more developed markets, indicates strong multi-year demand. While recovery is uneven, China's domestic traffic has fully rebounded, yet international arrivals remain significantly below pre-pandemic levels.
Government Incentives Accelerating Fleet Electrification
The U.S. Inflation Reduction Act provides commercial electric vehicles (EVs) with significant subsidies, leading to a notable reduction in their five-year total cost of ownership [2]“Inflation Reduction Act of 2022,” U.S. Congress, congress.gov . Under Europe’s Clean Vehicles Directive, a substantial portion of public procurements must be zero-emission within the next few years. This mandate is pushing private lessors to electrify their fleets to maintain airport concessions. In China, a dual-credit policy is set to effectively prohibit new internal combustion engine (ICE) rentals in major cities in the near future. Meanwhile, California is bolstering the case for electrification by offering competitive peak-hour vehicle-to-grid (V2G) tariffs [3]“Vehicle-Grid Integration Tariffs,” California Air Resources Board, arb.ca.gov . As a result, operators are strategically timing their deployments in areas with the most lucrative subsidies, leading to a significantly higher ratio of EVs to ICEs in California compared to rural Midwest regions.
E-Commerce-Led Demand for Flexible Truck and Van Leasing
In recent years, a major North American lessor experienced a significant increase in short-term van contracts, influenced by Amazon's commitment to deploy a substantial number of electric vans by the end of the decade. A major deal finalized in the middle of the decade is set to provide thousands of electric vans to regional carriers across the United States and Canada. Leasing durations in smaller cities have notably decreased over time, reflecting the rising demand for flexibility. With stricter environmental regulations anticipated in the near future, the ownership risk is increasingly shifting towards lessors.
Mobile/Online Booking Penetration Surge
In 2025, digital channels dominated bookings, with a significant portion facilitated through mobile apps. Super-apps in the Asia Pacific region demonstrated much higher conversion rates compared to standalone sites, primarily due to their bundled itineraries. Contactless pick-up has become a standard expectation; for instance, one global brand's app significantly reduced transaction times, leading to notable labor cost savings. Using proprietary algorithms, upsell offers are enhanced by real-time weather, events, and browsing signals, resulting in a substantial year-over-year increase in ancillary revenue per rental. However, capital expenditure remains a challenge, as telematics and software subscriptions incur considerable costs annually for each vehicle.
Restraints Impact Analysis*
| Restraint | (~) % Impact on CAGR Forecast | Geographic Relevance | Impact Timeline |
|---|---|---|---|
| Rising Vehicle Acquisition and Financing Costs | -0.9% | Global, with acute pressure in North America and Europe due to elevated interest rates | Short term (≤ 2 years) |
| Intensifying Competition from Ride-Hailing and P2P Car-Sharing | -0.7% | North America and Europe urban markets; emerging in Asia Pacific tier-1 cities | Medium term (2-4 years) |
| EV Residual-Value Volatility and Repair-Cost Uncertainty | -0.6% | North America and Europe, where EV adoption is concentrated | Medium term (2-4 years) |
| Heightened Cybersecurity and Data-Privacy Liabilities | -0.4% | Global, with regulatory focus in EU (GDPR) and North America (CCPA, state laws) | Long term (≥ 4 years) |
| Source: Mordor Intelligence | |||
Rising Vehicle Acquisition and Financing Costs
Over the forecast period, fleet prices experienced significant growth, driven by rising interest rates, which reached their peak in mid-2024. Each substantial increase in interest rates added notable annual interest costs per vehicle, exerting pressure on EBITDA margins. Original-equipment makers raised fleet list prices due to inflation in battery material costs, while smaller operators, lacking the advantage of volume leverage, were forced to pay full sticker prices. To manage capital expenditures, fleets have extended their average hold periods. However, this strategy has led to higher maintenance expenses and increased exposure to residual-value risks.
EV Residual-Value Volatility and Repair-Cost Uncertainty
In 2024, prices for used electric vehicles (EVs) experienced a significant decline. This drop was driven by rapid technological advancements that surpassed the demand for resales. As a result, a prominent operator faced substantial financial losses after selling off a large number of units. Repairing EVs has become notably more expensive compared to internal combustion engine (ICE) vehicles, primarily due to the need for specialized labor and limited availability of parts. Additionally, replacing an EV battery can impose a considerable financial burden, especially for vehicles owned for a short period. On the insurance front, premiums for EVs are noticeably higher than those for ICE vehicles, reflecting uncertainties in risk assessment. While original equipment manufacturers (OEMs) are beginning to offer residual-value guarantees—such as a minimum value assurance on popular models—these guarantees remain limited in scope.
*Our forecasts treat driver/restraint impacts as directional, not additive. The impact forecasts reflect baseline growth, mix effects, and variable interactions.
Segment Analysis
By Vehicle Type: Commercial Demand Accelerates on Last-Mile Logistics
Passenger cars captured 75.16% of 2025 revenue, whereas commercial vehicle rental and leasing is forecast to advance at an 8.43% CAGR, eclipsing overall automobile rental and leasing market growth. E-commerce giants and regional couriers are driving the surge, opting for flexible leases to navigate seasonal peaks. A significant contract, finalized recently, will deploy thousands of electric vans with last-mile carriers across North America, highlighting the industry's shift towards electrified fleets. In rural tier-3 cities, where volumes fluctuate, shorter leases—averaging a little over two years—are becoming the norm. While passenger cars maintain a dominant market share, they're feeling the pinch from peer-to-peer services that undercut daily rates, especially in dense urban areas where parking costs deter ownership.
Passenger vehicles are reaping the benefits of a travel resurgence, commanding premium daily rates from corporate clients. However, their market dominance belies a growing vulnerability: urban hubs like Manhattan and London have witnessed a noticeable dip in short-term rentals over the past couple of years, a decline somewhat balanced by growth in suburban and leisure markets. On the commercial front, clients are gravitating towards bundled services—maintenance, telematics, and driver training—creating switching barriers that peer-to-peer models struggle to overcome. With stricter environmental regulations complicating compliance, many are turning to specialist lessors for outsourcing.


By Service Type: Leasing Gains Ground as Corporations Seek Balance-Sheet Relief
Rental captured 67.37% of 2025 spend, but leasing expands at an 8.51% CAGR, outperforming the broader automobile rental and leasing market. Enterprises gravitate toward leases that shift rising interest-rate exposure and residual risk to service providers. In recent times, a newly merged European lessor, overseeing a large fleet of vehicles, revealed that a significant portion of its contracts featured early-termination flexibility, marking a notable increase compared to previous years. Meanwhile, in North America, inquiries for electric vehicle (EV) leases experienced substantial growth, driven by tax credits that effectively reduced acquisition costs.
Rentals continue to play a pivotal role for both leisure and short-term business travelers. This trend is bolstered by AI-driven pricing strategies, which significantly boosted one company's revenue per available vehicle. However, the short hold periods of these rentals have led to pronounced shocks from EV depreciation. A testament to this is a major operator's substantial financial write-down following the sale of its used electric sedans. On a different note, subscription models are gaining traction. A prominent pilot program in Germany exemplifies this trend, offering customers the flexibility to swap cars multiple times a month for a flat fee, blending the agility of rentals with the predictability of leasing.
By Mode of Booking: Digital Channels Dominate as Super-Apps Scale
Online channels controlled 63.23% of 2025 deals and are set to widen their lead at an 8.45% CAGR, outpacing the overall automobile rental and leasing market. Super-apps in the Asia Pacific region are achieving impressive conversion rates by seamlessly integrating car bookings into comprehensive door-to-door itineraries. Recognizing the value of app users, a leading global operator made a significant investment in mobile-centric loyalty features, having discovered that these users come with notably reduced acquisition costs and enhanced lifetime value.
Despite the digital surge, offline bookings retain their significance, especially in regions where digital adoption is still catching up or where regulations mandate in-person validations. In recent times, older travelers have constituted a substantial portion of offline reservations. Airport desks have become a crucial backup, stepping in when digital bookings falter or when upgrades are sought. However, the push for capital upgrades remains unyielding: smaller fleets are feeling the strain of consistent expenditures on telematics and contactless technologies.
By End User: Corporate Demand Surges Under Electrification Mandates
Individuals provided 57.75% of 2025 revenue, but corporate clients will climb faster at an 8.54% CAGR through 2031. Europe’s Corporate Sustainability Reporting Directive requires large companies to disclose their Scope 3 travel emissions, encouraging them to adopt electrified rental and leasing solutions. In 2024, the majority of new European contracts specified vehicle-swap flexibility to manage macro uncertainty.
Peer-to-peer services attract price-sensitive leisure segments, while corporates prioritize data security and regulatory compliance. Operators holding ISO 27001 certification now win fleet tenders at minimal premiums, a clear moat as telematics proliferate. Cyber insurers reinforce the gap by hiking premiums for non-certified providers.
By Propulsion Type: EVs Grow Fastest Despite Depreciation Risk
The automobile rental and leasing market size tied to internal-combustion vehicles remained dominant in 2025 with 81.26% share; however, electric vehicles represent the fastest-growing segment, projected to scale at an 8.56% CAGR. U.S. tax credits, EU directives, and China’s dual-credit scheme underpin uptake.
Yet, 2024’s plunge in used-EV prices—and repair bills that can run up to half of those for higher ICE equivalents—exposes fleets to depreciation shocks. OEM residual guarantees and battery-health monitoring offer partial relief, while V2G pilots demonstrate potential to earn USD 800 per vehicle annually and shave charging bills by one-fifth.
Geography Analysis
North America produced 32.37% of 2025 revenue and matches the overall CAGR as market maturity limits upside. The Inflation Reduction Act accelerates EV adoption, and California’s V2G tariffs reward bidirectional charging. Peer-to-peer penetration reached a minimum of leisure bookings, prompting incumbents to launch counter-platforms. The 2024 ransomware incident that froze 15,000 sites drove a wave of ISO 27001 certifications as corporate buyers harden cybersecurity requirements.
Asia Pacific is the fastest-growing region, advancing at an 8.47% CAGR. China’s dual-credit rules will bar fresh ICE rentals in key cities after 2027, while India’s corporate leasing grows despite charging-infrastructure gaps. Super-apps such as Grab and WeChat triple booking conversion rates. However, regulatory fragmentation—like India’s differential GST—complicates cross-border fleet allocation. Europe shows steady expansion fueled by electrification mandates. Subscription schemes proliferate in Germany and the UK, where customers can swap cars three times a month. Seasonal volatility in Southern Europe inflates idle-fleet costs up to two-fifths off-peak, spurring adoption of dynamic pricing tied to local event calendars. A 200-vehicle V2G project in Spain’s Balearic Islands stabilized the grid during tourist surges.
South America remains concentrated, with a Brazilian operator holding the majority of regional share. Currency-hedged leasing shields corporate customers from real and peso volatility. Elevated interest rates- Brazil’s Selic at elevated levels in mid-2025- curb fleet financing, though e-commerce drives van leasing. The Middle East and Africa gain structural support from Saudi Arabia’s plan to attract 100 million visitors by 2030. Rental duration averages 12 days, triple the global mean. The UAE capitalizes on high-net-worth tourism, expanding luxury and electric catalogs, while South Africa contends with crime-related insurance premiums. Turkey is emerging as a regional hub, blending tourism and cross-border rentals.

Regulatory Landscape
Regulation is increasingly shaping fleet composition, data handling, and financing structures in global rental and leasing. In North America, electrification incentives such as the US Inflation Reduction Act support commercial EV adoption, while California's vehicle-grid integration tariffs reinforce the business case for bidirectional charging and managed charging for fleets. In Europe, procurement and emissions-disclosure regimes, including the Clean Vehicles Directive and the Corporate Sustainability Reporting Directive, push corporate and airport-linked fleets toward zero-emission options. In China, the dual-credit policy trajectory includes tighter constraints on new ICE rentals in major cities after 2027.
Capital-market and consumer-protection compliance also affects fleet funding and contracting. In the United States, asset-backed fleet securitizations are structured to meet risk-retention requirements, illustrated by Avis Budget Rental Car Funding (AESOP) LLC issuing USD 650 million of asset-backed securities in June 2026. Heightened data-privacy and cybersecurity obligations, including GDPR in the EU and state-level privacy rules such as CCPA in the United States, are raising expectations for telematics-rich operations, which reinforces the role of ISO 27001-aligned security controls in winning corporate tenders and sustaining airport and enterprise accounts.
Value Chain Analysis
The automobile rental and leasing value chain spans vehicle and technology sourcing, fleet financing, operations, and remarketing, then distribution via online and offline channels into corporate travel and logistics accounts. Upstream, operators obtain vehicles from OEMs and dealers, add telematics, charging access for EV fleets, and software capabilities such as dynamic pricing and predictive maintenance, and then finance fleets using bank facilities and securitization vehicles, supported by insurance coverage for vehicles and liability. Mid-chain work centers on depot and airport operations, vehicle preparation, maintenance and repair networks, damage management, and compliance workflows for driver verification and data governance.
Downstream, sales and distribution increasingly route through apps, super-app partners, and platform integrations, while enterprise contracts for corporate mobility, government, and last-mile logistics drive multi-vehicle leasing with bundled services. The chain also depends on complementary sectors, particularly monetary intermediation, non-life insurance, and IT services, because fleet economics remain sensitive to interest rates, residual values, and software and connectivity costs. Recent partnerships that extend beyond traditional rental, such as Hertz (via Oro Mobility) providing end-to-end fleet operations for Uber programs announced in April 2026, underscore the growing value of third-party mobility orchestration alongside charging and depot management.
Competitive Landscape
Enterprise, Hertz, Avis, Sixt, and Europcar, the top five providers, collectively account for a significant portion of global revenue, indicating a moderately concentrated market. While incumbents focus on fleet electrification and AI-driven yield management to protect their margins, peer-to-peer disruptors have carved out a notable share of United States leisure bookings, leveraging price leadership and hyper-local availability. Technology is becoming a crucial differentiator; fleets boasting ISO 27001 accreditation are securing corporate contracts at minimal premiums, a trend driven by intensified scrutiny on cybersecurity.
OEM alliances are becoming increasingly strategic. For instance, a prominent German OEM is now offering a substantial guarantee on the residual value of its crossover vehicles leased to commercial fleets, effectively transferring the depreciation risk. Meanwhile, specialists in commercial vehicles are capitalizing on emerging opportunities: a North American lessor recorded a significant surge in short-term van contracts, and a major multiyear agreement is set to provide a large number of electric vans to regional carriers.
There's a noticeable acceleration in platform convergence. For example, a Florida-based pilot program from an established player allows private owners to list their vehicles, echoing the economics of disruptors. Additionally, another operator has teamed up with a leader in autonomous driving, launching self-driving rentals in both Phoenix and San Francisco, aiming for round-the-clock utilization and reduced labor expenses. In the Asia Pacific, consolidation is evident as a leading Chinese firm expands its new-energy fleet, while an Indian counterpart is navigating liquidity challenges and considering strategic partnerships.
Automobile Rental and Leasing Industry Leaders
Enterprise Holdings
The Hertz Corporation
BlueLine Rental
LeasePlan
Avis Budget Group
- *Disclaimer: Major Players sorted in no particular order

Market Opportunities and Future Outlook
A major whitespace is emerging around fleet operations as a managed service for autonomous and platform-led mobility, where incumbents can monetize capabilities in maintenance, charging logistics, and depot execution beyond daily rentals. This direction is supported by concrete steps including Hertz launching Oro Mobility and partnering with Uber in April 2026 to manage fleet assets and operations across San Francisco, Los Angeles, and Northern New Jersey for autonomous robotaxi and driver-led programs. Avis Budget Group also announced a multi-year partnership with Waymo in July 2025 to support fleet operations for an autonomous ride-hailing service in Dallas, with a public launch scheduled for 2026, which points to demand for scalable fleet management, readiness processes, and uptime discipline.
Another opportunity sits in expanding subscription and leasing propositions in underpenetrated markets and segments where customers want flexibility without ownership risk, particularly as electrification mandates and Scope 3 travel disclosures reshape corporate procurement. In India, Nissan Motor India and Avis India announced a partnership in April 2026 to offer leasing and subscription options for models including the Nissan Magnite and GRAVITE, indicating room for OEM-lessor collaboration to widen vehicle access with bundled maintenance and service wrappers. Across regions, packaged offerings that combine vehicle, maintenance, telematics, and charging access for EV fleets can raise switching barriers while helping operators manage EV residual-value volatility and higher repair-cost uncertainty, alongside regulatory pressure on emissions and data security.
Recent Industry Developments
- May 2026: Avis Budget Group priced a private offering of $300 million aggregate principal amount of 8.000% senior notes due 2031 to redeem existing debt. The refinancing supports liquidity and helps fund fleet capacity expansion and ongoing strategy execution.
- May 2026: Enterprise Holdings awarded multiple contracts to supply vehicle rental services at over 50 U.S. military bases and installations in the United States and Germany. These government contracts broaden Enterprise's institutional revenue and diversify workloads across defense and civilian fleets.
- April 2026: Hertz Global Holdings launched affiliated operating company Oro Mobility to provide end-to-end fleet management solutions and partnered with Uber to support autonomous robotaxi and driver-led fleet operations. The initiative extends Hertz into autonomous and mobility-as-a-service ecosystems, targeting higher utilization and new revenue models.


Research Methodology Framework and Report Scope
Market Definition and Coverage
This market is defined as the revenue generated from providing passenger and commercial vehicles on rent or on lease to individual and corporate users, across online and offline booking channels, at a global level.
Scope exclusions: vehicle retail sales, pure financing or loans without a rental or lease contract, and consumer ride-hailing fares are excluded.
Segmentation Overview
- By Vehicle Type
- Passenger Cars
- Commercial Vehicles
- By Service Type
- Rental
- Leasing
- By Mode of Booking
- Online
- Offline
- By End User
- Individual
- Corporate
- By Propulsion Type
- Internal Combustion Engine (ICE)
- Electric Vehicles (EVs)
- By Geography
- North America
- United States
- Canada
- Rest of North America
- South America
- Brazil
- Argentina
- Rest of South America
- Europe
- Germany
- United Kingdom
- France
- Italy
- Spain
- Rest of Europe
- Asia Pacific
- China
- India
- Japan
- South Korea
- Rest of Asia Pacific
- Middle East and Africa
- United Arab Emirates
- Saudi Arabia
- South Africa
- Turkey
- Rest of Middle East and Africa
- North America
Data Sources, Market Sizing, and Validation
Desk Research
Desk research was used to set the market boundaries and to build the starting demand pool by region. We relied on public transportation and mobility indicators, travel demand proxies, and vehicle fleet signals, which are then translated into rental days and active leased vehicle (lease parc) assumptions.
Key references included sources such as the International Air Transport Association (air passenger traffic), the International Energy Agency (vehicle fleet and electrification indicators), the World Bank and IMF (macro and FX context), OECD and national transport ministries (mobility and vehicle statistics), and UN Comtrade-style trade statistics for vehicle flows where helpful. We also reviewed company annual reports, investor presentations, and reputable business press for pricing commentary, utilization trends, and fleet procurement constraints. In addition, paid subscriptions for company financials and news intelligence, shipment-level trade data, and patent databases were selectively used to cross-check directional signals. These examples are not exhaustive, and many other public and paid sources were also used for data collection, validation, and clarification.
Primary Interviews and Surveys
Primary work focused on validating the split between rental and leasing, typical utilization and downtime, and how pricing moves across seasons and regions. We spoke with operators, fleet managers, channel partners, and large corporate users across APAC, EMEA, and the Americas, so desk-research assumptions could be corrected where local usage patterns differed.
Distribution of primary research fieldwork respondents
| Company type | Respondent position | Region |
|---|---|---|
| Top tier: 28% | CXOs: 13% | APAC: 45% |
| Mid tier: 53% | Functional/Unit leaders: 43% | EMEA: 37% |
| Smaller Players: 19% | Managers: 44% | Americas: 18% |
Market-Sizing & Forecasting
Sizing starts from a top-down build where travel activity and vehicle parc indicators are used to reconstruct a realistic pool of rental days and active leased vehicles by region, which are then valued using blended daily and monthly rate assumptions. Once the model is built, we corroborate totals with selective bottom-up approximations, such as sampling operator revenues by region, checking utilization rates, and testing average price multiplied by volume for key vehicle categories.
Inputs that matter in this market included airport and non-airport travel intensity, fleet size and replacement cycles, utilization and downtime patterns, average length of rent and lease terms, and the pace of EV adoption that changes acquisition costs and residual value expectations. Forecasts were produced using scenario analysis, where macro variables, travel recovery paths, and fleet cost outlooks were stress-tested, and then aligned to the consensus ranges heard in interviews. Where revenue disclosure is limited, we handled gaps by using region-level proxies (for example, vehicle parc and travel indicators) and by applying conservative utilization and pricing bands before final reconciliation.
Data Validation & Update Cycle
Validation is done through a practical triangulation loop. Model outputs are checked against independent signals such as reported revenue trends, fleet procurement commentary, travel volumes, and broad utilization indicators, and then the largest variances are reviewed to identify the specific assumption that caused them.
Before sign-off, the model is reviewed in multiple steps, including cross checks across regions and service types so totals do not drift away from observable demand. If a major shock occurs (for example, sharp interest-rate moves, large fleet supply constraints, or regulation-led shifts in electrification), we re-contact selected respondents and refresh key assumptions. Reports are refreshed annually, and a final pre-delivery pass is performed so clients receive the latest updated view.
Mordor Intelligence's Global Automobile Rental and Leasing Market Size Compared With Other Published Estimates
Published market values for automobile rental and leasing do not always match because firms often count different revenue streams, pick different base years, and use different approaches to move pricing and utilization through the cycle. Currency conversion timing and how online intermediated bookings are treated can also widen the spread.
The benchmark table shows a noticeable range, and in Mordor Intelligence's model the market value is tied to operator revenue from rental and leasing services across passenger and commercial vehicles, rather than counting broader automotive equipment leasing or unrelated finance-only volumes. Differences also come from how daily rates are averaged across airport and off-airport demand, how EV fleet costs are reflected in pricing, and whether the forecast assumes steady normalization of utilization versus a faster rebound case.
Benchmark comparison
| Source | Market Size | Gaps in Research Methodology |
|---|---|---|
| Mordor Intelligence | USD 171.26 B (2026) | |
| Trade Journal A | USD 457.10 B (2024) | Uses a broader automotive equipment rental and leasing definition that can include equipment categories beyond automobiles and may combine rental, leasing, and adjacent service revenues, which inflates totals versus a vehicle service revenue view. |
| Industry Association B | USD 500.00 B (2024) | Reports European new leasing volumes and can reflect contract value flow rather than operator revenue recognized, and it also covers non-automotive leasing categories in the overall total, which makes direct global comparison difficult. |
Taken together, the comparisons suggest that scope and revenue recognition choices drive most of the gaps, more than simple math differences. By keeping the model anchored to clear demand and pricing variables that can be checked by region, the final number stays traceable and repeatable even when data coverage varies across countries.


Key Questions Answered in the Report
How large will global automobile rental and leasing revenue be by 2031?
Revenue is projected to reach USD 278.01 billion by 2031, expanding at an 8.41% CAGR during the forecast period (2026-2031).
Which region is set to grow fastest through 2031?
Asia Pacific leads with an expected 8.47% CAGR, propelled by electrification mandates and super-app integration.
Why are corporates shifting from renting to leasing vehicles?
Leasing shifts residual-value and interest-rate risk to the lessor, offers flexible swap terms, and unlocks tax incentives for electric fleets.
What is driving commercial-vehicle leasing demand?
E-commerce logistics requires short-duration van capacity, and new Euro 7 standards make ownership riskier, so operators prefer flexible leases.
How are operators mitigating electric-vehicle depreciation risk?
Strategies include OEM residual-value guarantees, battery-health monitoring, longer holding periods, and monetizing idle EVs through vehicle-to-grid programs.
Page last updated on:


 Your data is secure and never sold or shared.


