Market Overview
| Study Period | 2019 - 2031 |
|---|---|
| Forecast Data Period | 2026 - 2031 |
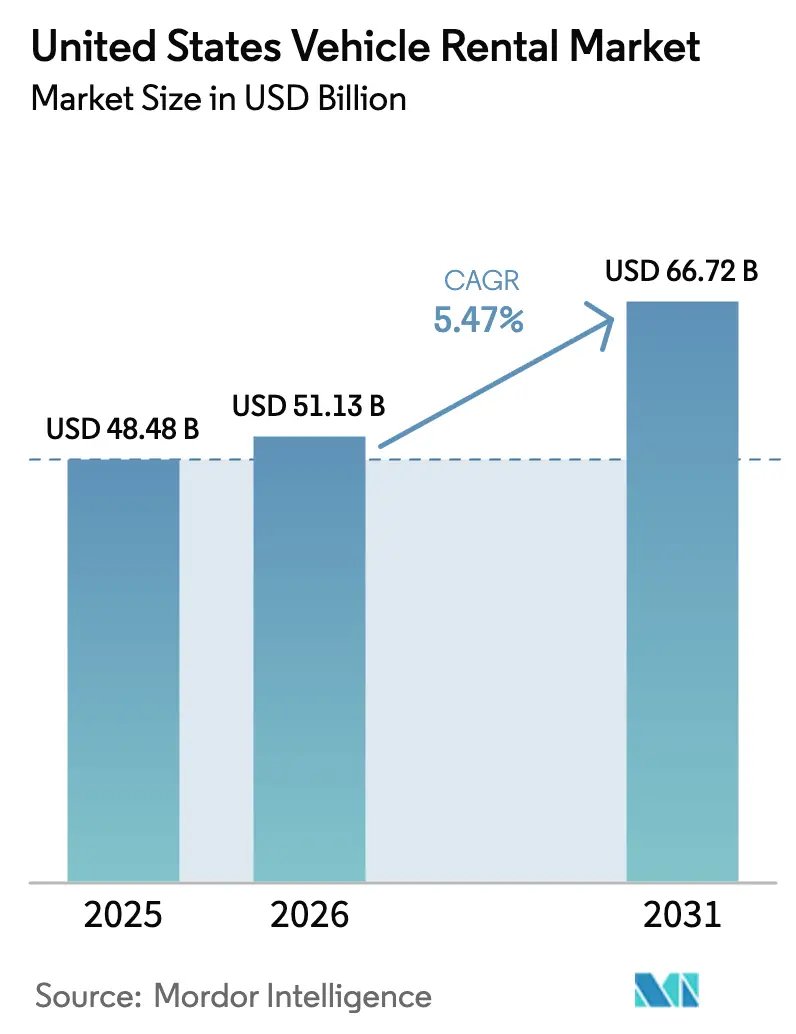
| Base Year Market Size (2025) | USD 48.48 Billion |
| Market Size (2026) | USD 51.13 Billion |
| Market Size (2031) | USD 66.72 Billion |
| Growth Rate (2026 - 2031) | 5.47% CAGR |
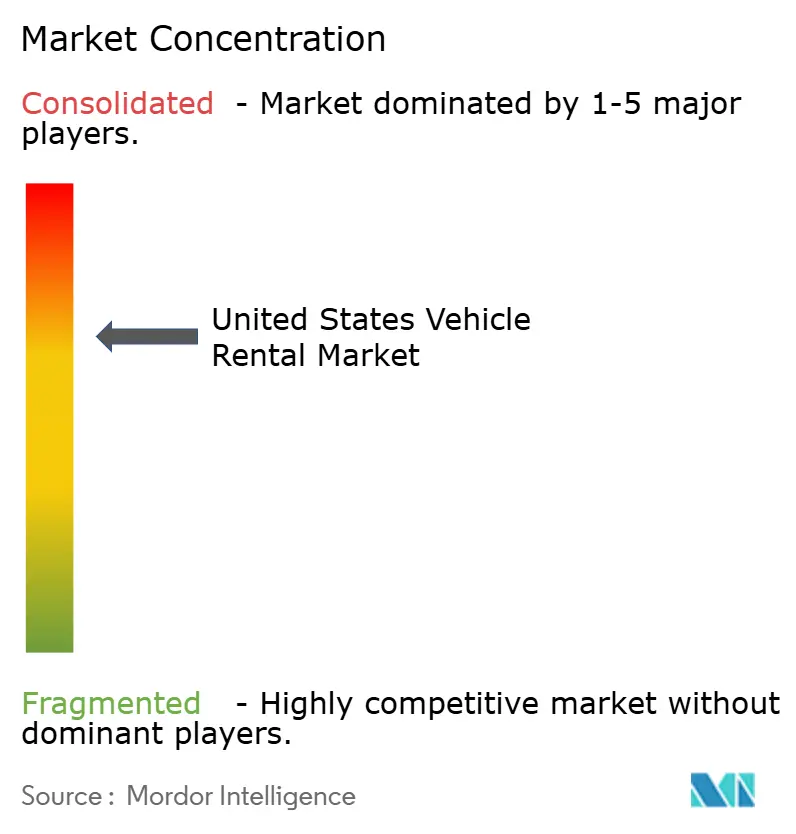
| Market Concentration | Medium |
Major Players *Disclaimer: Major Players sorted in no particular order Image © Mordor Intelligence. Reuse requires attribution under CC BY 4.0. | |
United States Vehicle Rental Market Analysis by Mordor Intelligence
The United States vehicle rental market size is expected to grow from USD 48.48 billion in 2025 to USD 51.13 billion in 2026 and is forecast to reach USD 66.72 billion by 2031 at a 5.47% CAGR over 2026–2031. Despite facing challenges like persistent vehicle shortages and rising airport fees, the U.S. car rental market is witnessing a revenue boost. Factors such as pent-up leisure demand, hybrid-work travel patterns, and a surge in digital bookings, coupled with OEM fleet incentives, are driving this uptick. Operators are turning to advanced strategies: dynamic pricing engines that frequently adjust rates, telematics significantly reducing downtime, and cross-regional fleet rebalancing, all aimed at maintaining high utilization rates. While electrification is a key focus—especially with California's Advanced Clean Cars II rule pushing for a substantial share of zero-emission sales in the near future—Hertz's significant EV write-down has instilled a cautious approach to procurement. Peer-to-peer platforms are expanding their reach, utilizing a large number of privately owned vehicles. However, potential tax parity bills in several states pose a risk, threatening to diminish their competitive price advantage. In this evolving landscape, the U.S. car rental industry is transitioning from a traditional asset-management approach to a more sophisticated, data-centric mobility services model.
Key Report Takeaways
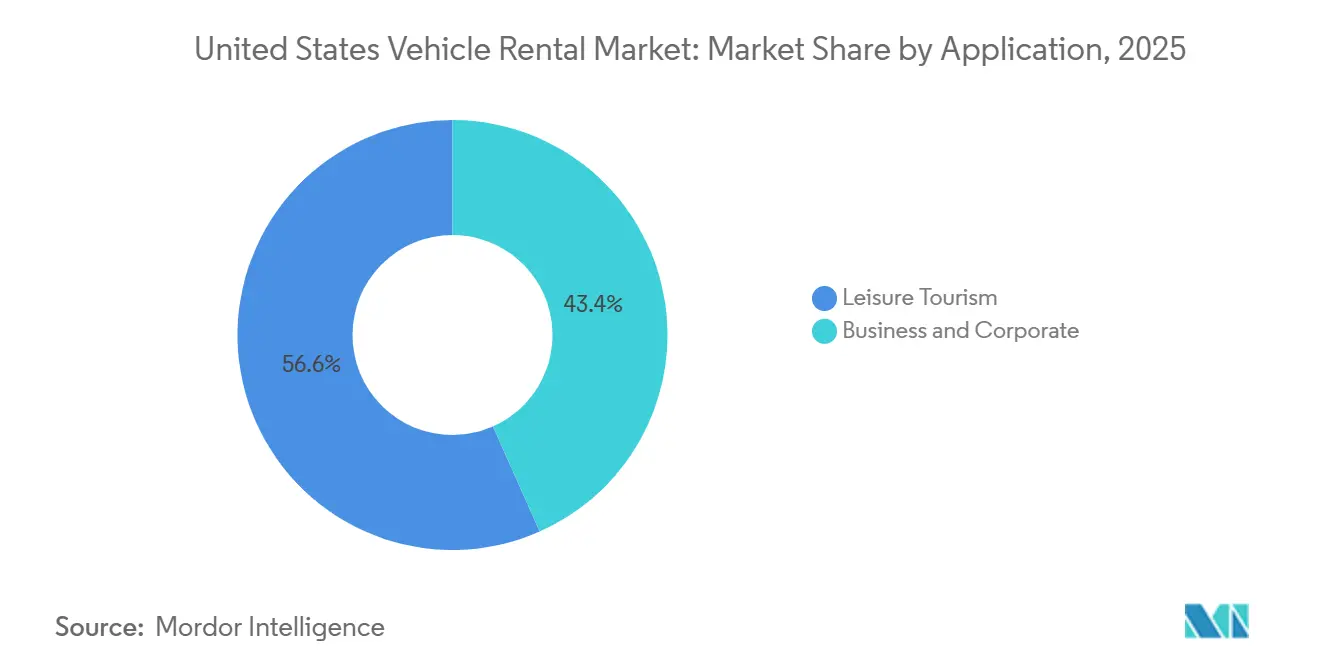
- By application, leisure and tourism captured 56.71% of the United States car rental market share in 2025, while business and corporate is projected to grow at a 5.49% CAGR through 2031.
- By vehicle type, passenger cars commanded 63.37% of the United States car rental market size in 2025 and are expanding at the segment-leading 5.57% CAGR to 2031.
- By booking channel, online reservations held a 71.35% share in 2025; this channel is expected to advance at a 5.59% CAGR through 2031.
- By rental duration, short-term rentals accounted for 67.73% revenue in 2025, whereas long-term rentals exhibited the fastest 5.51% CAGR over the forecast.
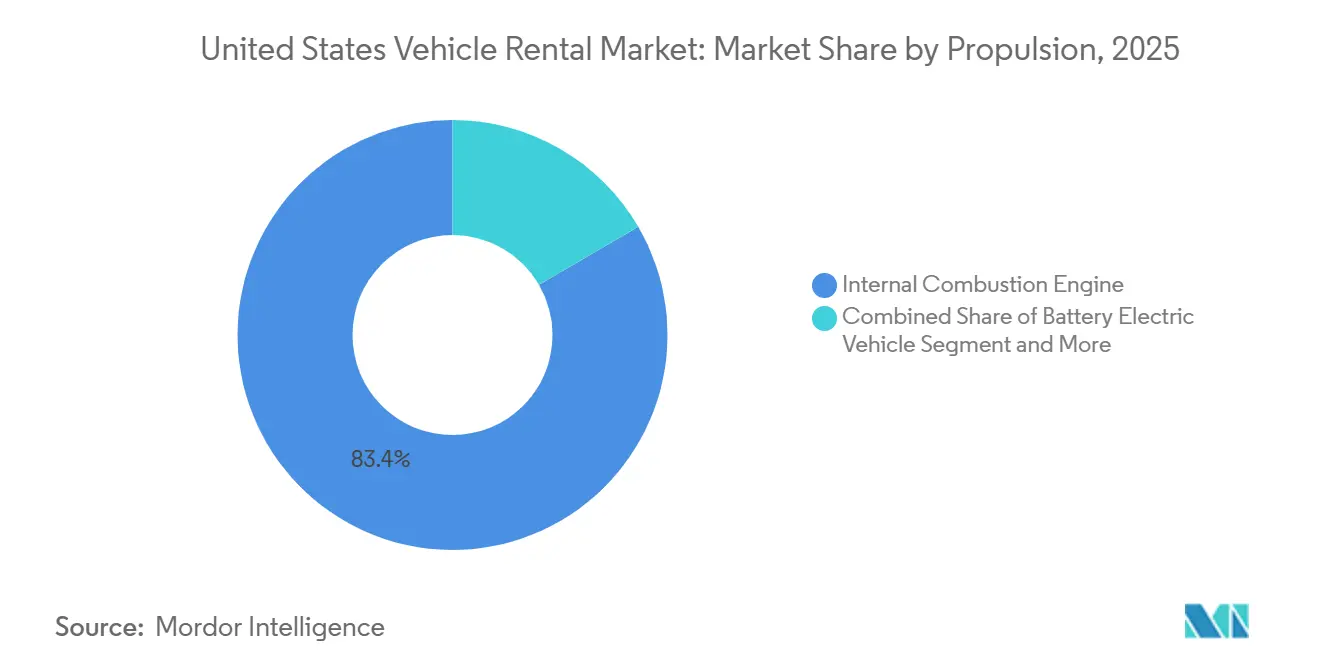
- By propulsion, internal-combustion vehicles retained 83.35% share in 2025, yet battery-electric vehicles are growing at the highest 5.62% CAGR.
- By service model, traditional corporate fleets controlled 89.91% share in 2025, while peer-to-peer platforms record a 5.54% CAGR through 2031.
Note: Market size and forecast figures in this report are generated using Mordor Intelligence’s proprietary estimation framework, updated with the latest available data and insights as of January 2026.
United States Vehicle Rental Market Trends and Insights
Drivers Impact Analysis*
| Driver | (~)% Impact on CAGR Forecast | Geographic Relevance | Impact Timeline |
|---|---|---|---|
| Surge in Domestic Road-Trip/Leisure Demand | +1.2% | National, with peaks in Florida, California, Texas | Short term (≤ 2 years) |
| Rapid Growth of Online & Mobile Booking Channels | +0.9% | National, concentrated in urban metros | Medium term (2-4 years) |
| Flexible Fleet-Leasing Demand | +0.8% | National, strongest in tech hubs (San Francisco, Austin) | Medium term (2-4 years) |
| OEM-Backed Electrification of Rental Fleets | +0.7% | California, Northeast states with ZEV mandates | Long term (≥ 4 years) |
| Peer-to-Peer Supply Expansion | +0.6% | Urban metros (NYC, LA, Chicago, Seattle) | Medium term (2-4 years) |
| Telematics-Driven OPEX Optimisation | +0.5% | National, early adopters in large fleet operators | Long term (≥ 4 years) |
| Source: Mordor Intelligence | |||
Surge in Domestic Road-Trip/Leisure Demand
In 2025, U.S. travelers, opting for national parks and coastal drives over international vacations, drove a notable increase in domestic person-trips compared to pre-pandemic levels [1]“Domestic Travel Volume Report 2025,” U.S. Travel Association, ustravel.org . While daily rental rates remained steady, a longer average rental duration significantly boosted revenue per transaction. With a substantial share of leisure rentals concentrated in key states like Florida, California, and Texas, operators strategically shifted their inventory towards sunbelt airports during peak quarters. The growing preference for SUVs and minivans, which typically generate higher revenue, enhanced fleet mix economics. However, this shift introduced seasonal volatility, particularly during the less busy quarters when utilization rates dropped. To navigate these challenges, companies have turned to dynamic pricing algorithms and real-time telematics for cross-regional transfers.
Rapid Growth of Online & Mobile Booking Channels
In 2025, digital bookings constituted a significant majority of transactions in the U.S. car rental market, showing a notable increase from the previous year. This growth can be attributed to mobile apps, like those of Enterprise Holdings, which have significantly reduced booking times and driven a considerable rise in ancillary revenue [2]“Fiscal 2024 Annual Review,” Enterprise Holdings, enterpriseholdings.com . Meanwhile, Hertz's strategic move to integrate rental options within the Uber app has successfully converted a notable portion of Uber's users for multi-day rentals, highlighting the increasingly blurred lines between ride-hailing and car rentals due to platform convergence. While digital channels have substantially lowered customer acquisition costs, incidents such as a ransomware attack that temporarily disrupted operations for a mid-tier operator in 2024 emphasize the critical need for robust ISO 27001-grade cybersecurity defenses.
OEM-Backed Electrification of Rental Fleets
In 2024, General Motors significantly reduced prices on Chevrolet Equinox EV and Blazer EV units for fleet buyers, aiming to encourage consumer trials. This move comes on the heels of Hertz's substantial impairment on EVs, attributed to swift depreciation [3]“EV Life-Cycle Cost Study 2025,” U.S. Department of Energy, energy.gov . Despite challenges, battery-electric vehicles are set to lead the market with strong growth. This growth is fueled by the total cost of ownership becoming advantageous once vehicles reach a high annual mileage. With California enforcing a rule for a significant percentage of zero-emission sales by 2026, national brands with a presence on the West Coast find electrification imperative. However, a significant hurdle remains: by the end of 2024, only a small portion of rental sites had the necessary high-capacity charging capability.
Peer-to-Peer Supply Expansion & Price Discovery
In recent times, Turo has demonstrated how asset-light platforms can scale effectively by offering prices significantly lower than airport counters. Meanwhile, Getaround's keyless entry feature is enabling supply to expand into residential areas, meeting the needs of Airbnb patrons. However, proposed legislation in several states aiming to impose airport facility charges and sales taxes could significantly reduce P2P's pricing advantage. Additionally, increasing commercial insurance premiums are creating challenges for host economics.
Restraints Impact Analysis*
| Restraint | (~)% Impact on CAGR Forecast | Geographic Relevance | Impact Timeline |
|---|---|---|---|
| Persistent New-Vehicle Supply Constraints | -0.8% | National, acute in EV-heavy California fleets | Medium term (2-4 years) |
| Modal Substitution by Ride-Hailing | -0.7% | Urban metros with dense transit (NYC, SF, Boston, DC) | Medium term (2-4 years) |
| Residual-Value Risk from Low-Priced Chinese EV Imports | -0.6% | National, concentrated in West Coast ports | Long term (≥ 4 years) |
| Escalating Airport Concession & Local Taxation Costs | -0.5% | Major hubs (LAX, JFK, ORD, ATL, DFW) | Short term (≤ 2 years) |
| Source: Mordor Intelligence | |||
Persistent New-Vehicle Supply Constraints & High CAPEX
In 2025, U.S. light-vehicle production experienced a notable decline compared to pre-pandemic levels. As a result, OEMs prioritized retail channels, achieving significantly higher transaction prices compared to the discounts offered in fleet sales. Hertz reported a considerable increase in average acquisition costs, with the fleet's average age extending, leading to a noticeable rise in monthly maintenance expenses per vehicle. Meanwhile, Avis Budget's bond issuance in May 2025, set at a high-interest rate, highlights the intensified capital demands for fleet renewals amid rising interest rates.
Modal Substitution by Ride-Hailing & Subscription MaaS
In 2024, Uber and Lyft collectively facilitated billions of trips across the U.S. As bundled mobility subscriptions gained traction, they began siphoning demand away from short-term urban rentals. With ride-hailing services frequently offering a more economical option than the combined cost of a short car rental and parking, their popularity continues to grow. A significant portion of U.S. business travelers now rely on corporate travel platforms that seamlessly integrate trains, rideshares, and rentals. This shift pressures rental companies to either navigate the lower-margin aggregator landscape or face the threat of disintermediation.
*Our forecasts treat driver/restraint impacts as directional, not additive. The impact forecasts reflect baseline growth, mix effects, and variable interactions.
Segment Analysis
By Application: Dual-Track Growth Across Leisure and Corporate Needs
Leisure and tourism captured 56.71% of the United States car rental market in 2025 as remote work let families extend vacations, pushing summer utilization above four-fifths in Florida and California. Business and corporate clients, though smaller, will outpace leisure at a 5.49% CAGR because firms are substituting ownership with flexible rentals that trim fixed fleet costs by one-fourth. Such a strategy not only streamlines expenses but also smooths out seasonal fluctuations: leisure rentals peak during the summer months, while corporate demand bolsters occupancy during the beginning and end of the year. Premium SUVs and convertibles command higher rental rates, pushing the average daily revenue upward compared to the previous year.
Avis Budget witnessed a significant surge in corporate subscriptions, especially from tech giants in Austin and San Francisco. These firms are consolidating their hybrid workforce, leading to fewer but extended client engagements. Another resilient segment, insurance replacements, saw steady growth. This growth comes as vehicle repair timelines are extended, prompting operators to allocate lower-cost fleets, ensuring margins on fixed-rate contracts. The landscape of EV adoption reveals a stark divide: leisure renters exhibit a much greater inclination to trial EVs for shorter trips. In contrast, corporate clients prefer traditional ICE vehicles, prioritizing the need for swift refueling.


By Vehicle Type: Passenger Cars Anchor Revenue, Commercial Units Diversify
Passenger cars held 63.37% of the United States car rental market size in 2025 and will expand at the leading 5.57% CAGR because sedans and compact SUVs balance fuel economy, acquisition cost, and airport space fees. Light commercial vehicles are growing at a minimal rate annually as e-commerce firms rent vans and pickups for flexible last-mile capacity without large capital outlays. Enterprise added 18,000 Ford F-150s in 2024 to meet contractor demand, realizing slightly higher revenue per vehicle but accepting faster depreciation.
Regional preferences diverge: compact sedans dominate in California and the Northeast, where fuel costs and parking constraints are acute, while pickups and full-size SUVs lead in Texas and Florida, where trip distances and family travel justify size premiums. Commercial electrification lags; only 3% of rented vans were EVs in 2024, but Ford E-Transit pilots in dense urban routes signal incremental change.
By Booking Channel: Digital Platforms Set the Pace
Online channels controlled 71.35% of bookings in 2025 and will rise at a 5.59% CAGR, propelled by AI-driven dynamic pricing and sub-90-second mobile workflows. Hertz’s Uber integration turned ride-hail users into multi-day rental clients and showcases cross-platform convergence that future-proofs distribution. Offline booking remains essential for negotiated corporate rates and insurance replacement, but is losing three to four share points per year.
AI-driven prompts have significantly boosted ancillary revenue per rental compared to the previous year. However, ransomware-induced outages highlight substantial operational risks, with downtime causing severe financial losses for operators. In response, companies are increasingly adopting multi-cloud architectures and ISO 27001 standards to ensure uptime and mitigate risks.
By Rental Duration: Balancing Volume and Margin
Short-term rentals generated 67.73% of 2025 revenue due to leisure trips averaging four days, yet long-term rentals will climb at the fastest 5.51% CAGR as corporates embrace month-plus leases that sidestep residual-value risk. Long-term contracts deliver a little higher margins because turnover costs drop to USD 18 per vehicle, but they tie up inventory during peak leisure months, forcing careful fleet segmentation.
In high-demand windows, dynamic pricing can significantly boost short-term yields. Meanwhile, peer-to-peer platforms are sidestepping airport fees, allowing them to capture a larger share of the urban short-stay market. Adding to the complexity, rideshare drivers are renting vehicles for extended periods, which helps increase long-term volumes. However, the segment's volatility is evident from the recent revenue decline reported by HyreCar.
By Propulsion: ICE Prevalence with EV Acceleration
Internal combustion engines held 83.35% share in 2025, reflecting refueling convenience on long trips, yet battery-electric vehicles will post a 5.62% CAGR through 2031 as total cost of ownership tips in their favor over 30,000 annual miles. Hertz’s impairment demonstrates residual-value risk, prompting shorter EV hold periods and manufacturer buyback clauses. Hybrid-electric vehicles appeal to corporate fleets seeking lower fuel burn without charging needs.
Infrastructure gaps persist: only a minimal number of rental sites boast 150 kW DC chargers, so EV deployment clusters in California, Washington, and New York, where public charging density is higher. Federal tax credits flow to retail buyers, not fleets, creating a cost gap partly offset by certain state incentives for commercial users.

By Service Model: Incumbents Defend While P2P Scales
Traditional corporate fleets controlled 89.91% of the United States car rental market in 2025, leveraging established airport footprints and brand loyalty. Peer-to-peer platforms are expanding at a 5.54% CAGR by mobilizing private vehicles that avoid the USD 25,000-35,000 capital hit. Turo, boasting significant revenue, showcases its scale, yet the proposed tax parity threatens to diminish its cost edge.
In response, traditional firms are broadening their horizons: Enterprise recently expanded its neighborhood locations and is now offering P2P-style keyless delivery services. However, hosts grapple with soaring insurance costs, as commercial premiums are substantially higher compared to personal rates. The landscape shifted recently when multiple carriers exited the segment, compelling platforms to turn to self-insurance.
Geography Analysis
In 2025, California, Florida, and Texas generated a significant portion of total revenue, driven by robust tourism, a sizable population, and a high density of airports. California is at the forefront of electrification, with electric vehicles (EVs) making up a notable share of its rental fleets, surpassing the national average. This surge is largely attributed to stringent Zero Emission Vehicle (ZEV) mandates and the public's growing affinity for brands like Tesla. Florida stands as the leader in leisure demand; Orlando and Miami together account for a substantial number of rental transactions. Meanwhile, Texas, bolstered by corporate travel in the energy and tech sectors, has seen a notable increase in long-term rentals at both Houston and Dallas airports.
The Northeast grapples with modal substitution challenges, due to its dense transit networks. For instance, even as tourism rebounded, New York City witnessed a decline in rental volume, as many travelers opted for ride-hailing services for shorter trips. In the Midwest, states like Illinois and Ohio demonstrate resilience, particularly through insurance replacements. Notably, a significant portion of Enterprise’s fleet in the Midwest is allocated for claims, with an average rental duration of over two weeks. Meanwhile, Mountain West states—namely Colorado, Utah, and Arizona—experienced a notable surge in demand, driven by outdoor recreation and a tech migration to Phoenix.
Peer-to-peer rental platforms have found a stronghold in major metropolitan areas like New York City, Los Angeles, Chicago, and Seattle, collectively securing a notable market share by sidestepping airport surcharges. However, a significant portion of rural counties remain underserved, lacking a rental outlet within a reasonable distance. This gap presents a lucrative opportunity for delivery-first models, such as Kyte. Climate events are also influencing rental demand: while hurricanes in Florida and Texas led to a noticeable spike in insurance rentals in the latter half of 2024, wildfires in California dampened tourism but saw a rise in rentals for long-term evacuees. Furthermore, state mandates in California, New York, and Massachusetts are set to elevate regional fleet electrification to a significantly higher level by 2027, a notable jump from the current national average.
Competitive Landscape
Enterprise Holdings, Hertz Global Holdings, and Avis Budget Group dominate airport transactions, controlling a significant portion of the market. In contrast, the off-airport and peer-to-peer segments are scattered among numerous operators. Leading the pack, Enterprise generates substantial revenue and operates an extensive network of locations under its National and Alamo brands. Both Hertz and Avis grapple with elevated borrowing costs—evident from Avis’ high-interest notes—and fluctuations in residual values linked to electric vehicles (EVs). Meanwhile, Sixt SE has expanded its presence across the U.S., featuring a premium European fleet, and holds a notable market share in major gateway cities.
Investments in technology are carving out competitive advantages. For instance, Enterprise's implementation of Geotab technology significantly boosted vehicle utilization and reduced downtime. On another front, Hertz's collaboration with Carvana allows for direct-to-consumer de-fleeting, enabling Hertz to capture retail margins and lessen dependence on auctions. Turo and Getaround, operating without physical inventory, are scaling up but are contending with regulatory efforts to standardize taxes. Their future hinges on how adeptly they manage rising insurance costs.
Brands like Fox and Advantage are strategically targeting secondary airports, opting for lower fees in exchange for diminished occupancy rates. In a nod to the industry's future, Hertz's provision of a large fleet of Teslas for Uber's autonomous trial underscores a significant bet on the robotaxi evolution.
United States Vehicle Rental Industry Leaders
Enterprise Holdings Inc.
Hertz Global Holdings Inc.
Avis Budget Group Inc.
Sixt SE
Fox Rent A Car
- *Disclaimer: Major Players sorted in no particular order

Recent Industry Developments
- November 2025: Tesla launched a USD 60-a-day rental program that bundles free Supercharging and supervised Full Self-Driving for up to seven days per booking.
- October 2025: Turo introduced a low-commitment monthly booking option, letting users extend or shorten reservations without penalties.
- October 2024: Ryder opened a full-service truck rental and maintenance hub near Nashville, expanding coverage in a key Southeast logistics corridor.
- September 2025: Premier Truck Rental refreshed its mission and customer promise, signaling a push toward service differentiation.


Research Methodology Framework and Report Scope
Market Definitions and Key Coverage
Our study treats the United States vehicle rental market as all paid, short- and long-term passenger-vehicle hire transactions in which the asset is returned to the owner at contract end. This covers traditional corporate fleets as well as app-based peer-to-peer hosts and includes economy cars, premium cars, SUVs, crossovers, and battery-electric models. Revenues are expressed in USD, calendar year, at operator level.
Scope exclusion: recreational vehicles, heavy trucks, chauffeur-driven limousine services, and pure operating-lease contracts are not counted.
Segmentation Overview
- By Application
- Leisure and Tourism
- Business and Corporate
- By Vehicle Type
- Passenger Cars
- Light Commercial Vehicles
- Medium and Heavy-duty Commercial Vehicles
- By Booking Channel
- Online
- Offline
- By Rental Duration
- Short-Term
- Long-Term
- By Propulsion
- ICE Vehicles
- Battery-Electric Vehicles
- Hybrid-Electric Vehicles
- By Service Model
- Traditional Corporate Fleets
- Peer-to-Peer Platforms
Detailed Research Methodology and Data Validation
Primary Research
Mordor analysts interviewed fleet managers in the South and West, online aggregator executives in New York, franchise owners in Florida, and insurance-replacement desk supervisors across the Midwest. Structured calls and short surveys clarified fleet utilization, average daily rate trends, EV adoption hurdles, and subscription uptake, letting us refine model inputs found during secondary research.
Desk Research
We began with publicly available fundamentals from agencies such as the U.S. Bureau of Transportation Statistics, Federal Highway Administration traffic counts, Monthly U.S. International Air Arrivals, and U.S. Travel Association expenditure dashboards. Industry context was sharpened through trade data from U.S. Customs, fleet age statistics from the American Car Rental Association, patent searches on vehicle-sharing platforms via Questel, and company 10-Ks and investor decks. Subscription databases (D&B Hoovers for fleet operator revenue splits and Dow Jones Factiva for deal flow) supplied additional granularity.
Press releases, airport concession fee filings, and state motor-vehicle registration records helped validate segment mix, while Bestsellingcarsblog's monthly model sales supported new-car supply assumptions. These sources are illustrative; several other documents, datasets, and news wires were consulted to cross-check facts and fill gaps.
Market-Sizing & Forecasting
We anchor 2024 demand using a top-down build that reconciles airport passenger flows, hotel occupancy, domestic VMT, and peer-to-peer car-share penetration. Those totals are then sense-checked through bottom-up roll-ups of sampled operator revenue and average selling price multiplied by rental-days. Key drivers include inbound leisure arrivals, corporate travel budgets, used-vehicle prices, average fleet age, and state EV-charging density. A multivariate regression with ARIMA overlays projects each driver to 2030, and scenario analysis adjusts for supply-chain volatility. Gaps in bottom-up estimates are smoothed by region-specific utilization factors drawn from primary interviews.
Data Validation & Update Cycle
Before sign-off, our two-step review flags anomalies, compares outputs with Auto Rental News revenue indices, and reruns variance checks. We refresh every 12 months, triggering interim reviews if fleet acquisition costs swing by more than 10 percent or if major regulatory shifts occur.
Why Mordor's US Car Rental Baseline Earns Investor Trust
Published market values often diverge because each firm defines scope, rate escalation, and refresh cadence differently.
Key gap drivers include optional inclusion of long-term leasing, treatment of peer-to-peer hosts, and whether neighborhood outlets sit inside or outside the study universe.
Currency year alignment and daily-rate escalation formulas further widen spreads. Mordor's base year, wide source mix, and annual refresh narrow these gaps and give decision-makers a steadier anchor.
Benchmark comparison
| Market Size | Anonymized source | Primary gap driver |
|---|---|---|
| USD 38.90 B (2025) | Mordor Intelligence | - |
| USD 37.88 B (2024) | Regional Consultancy A | Excludes peer-to-peer platforms; fleet purchase disclosures only |
| USD 53.41 B (2024) | Global Consultancy B | Adds long-term leasing and vans; uniform rate escalation |
| USD 20.70 B (2024) | Trade Journal C | Counts airport concessions only; omits neighborhood and subscription rentals |
These comparisons show that, by selecting clear boundaries and mixing macro indicators with on-ground validation, Mordor delivers a balanced, reproducible baseline that policymakers and investors can rely on.


Key Questions Answered in the Report
How large is the United States car rental market in 2026?
The United States car rental market size is estimated at USD 51.13 billion in 2026 and is expected to reach USD 66.72 billion by 2031.
Which vehicle category holds the biggest share of rented fleets?
Passenger cars account for 63.37% of fleet mix and lead forecast growth with a 5.57% CAGR to 2031.
What drives the shift toward long-term car rentals?
Hybrid-work schedules and subscription-style corporate contracts are raising demand for 30-plus-day rentals, which show a 5.51% CAGR.
How fast are electric vehicles expected to grow in rental fleets?
Battery-electric vehicles represent the fastest propulsion segment, expanding at a 5.62% CAGR through 2031 despite infrastructure gaps.
Which booking channel is expanding the quickest?
Online and mobile reservations dominate with 71.35% share and are forecast to grow at 5.59% CAGR as digital interfaces reduce friction.
What competitive risks do peer-to-peer platforms face?
Proposed state legislation to impose airport fees and rising insurance premiums could erode up to 40% of P2P platforms’ price advantage.
Page last updated on:


