Market Overview
| Study Period | 2019 - 2031 |
|---|---|
| Forecast Data Period | 2026 - 2031 |
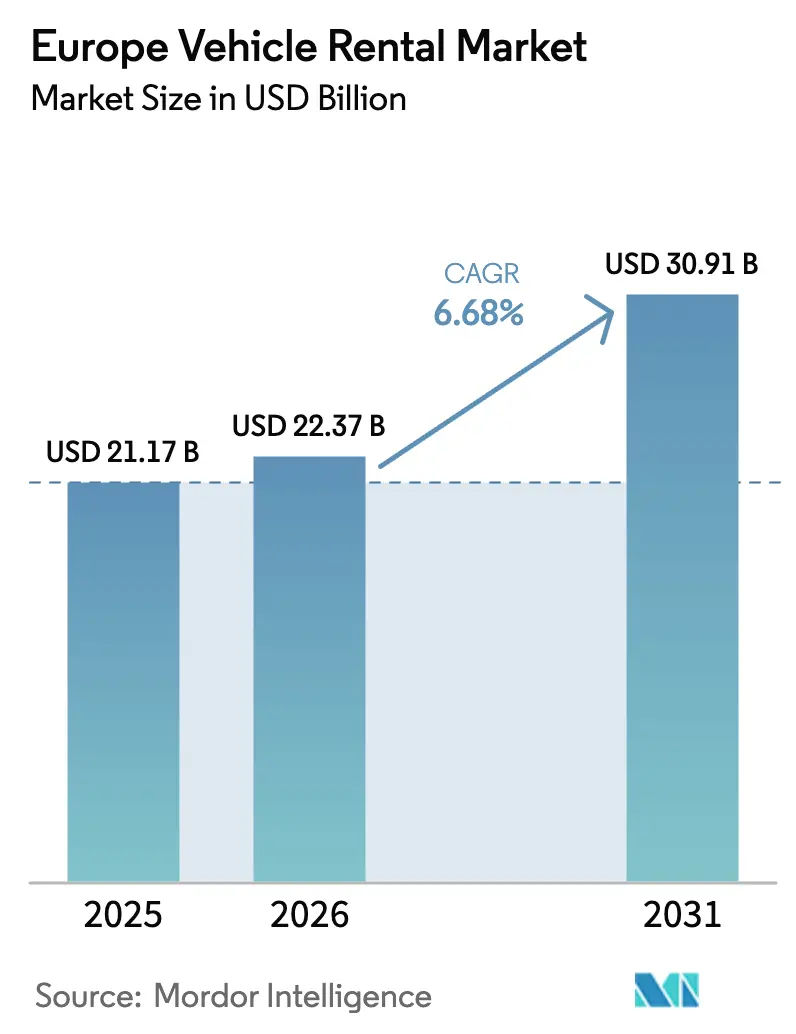
| Base Year Market Size (2025) | USD 21.17 Billion |
| Market Size (2026) | USD 22.37 Billion |
| Market Size (2031) | USD 30.91 Billion |
| Growth Rate (2026 - 2031) | 6.68% CAGR |
| Market Concentration | Medium |
Major Players
*Disclaimer: Major Players sorted in no particular order Image © Mordor Intelligence. Reuse requires attribution under CC BY 4.0. |
|
Europe Vehicle Rental Market Analysis by Mordor Intelligence
The European vehicle rental market size is projected to expand from USD 21.17 billion in 2025 and USD 22.37 billion in 2026 to USD 30.91 billion by 2031, registering a CAGR of 6.68% between 2026 and 2031. Rising inbound leisure traffic, accelerated fleet electrification, and the rapid pivot to app-based bookings are shifting the market from pure-volume competition to margin-focused services. Operators are allocating fresh capital to battery-electric vehicles and subscription programs that command higher daily yields, while dynamic-pricing engines help defend margins amid the transparency of aggregators. Digital channels already account for nearly two-thirds of revenue, and the widening cost gap with staffed counters is forcing incumbents to reconfigure branch footprints. Simultaneously, residual-value volatility and heavier compliance burdens are pushing many mid-tier firms toward partnerships or outright sale to larger balance-sheet players.
Key Report Takeaways
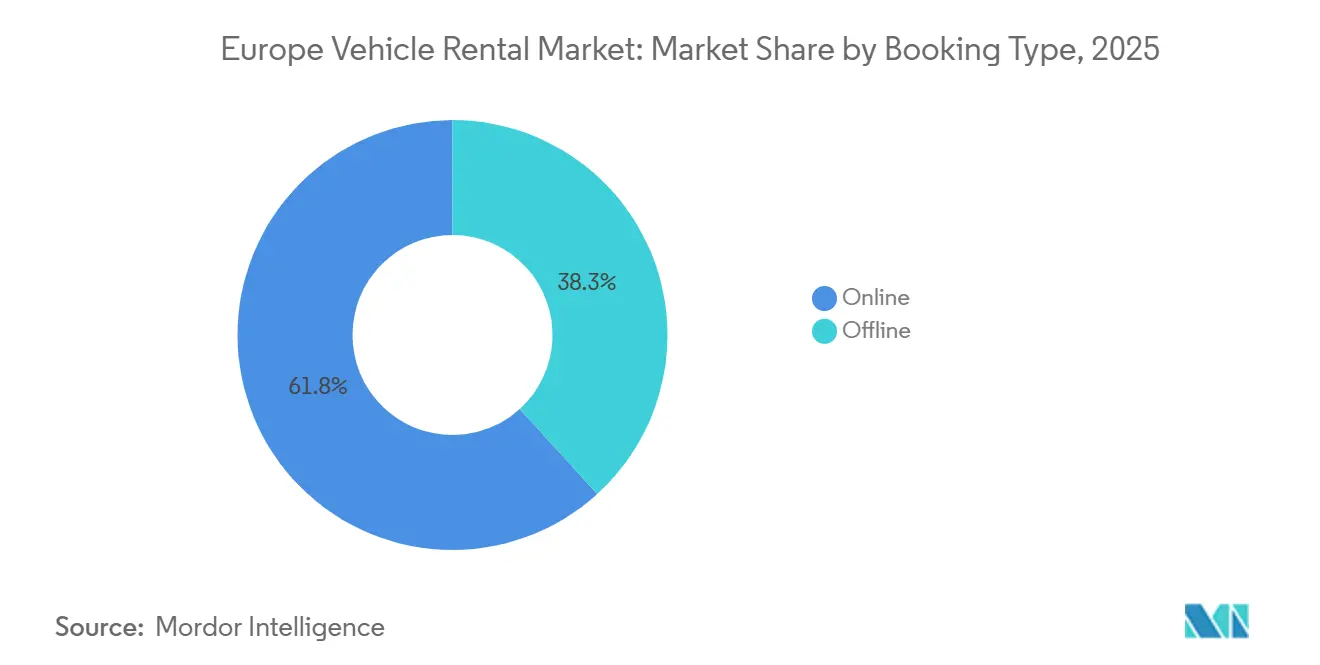
- By booking type, online channels led with a 61.75% revenue share in 2025, while online channels are forecast to expand at only a 10.23% CAGR to 2031.
- By rental channel, off-airport hubs accounted for 55.68% of bookings in 2025; on-airport counters are projected to grow at a slower 5.2% CAGR through 2031.
- By rental duration, short-term contracts accounted for 78.96% of the 2025 market size, while long-term subscriptions are the fastest-growing segment at an 8.47% CAGR through 2031.
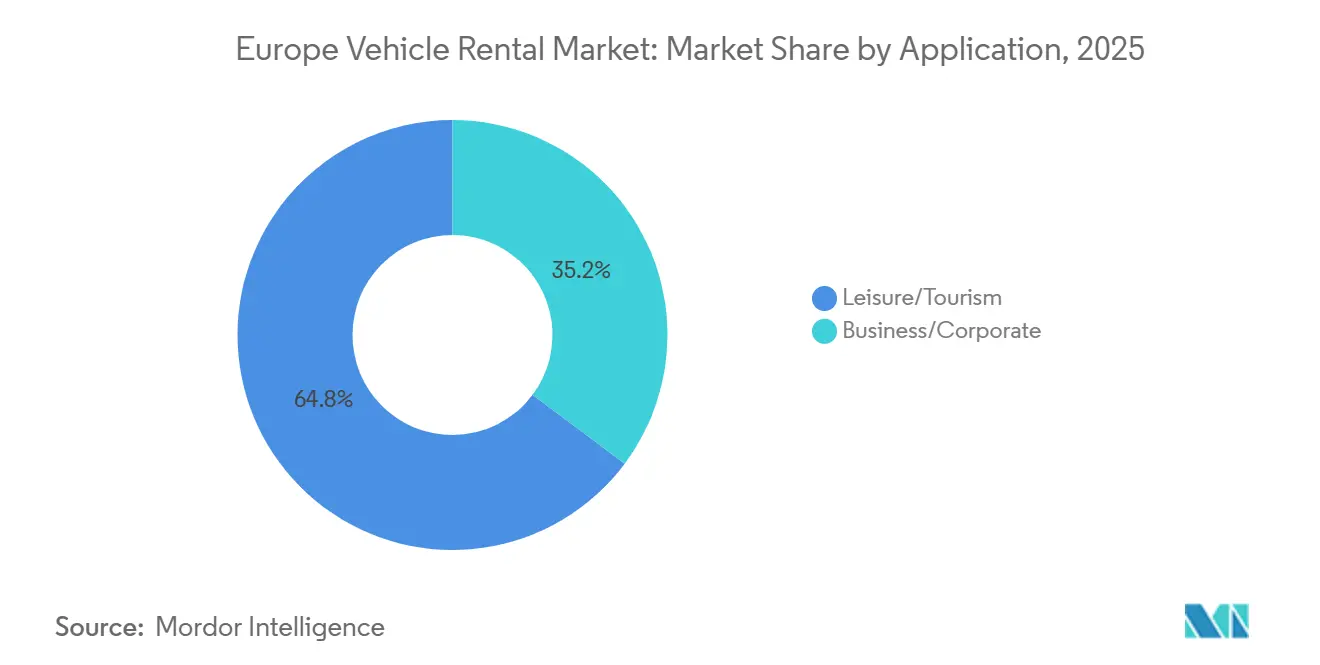
- By application, leisure rentals captured 64.79% of 2025 revenue, whereas business rentals are expected to grow at a modest 4.2% CAGR over the forecast period.
- By vehicle type, passenger cars secured the top position with 46.57% market share in 2025; light commercial vehicles are poised for a 5.3% CAGR through 2031.
- By powertrain, ICE models still dominate with an 83.01% share in 2025, but BEVs will post the highest 14.77% CAGR through 2031.
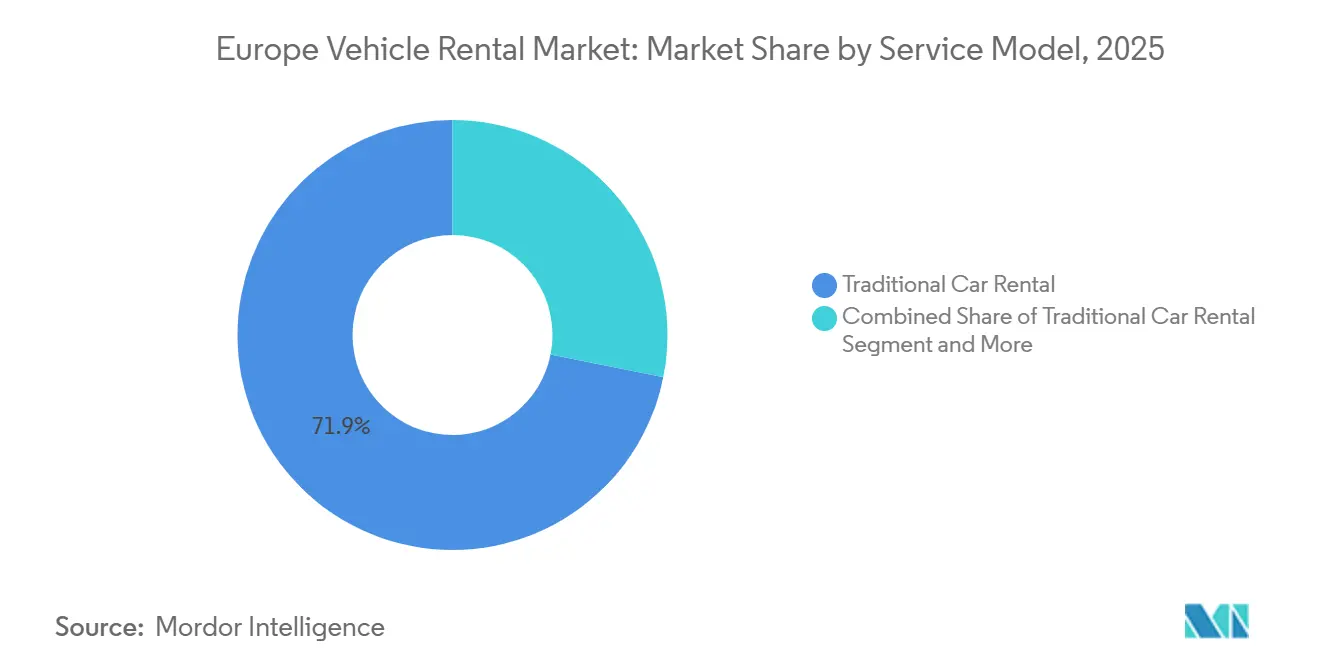
- By service model, traditional daily rental accounted for 71.87% of 2025 revenue, while subscription offerings will grow at a 7.87% CAGR and reach 20% share by 2031.
- By end user, self-driven rentals accounted for 84.02% of the 2025 market size, whereas corporate fleet outsourcing is set to accelerate at a 7.2% CAGR through 2031.
- By country, Germany accounts for 18.22% of the market in 2025, while Spain is projected to lead growth at a 9.02% CAGR during 2026-2031.
Note: Market size and forecast figures in this report are generated using Mordor Intelligence’s proprietary estimation framework, updated with the latest available data and insights as of January 2026.
Market Trends and Insights
Drivers Impact Analysis of Europe Vehicle Rental Market*
| Driver | (~)% Impact on CAGR Forecast | Geographic Relevance | Impact Timeline |
|---|---|---|---|
| EU Fit-for-55 Mandates | +1.6% | EU-wide, strongest in Germany, France, Netherlands, Nordics | Long term (≥ 4 years) |
| Mediterranean Tourism Rebound | +1.4% | Spain, Italy, France (Côte d'Azur), Greece | Medium term (2-4 years) |
| Surge in Digital-Native Travellers | +1.2% | EU-wide, led by UK, Germany, Netherlands | Short term (≤ 2 years) |
| Rise of Subscription-Based Service Models | +0.8% | Germany (Berlin, Munich), France (Paris), Netherlands (Amsterdam) | Medium term (2-4 years) |
| EV Charging Infrastructure Expansion | +0.6% | Nordics, Netherlands, Germany, France | Long term (≥ 4 years) |
| Corporate Sustainability Programs | +0.4% | UK, Germany, France, Netherlands, Nordics | Medium term (2-4 years) |
| Source: Mordor Intelligence | |||
EU Fit-for-55 Mandates Accelerating Fleet Electrification Among Rental Operators
The EU’s European Climate Law sets a legally binding target to reduce net greenhouse-gas emissions by at least 55% by 2030 versus 1990; the Fit for 55 package implements measures (including transport-related rules) to meet that target.[1]"Fit for 55", European Council, consilium.europa.eu. Leading firms have placed multi-year orders for high-volume BEV and plug-in hybrid models, confident that price parity with ICE vehicles will widen customer acceptance. To support these assets, operators are installing high-power depot chargers that shorten turnaround times and preserve utilization. Early adopters are locking in OEM discounts and preferential allocation, creating a widening cost differential versus fast followers who face longer lead times and thinner rebates. Nonetheless, the higher ticket price of BEVs strains balance sheets, prompting joint-venture charging investments and green-bond issuances to fund fleet upgrades.
Mediterranean Tourism Rebound Inflating Leisure-Rental Volumes
In October 2025, Spain welcomed 9.2 million international tourists, marking a 3.2% increase from October 2024[2]"Spain Tourist Arrivals", Trading Economics, tradingeconomics.com. Similar momentum in Italy and France is swelling leisure-rental demand, especially in coastal regions that rely on self-drive mobility. Operators are relocating fleet assets southward to capture peak-season utilization and are extending vehicle holding periods in summer to avoid repositioning costs. The rebound also inflates ancillary revenue from GPS, child-seat, and insurance add-ons, offsetting seasonal price competition. However, sharp winter slowdowns force dynamic pricing and cross-border reallocation to Central Europe to maintain acceptable load factors.
Surge in Digital-Native Travellers Boosting Online Bookings Across Western Europe
Mobile-first millennial and Gen Z travellers value keyless pickup, real-time fleet visibility, and loyalty that integrates with airline miles in the Europe Vehicle Rental Market. As a result, digital channels garnered a significant share of 2025 revenue and are compounding at double-digit rates. The cost advantage is material: self-service bookings reduce per-transaction labor by roughly one-quarter, enabling budget reallocation to technology rather than counter staff. App interfaces now display battery state-of-charge for BEV reservations, alleviating range anxiety and encouraging upsell to premium trims. Yet instant price comparisons on metasearch sites compress yields for operators lacking exclusive loyalty tiers or bundled services. Competitive pressure is leading incumbents to refine revenue-management algorithms that consider real-time demand elasticity and rival rate moves.
Rise of Subscription-Based Car-as-a-Service Models in Urban Centers
Month-to-month subscriptions in the Europe Vehicle Rental Market offer insurance, service, and roadside assistance in a single invoice, enticing professionals who prioritize flexibility over ownership. Urban clients accept a 15%-20% premium versus traditional rentals in exchange for vehicle swaps and minimal paperwork. Subscriptions also yield steadier cash flows because customer turnover is lower than for tourist rentals. Nevertheless, inventory remains tied up for longer periods, elevating capital intensity and residual-value risk. Operators mitigate this by employing telematics-driven usage analytics to forecast swap cycles and pre-position suitable replacements in high-turnover zones.
Restraints Impact Analysis of Europe Vehicle Rental Market*
| Restraint | (~)% Impact on CAGR Forecast | Geographic Relevance | Impact Timeline |
|---|---|---|---|
| Volatile ICE Residual Values | -0.7% | EU-wide, acute in Germany, UK, Netherlands | Short term (≤ 2 years) |
| High EV Acquisition Costs | -0.5% | EU-wide, most severe in Southern Europe (Spain, Italy) | Medium term (2-4 years) |
| Consumer-Protection and Pricing-Transparency Rules | -0.3% | EU-wide, particularly France, Germany | Short term (≤ 2 years) |
| Urban Car-Sharing and Ride-Hailing Growth | -0.2% | Germany, France, Netherlands, UK (London, Manchester) | Medium term (2-4 years) |
| Source: Mordor Intelligence | |||
Volatile ICE Residual Values Amid Rapid EV Uptake Denting Fleet ROI
Accelerating BEV adoption is eroding resale demand for petrol and diesel models, depressing auction prices, and extending disposal lead times. An ICE compact that historically commanded over 50% residual value after a year now clears at a rate of nearly 45-48% in major auctions, forcing rental firms to raise depreciation charges. Meanwhile, the still-nascent used-BEV market suffers illiquidity due to battery-degradation concerns, delaying payback even for electrified assets. This twin squeeze compels operators to lengthen holding periods to ride out value troughs, but longer cycles lower average fleet age and heighten maintenance outlays. Financial pressure is already evident in tighter covenant ratios and higher funding spreads for mid-tier lessors.
High EV Acquisition Costs and Charging Infrastructure Investments Straining Capital Allocation
BEVs carry a 20%–30% price premium over equivalent ICE models and require parallel outlays for depot charging hardware, cables, and grid upgrades. Operators with sub-scale balance sheets often face double-digit leasing rates for BEV tranches, raising break-even utilization thresholds. Public fast-charging tariffs remain significantly higher than commercial diesel rates on a per-kilometer basis, squeezing margins if usage-based recovery is mispriced. Capital intensity is pushing second-tier firms to explore asset-light franchise models or seek strategic alliances with energy providers in exchange for long-term charging contracts. In Southern Europe, where public chargers remain sparse, operators risk customer attrition if charge-point outages lengthen rental return delays.
*Our forecasts treat driver/restraint impacts as directional, not additive. The impact forecasts reflect baseline growth, mix effects, and variable interactions.
Europe Vehicle Rental Market Segment Analysis
By Booking Type:
Digital Channels Redefining DistributionOnline bookings delivered 61.75% of 2025 revenue, reflecting the Europe vehicle rental market share advantages of platforms that reduce check-in friction and integrate loyalty rewards. The European vehicle rental market size attributed to online channels is set to climb at a 10.23% CAGR by 2031. Price-comparison sites provide customers with transparency, keeping operators honest while encouraging ancillary bundling to maintain yields. Mobile apps now display real-time charger status for BEV reservations, easing range concerns and raising attachment rates for premium battery categories.
The offline channel still retains nearly 38% of market share and caters to corporate clients that prefer centralized account management and consolidated invoicing. Counter agents who upsell full-damage waiver and extended-roadside cover more effectively, through face-to-face support, achieve higher ancillary revenue per booking. Yet rising labor costs and airport concession fees erode the profitability of walk-in transactions, spurring branch automation investments. Hybrid models, such as self-service kiosks at major airports, blur the lines between channels by allowing online vouchers to be converted into physical keys without requiring staff interaction. As these kiosks roll out, offline share will slide while maintaining a strategic role for complex B2B billing needs.


By Rental Channel:
Off-Airport Hubs Win Urban Wallet ShareOff-airport locations accounted for 55.68% of the 2025 market, buoyed by suburban and downtown branches that plug into subscription programs. Growth is projected at an 8.15% CAGR by 2031, solidifying the off-airport Europe vehicle rental market's leadership share. Convenience and lower facility rent permit operators to offer attractive weekend packages to locals seeking short leisure trips. Proximity to mass transit nodes also drives one-way rentals, which command higher day rates than round-trip bookings.
On-airport counters still dominate sun-destination leisure itineraries, capturing bookings immediately after arrivals. However, high concession fees increase the cost per booking, prompting operators to drive volume to city branches through loyalty discounts. Consolidated rental centers, complete with multi-brand bays and shared EV chargers, intensify rate competition as customers cross-shop within the same facility. The European vehicle rental market, represented by on-airport segments, will nonetheless continue to expand as inbound tourism grows.
By Rental Duration:
Subscription Upswing Alters Asset CyclesShort-term rentals accounted for 78.96% of the 2025 market size, anchoring the day-rate backbone of the European vehicle rental market. Even so, the long-term category, which includes monthly subscriptions, will outpace at an 8.47% CAGR by 2031, nudging its share of the European vehicle rental market to over 20% by 2031. Subscriptions stabilize utilization by retaining assets with one customer for extended periods, thereby lowering turnaround expenses. They also smooth seasonal swings, reallocating fleet risk away from peak-tourism clusters.
Conversely, holding a vehicle longer raises residual-value exposure if secondary-market prices remain volatile, mainly for ICE models. Sophisticated lease-back structures and guaranteed repurchase agreements with OEMs are emerging to cap depreciation. In addition, telematics data gleaned from subscription fleets enhances predictive maintenance, reducing downtime and preserving resale value. Short-term rentals remain essential for capturing last-minute leisure demand and corporate trips, but their share will gradually erode as urban professionals adopt a subscription mindset.
By Application:
Leisure Continues to Set the PaceLeisure rentals secured 64.79% of 2025 revenue, benefiting from the surge in Mediterranean tourism and sustained pent-up demand for experiential travel. The segment is expected to continue expanding at an 8.85% CAGR, increasing its share of the European vehicle rental market size to a significant level by 2031. Weeklong family itineraries demand mid-size SUVs and people carriers, driving higher average transaction values and encouraging operators to maintain diverse fleet mixes. Seasonal price spikes help offset the winter trough, but only if dynamic pricing systems accurately anticipate demand surges.
Business rentals, weighed down by the rise of remote work and tighter travel budgets, posted slower growth. However, corporate environmental targets are steering account managers toward low-carbon packages, nudging order books toward BEV and PHEV models. Operators who can embed verified CO₂ certificates in invoices gain a competitive advantage over procurement teams. With hybrid work expected to remain prevalent, business demand recovery will remain incremental yet resilient to margins, thanks to shorter rental periods and lower wear-and-tear rates.
By Vehicle Type:
Passenger Cars Remain Core Revenue EnginePassenger cars accounted for 46.57% of the market in 2025 and are projected to maintain a 7.89% CAGR through 2031, reflecting elasticity to both tourist and subscription demand. Compact hatchbacks meet urban maneuverability needs and qualify for congestion-charge exemptions in several cities, while mid-size SUVs cater to family travel preferences. The European vehicle rental market, driven by passenger cars, will therefore grow faster than the commercial segments, supporting a broad trim mix.
Light commercial vehicles benefit from e-commerce seasonal spikes, making short-term van rentals economical for parcel couriers. Nonetheless, the limited availability of affordable BEV vans and concerns about payload capacity are restraining the progress of electrification. Heavy commercial vehicles and buses still face steeper challenges due to the weight of batteries and the scarcity of megawatt-scale charging infrastructure, which curtails their growth rate. This uneven electrification trajectory will compel operators to segment procurement strategy by use-case intensity.
By Powertrain:
BEVs Gain Ground from a Small BaseICE models continued to dominate the market with an 83.01% market share in 2025, but are trending downward as lease stacks mature and new capital shifts to electric purchases. BEVs, holding a 9.23% share, are expected to exhibit a 14.77% CAGR by 2031, reshaping fleet-maintenance regimes. The European vehicle rental market size component tied to BEVs will more than double, yet profitability hinges on securing charging partnerships that cap energy costs.
Hybrids and plug-in hybrids offer a transitional hedge, reassuring renters worried about range while allowing operators to reduce CO₂ emissions under forthcoming fleet caps. Regional disparities remain stark. Norway’s fleets are already predominantly electric, whereas those in Southern Europe lag, due to slower charger deployment and visitors' unfamiliarity with BEV operation. Consequently, operators are adopting flexible allocation strategies, moving BEV inventory north in winter when utilization dips in coastal resorts and south during peak summer demand.
By Service Model:
Traditional Rental Dominance Tested by SubscriptionsTraditional day-rate rentals retained 71.87% of 2025 revenue as urban users gravitate to subscription convenience. Established brands are launching subscription tiers with optional vehicle swaps to stem share leakage. Car-sharing, although it accounts for a smaller share, deepens competitive pressure in dense metropolitan corridors; yet it faces higher fleet-balancing costs that restrain profitability.
Subscriptions, climbing at a 7.87% CAGR, integrate insurance, maintenance, and sometimes home charging cables in an all-in monthly price. Telemetry-based billing, which varies with kilometrage, offers further appeal to cost-conscious users. As subscription accounts for approximately 20% of future revenue, firms must recalibrate their remarketing windows, as these contracts extend the average vehicle age and influence residual values.

By End-User:
Self-Driven Bookings Stay Mainstream as Outsourcing Picks UpSelf-driven rentals dominated the market with an 84.02% share in 2025 and are projected to post a 6.85% CAGR through 2031, underpinned by leisure tourists and urban subscribers. Handheld-app key handovers and biometric ID verification reduce pickup times, improving customer satisfaction and asset rotation. Chauffeur services, while niche, cater to executive events and premium tourism; however, labor scarcity and wage inflation challenge margin retention.
Corporate fleet outsourcing benefits companies that wish to eliminate non-core vehicle management and meet their reporting obligations under the CSRD. Outsourcing contracts increasingly bundle real-time emissions data and driver-behavior coaching to lower accident costs. As scope 3 disclosure becomes mandatory, this segment’s growth rate could accelerate, forcing rental operators to invest in data integration platforms and driver training modules to secure tender wins.
Geography Analysis
Germany Vehicle Rental Market
Germany held an 18.22% revenue share in 2025, reflecting its dense corporate-travel base and high short-haul leisure demand. The nation is expected to log a steady CAGR, tempered by car-sharing competition in major cities. Charging infrastructure density and strong government incentives position Germany to be an early leader in BEV rentals, enabling operators to justify large electric vehicle orders ahead of regional averages. However, strict price-transparency rules increase compliance expenditures, widening the cost gap between scaled incumbents and mid-size independents.
Spain Vehicle Rental Market
Spain is expanding at the region’s fastest 9.02% CAGR, propelled by robust Mediterranean tourism and aggressive airline capacity additions. Operators are shifting fleet inventory southward during peak summer, capitalizing on utilization that exceeds 90% at Málaga, Palma de Mallorca, and Barcelona airports. Off-season fleet rotation into Central Europe helps mitigate winter demand softness, although logistical costs rise with cross-border swaps. The rapid rise in tourist arrivals underscores why Spain is likely to become the testing ground for dynamic-pricing AI models tailored to volatile seasonal swings.
Nordics and Broader European Markets
The Nordics, though collectively holding a niche share, post a robust CAGR due to outsized BEV penetration rates. Norway’s nearly all-electric new-registration profile drives operators to field electric-only fleets at Oslo and Bergen airports, demonstrating the viability of zero-emission rental models in high-latitude climates. Nordic governments’ continued fiscal incentives for chargers and toll exemptions further reduce operating costs. At the same time, icy-road conditions accentuate tire wear and warrant specialized winter-tire logistics, adding complexity to fleet budgeting. Across Europe, smaller markets in the Rest-of-Europe cluster grow near the regional mean, buoyed by cross-border leisure traffic and ski-resort rentals that spike during winter holidays.
Competitive Landscape
The European vehicle rental market exhibits moderate concentration, leaving ample room for regional specialists and all-electric disruptors. Electrification is the key battleground; large firms are leveraging fleet-scale purchasing power to secure OEM allocations that smaller rivals cannot match. Subscription platforms and zero-counter keyless pickup are now standard investments, as digital convenience outranks brand loyalty for price-sensitive travellers.
Technology spend is rising sharply. Dynamic-pricing algorithms ingest flight-arrival data, weather forecasts, and competitor rates to optimize yield in real time. Some operators integrate charging-station APIs, showing renters live charger availability and battery range suggestions, which builds confidence in BEV reservations. Meanwhile, startups such as all-electric UFODRIVE highlight cost savings by eliminating counter staff and maintaining lean asset bases.
Infrastructure partnerships differentiate scale players. At major hubs, consolidated rental centers with multi-brand bays lower real-estate costs per unit while amplifying customer rate comparison. Still, the capital burden of building hundreds of high-power chargers pushes mid-tier firms into leaseback deals with energy utilities. Mergers and acquisitions have started to accelerate as financial investors pursue synergies from shared telematics platforms and unified remarketing channels.
Europe Vehicle Rental Industry Leaders
-
Avis Budget Group Inc.
-
Europcar Mobility Group
-
Hertz Global Holdings
-
SIXT SE
-
Enterprise Holdings Inc.
- *Disclaimer: Major Players sorted in no particular order
Europe Vehicle Rental Market Companies Covered in this Report
- Europcar Mobility Group
- Enterprise Holdings Inc.
- SIXT SE
- Avis Budget Group Inc.
- Hertz Global Holdings Inc.
- OK Mobility Group
- Goldcar Rental S.L.
- Auto Europe LLC
- Buchbinder Rent-a-Car
- BlaBlaCar
- Ayvens
- Finn Auto GmbH
- Leasys S.p.A.
- Ubeeqo Carsharing GmbH
- Green Motion International
- Share Now GmbH
- DRIVALIA Car Rental

Recent Industry Developments in Europe Vehicle Rental Market
- October 2025: Avis Budget Group introduced Avis First, a concierge-style premium service that greets travellers at arrivals and escorts them directly to a BMW rental car.
- February 2025: Poppy Mobility began remote-driving delivery tests at the Port of Antwerp-Bruges, partnering with local autonomous-vehicle specialists to shuttle rental cars without human drivers.
- January 2025: UK-based Switch launched MySwitch, offering one-month-minimum contracts across compact, luxury, and van categories to capture demand for flexible mobility in suburban markets.


Europe Vehicle Rental Market Report Scope and Research Methodology
Market Definition and Coverage
Mordor Intelligence defines the European vehicle rental market as the revenue earned when a passenger car, SUV, crossover, light van, or premium sedan is rented for periods ranging from a few hours up to one year through airport and downtown outlets, subscription programs, or tech-enabled car-sharing pods. Value reflects gross rental charges collected within Europe's 27 member states plus the United Kingdom, Norway, Switzerland, and Iceland, converted to constant 2024 USD.
Scope Exclusions: Vehicles hired with driver via ride-hailing apps, long-haul truck leasing, motorcycles, and corporate fleet management contracts are outside this study's scope.
Segments Covered in This Report
-
By Booking Type
- Offline
- Online
-
By Rental Channel
- On-Airport
- Off-Airport
-
By Rental Duration
- Short-Term (up to 30 days)
- Long-Term / Operating Lease (over 30 days)
-
By Application
- Leisure / Tourism
- Business / Corporate
-
By Vehicle Type
- Passenger Cars
- Light Commercial Vehicles
- Heavy Commercial Vehicles and Buses
-
By Powertrain
- Internal Combustion Engine (ICE)
- Hybrid Electric Vehicle (HEV/PHEV)
- Battery Electric Vehicle (BEV)
-
By Service Model
- Traditional Car Rental
- Vehicle Subscription
- Car Sharing
-
By End-User
- Self-Driven
- Chauffeur-Driven
- Corporate Fleet Outsourcing
-
By Country
- Germany
- United Kingdom
- France
- Spain
- Italy
- Netherlands
- Nordics (Sweden, Norway, Denmark, Finland)
- Rest of Europe
Data Sources, Market Sizing, and Validation
Primary Research
Mordor analysts interviewed European airport concession managers, digital rental aggregators, leasing brokers, and EV charging operators across Germany, Spain, the Nordics, and the UK. These discussions clarified real-world utilization swings, cross-border drop-off fees, and electric fleet uptime, letting us challenge secondary estimates and fine-tune price corridors.
Desk Research
We began by mapping fleet counts, utilization days, and average daily rates from open datasets such as Eurostat tourism nights, ACEA new-registration bulletins, national road-toll authorities, and the European Environment Agency's EV uptake tracker. Trade bodies like Leaseurope, the International Road Transport Union, and the World Travel & Tourism Council supplied supporting ratios on business and leisure trip volumes. Public financials and 10-Ks of major listed rental groups, airport concession disclosures, and press releases on subscription launches enriched price and mix assumptions. To reconcile hard-to-obtain outlet-level metrics, analysts accessed D&B Hoovers and Dow Jones Factiva for fleet age profiles and news on bulk vehicle procurements. The sources listed are illustrative; many additional publications were consulted during validation.
Market-Sizing & Forecasting
A top-down model starts with inbound and domestic trip counts, multiplies them by rental penetration rates that vary by purpose, and calibrates revenue using sampled average daily rates and length of rental curves. Results are cross-checked through a selective bottom-up roll-up of fleet sizes reported in company filings and country vehicle hire registries. Key drivers, airport passenger throughput, online booking share, EV share of new rentals, residual value inflation, fuel taxation changes, and subscription fleet churn, feed a multivariate regression that projects demand to 2030. Where bottom-up gaps exist (e.g. privately held operators), we impute volumes from customs import data and dealer delivery logs before applying conservative utilization factors vetted in expert calls.
Data Validation & Update Cycle
Every data cut is triangulated across sources, with variance flags triggering re-checks by a second analyst and, when needed, follow-up interviews. Reports refresh yearly; material events such as VAT shifts or large M&A deals prompt interim model tweaks, and a last-minute sense check is performed before release.
How Mordor Intelligence's Europe Vehicle Rental Market Size Compares to Other Published Estimates
Published figures often differ because firms pick unequal geographic baskets, mix commercial vans with passenger cars, or assume aggressive electric fleet premiums.
Key gap drivers include: some publishers bundle peer-to-peer and chauffeur services; others roll forward 2022 exchange rates without inflation parity; a few extrapolate fleet counts from manufacturer shipment data rather than verified on-rent days; refresh cadences also vary, making their numbers slow to capture rapid post-pandemic rebound.
Benchmark comparison
| Market Size | Anonymized source | Primary gap driver |
|---|---|---|
| USD 15.92 B (2025) | Mordor Intelligence | - |
| USD 36.51 B (2024) | Global Consultancy A | Includes medium trucks and tour buses; limited primary validation |
| USD 23.00 B (2024) | Industry Association B | Omits Norway & Iceland; assumes flat daily rate growth across segments |
The comparison shows how disciplined scoping, timely updates, and dual-path validation let Mordor deliver a balanced, decision-ready baseline that clients can retrace and stress test with confidence.


Key Questions Answered in the Report
What growth rate is forecast for the Europe vehicle rental market through 2031?
The market is projected to post a 6.68% CAGR, lifting revenue from USD 22.37 billion in 2026 to USD 30.91 billion in 2031.
Which channel commands the majority of bookings?
Online platforms held 61.75% of revenue in 2025 and are compounding at a 10.23% CAGR.
How fast are battery-electric vehicles scaling within rental fleets?
BEVs are expanding at a 14.77% CAGR, targeting around significant penetration by 2031.
Why are off-airport rental locations growing faster than airport counters?
Lower facility costs, proximity to urban subscription users, and the ability to bypass concession fees drive an 8.15% CAGR for off-airport hubs.
Page last updated on:


