Drug Discovery GPU Market Size and Share
Market Overview
| Study Period | 2020 - 2031 |
|---|---|
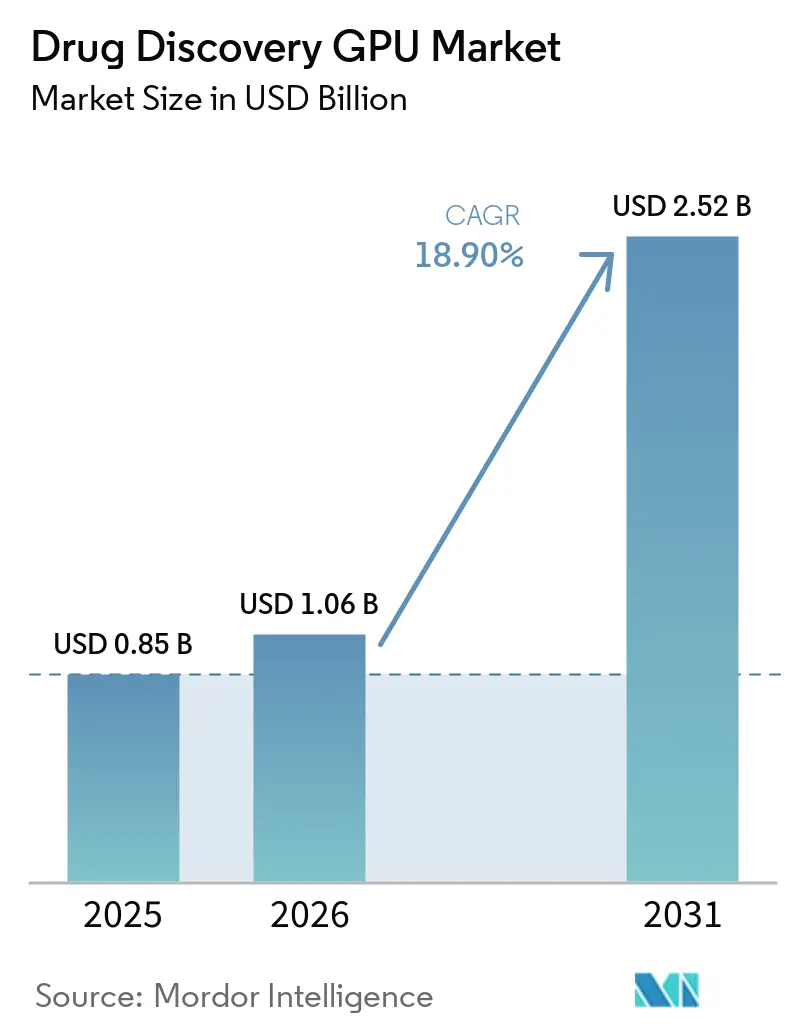
| Market Size (2026) | USD 1.06 Billion |
| Market Size (2031) | USD 2.52 Billion |
| Growth Rate (2026 - 2031) | 18.90% CAGR |
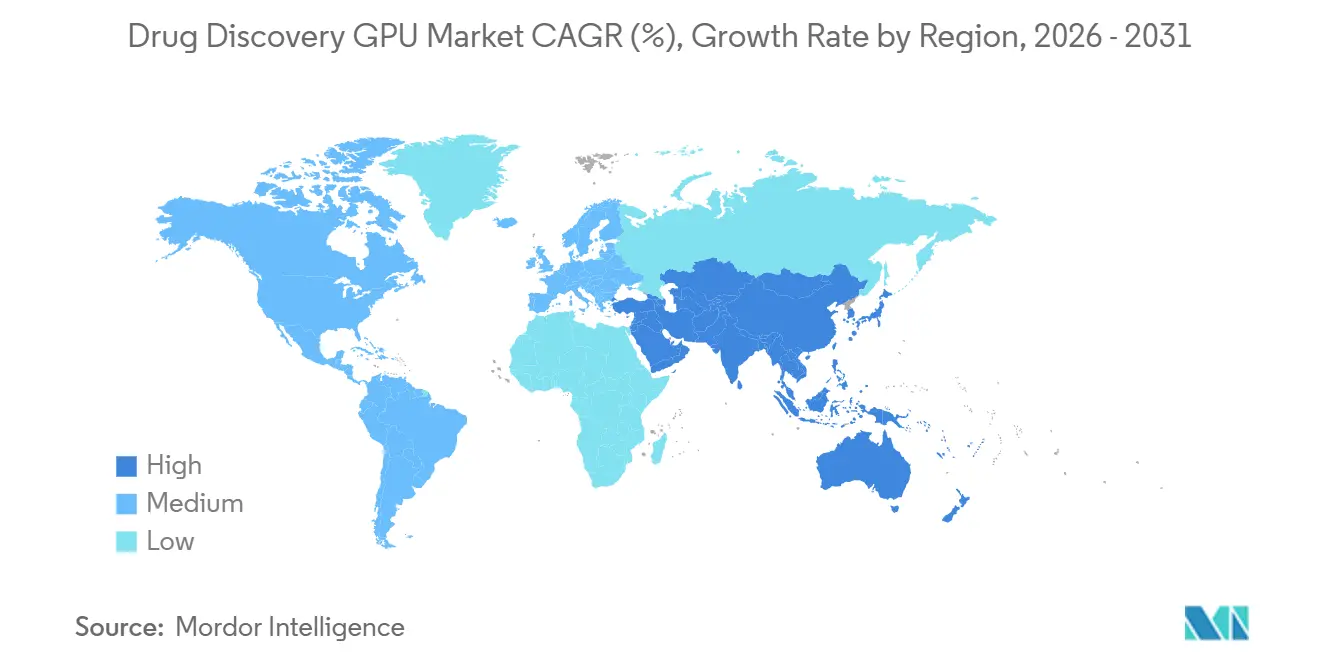
| Fastest Growing Market | Asia-Pacific |
| Largest Market | North America |
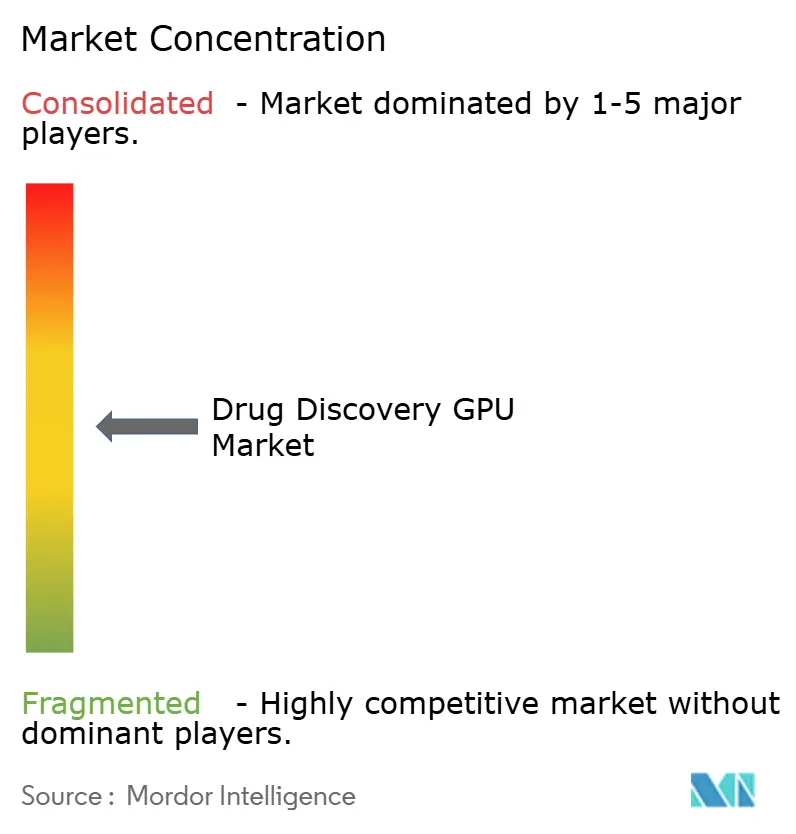
| Market Concentration | Medium |
Major Players *Disclaimer: Major Players sorted in no particular order Image © Mordor Intelligence. Reuse requires attribution under CC BY 4.0. | |
Drug Discovery GPU Market Analysis by Mordor Intelligence
The drug discovery GPU market size is projected to be USD 0.85 billion in 2025, USD 1.06 billion in 2026, and reach USD 2.52 billion by 2031, growing at a CAGR of 18.90% from 2026 to 2031. The drug discovery GPU market is expanding because pharmaceutical research teams are shifting more discovery work from sequential lab testing toward prediction-led computational workflows that can evaluate larger candidate sets before physical validation begins. Generative AI, molecular simulation, and protein modeling are now pulling GPU demand at the same time, which is increasing the importance of compute access across discovery programs rather than within a narrow high performance computing function. Large pharmaceutical companies are committing capital to dedicated AI compute environments, while smaller biotechs and service providers are relying more on cloud access to avoid fixed infrastructure costs and long procurement cycles. Competition remains uneven because hardware leadership is concentrated, but software platforms, model providers, and workflow orchestration tools are still dispersed across many participants with different technical strengths. Energy intensity and fragmented biological data continue to slow full efficiency gains, yet the volume of partnerships, platform launches, and AI-native pipeline investments through 2025 and 2026 shows that the drug discovery GPU market is becoming a core layer of modern pharmaceutical R&D rather than an optional support capability.
Key Report Takeaways
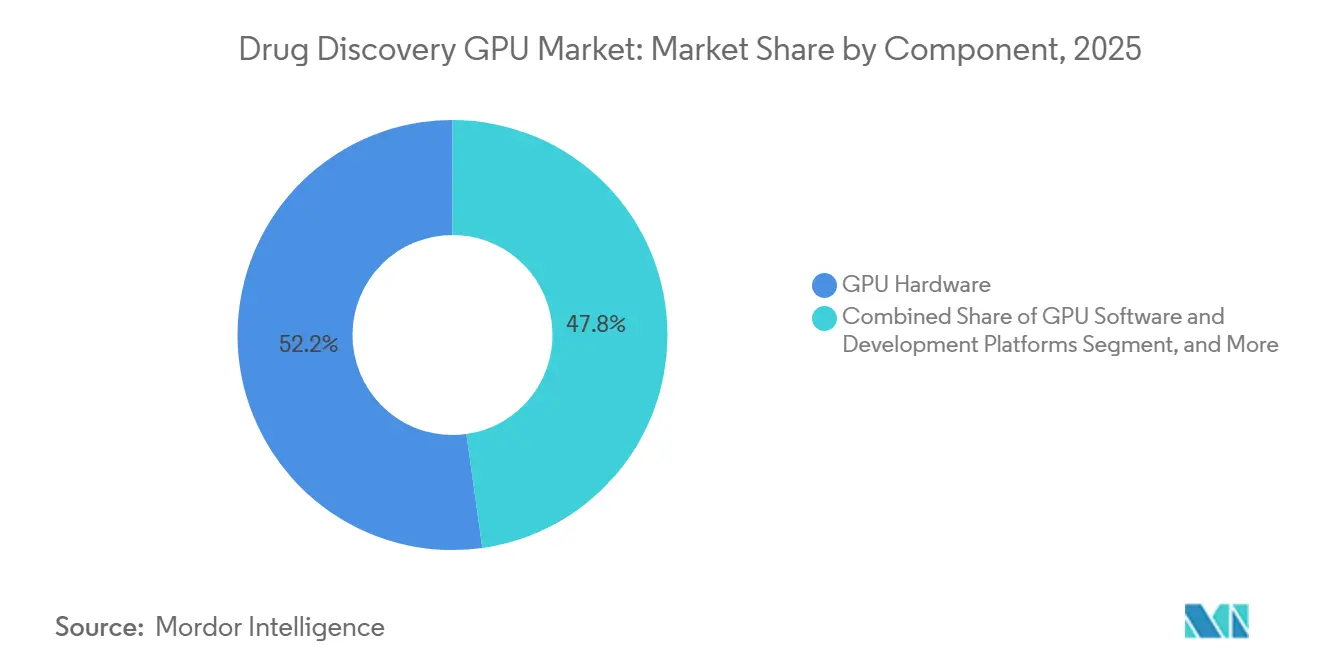
- By component, GPU Hardware led with a 52.22% share in 2025, while GPU Cloud and Infrastructure Services are projected to expand at a 19.45% CAGR through 2031.
- By workload type, Molecular Dynamics Simulation held a 27.56% share of the drug discovery GPU market in 2025, while Generative Molecule Design is expected to record the highest CAGR at 19.67% through 2031.
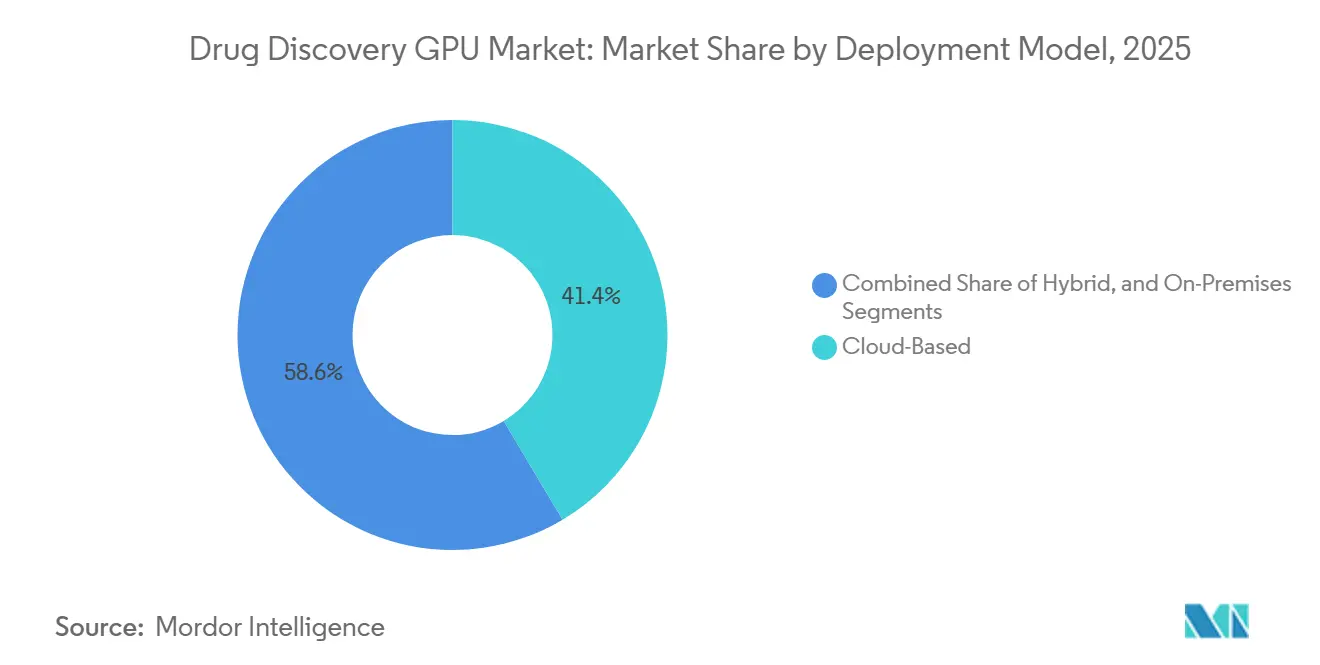
- By deployment model, Cloud-Based deployment accounted for 41.44% of the drug discovery GPU market share in 2025 and is also projected to grow at the fastest 19.32% CAGR through 2031.
- By end user, Pharmaceutical and Biotechnology Companies held 57.34% share in 2025, while Contract Research Organizations are projected to expand at a 19.53% CAGR through 2031.
- By geography, North America led with 42.46% share in 2025, while Asia-Pacific is projected to advance at the fastest 19.33% CAGR through 2031.
Note: Market size and forecast figures in this report are generated using Mordor Intelligence’s proprietary estimation framework, updated with the latest available data and insights as of January 2026.
Global Drug Discovery GPU Market Trends and Insights
Drivers Impact Analysis*
| Driver | (~) % Impact on CAGR Forecast | Geographic Relevance | Impact Timeline |
|---|---|---|---|
| Rising Demand for GPU-Accelerated Molecular Simulation | +4.5% | Global, North America and Europe lead | Medium term (2-4 years) |
| Shift Toward Generative AI for Hit Discovery | +3.8% | Global, with Asia-Pacific accelerating | Medium term (2-4 years) |
| Expansion of Cloud-Based High Performance Compute Access | +2.9% | Global, Asia-Pacific and South America benefit most | Short term (≤ 2 years) |
| Rising Multi-Omics and Protein Structure Data Volumes | +2.5% | Global, led by North America, Europe, and China | Long term (≥ 4 years) |
| Pharma Digital Twin and Virtual Screening Adoption | +2.0% | North America and Europe | Medium term (2-4 years) |
| Public and Private Investment In AI-Native Drug Pipelines | +1.8% | North America and Asia-Pacific | Medium term (2-4 years) |
| Source: Mordor Intelligence | |||
Rising Demand for GPU-Accelerated Molecular Simulation
GPU-accelerated molecular simulation has moved from a helpful research option to a necessary operating layer in the drug discovery GPU market because medicinal chemistry teams need faster iteration across larger experimental spaces. Classical molecular dynamics engines such as Desmond and related Schrödinger workflows run far faster on GPU architecture than on comparable CPU-only environments, which compresses turnaround time for conformational analysis and simulation-led prioritization.[1]Schrödinger, Inc., “Desmond: GPU-Powered High-Performance Molecular Dynamics Engine,” Schrödinger Life Science, schrodinger.com NVIDIA extended this advantage in 2026 through the ALCHEMI Toolkit, which was built around GPU-native molecular dynamics workflows in PyTorch and reduced the host-to-device transfer bottleneck that had limited machine-learned interatomic potential simulations. AMD also improved its position by optimizing GROMACS on its compute platforms with AstraZeneca and Orion Pharma, showing that faster design-make-test-analyze loops can be achieved outside a single-vendor ecosystem. As more discovery groups depend on simulation to narrow candidate sets before synthesis, the drug discovery GPU market is increasingly shaped by how many validated molecular workloads an organization can run per week rather than by how much raw hardware it owns. That shift also strengthens the role of software-hardware compatibility because throughput gains matter only when research teams can move simulation output directly into model training, structure analysis, and next-step compound selection.
Shift Toward Generative AI for Hit Discovery
Generative molecule design is changing workload economics in the drug discovery GPU market because these models keep GPUs engaged through repeated inference, sampling, ranking, and refinement cycles rather than through isolated screening jobs. NVIDIA expanded BioNeMo in January 2026 into a broader open development platform that included RNA structure prediction, molecular synthesis, toxicity prediction, and de novo molecule generation, which widened the practical scope of GPU-led pharmaceutical discovery work.[2]NVIDIA Newsroom, “NVIDIA BioNeMo Platform Adopted by Life Sciences Leaders to Accelerate AI-Driven Drug Discovery,” NVIDIA Newsroom, nvidianews.nvidia.com Peer-reviewed literature published in 2025 also showed that generative AI is moving beyond narrow ligand design into broader protein design and molecular science applications, which increases the persistence of GPU demand across target classes and program stages. In the drug discovery GPU market, this matters because generative workflows do not replace downstream testing, they create larger and more diverse candidate pools that still require simulation, docking, safety prediction, and optimization. That chain effect increases total compute usage across multiple workload categories even when the first point of adoption appears to be limited to hit generation. It also explains why the fastest growth is emerging in speculative design workloads, where the value of compute is tied not only to speed but also to the ability to search chemical space that traditional screening methods cannot cover efficiently.
Expansion of Cloud-Based High Performance Compute Access
Cloud access is broadening participation in the drug discovery GPU market because many biotechs, academic spinouts, and smaller service firms cannot justify the cost and operational burden of private GPU clusters. AWS linked HealthOmics with NVIDIA BioNeMo foundation models and NIM Agent Blueprints in 2025, which gave research teams a route to GPU-optimized generative and screening workflows without having to provision dedicated local hardware.[3]Amazon Web Services, “Accelerating Drug Discovery with AWS HealthOmics and NVIDIA Blueprints,” AWS Blog, aws.amazon.com Microsoft Azure and NVIDIA also made BioNeMo NIM microservices available for protein science and molecular modeling workloads, which reduced setup friction for teams that previously needed specialized on-premise infrastructure to run advanced discovery tasks. NTT demonstrated another model in Japan during February 2025 by launching remote GPU delivery for pharmaceutical researchers at Shonan iPark through IOWN APN technology, which showed that secure multi-tenant architectures can support shared access in research cluster settings. In the drug discovery GPU market, competition among cloud providers is therefore shifting toward integrated life sciences environments, compliance-ready services, and workflow packaging rather than simple hourly compute pricing. That pattern supports faster adoption, but it also deepens dependence on a smaller set of platform operators that control the surrounding software, data pipelines, and deployment standards.
Rising Multi-Omics and Protein Structure Data Volumes
The drug discovery GPU market is also being pulled forward by the volume and complexity of multi-omics data, because target discovery now depends on integrating genomic, transcriptomic, proteomic, and metabolomic signals across large datasets. A 2025 study in Biology showed that deep learning-enabled multi-omics integration is becoming central to precise drug target discovery, and that these workflows depend on accelerated architectures that can process long and cross-modality inputs efficiently. NVIDIA also reported that its RTX PRO 6000 Blackwell Server Edition enabled protein structure inference at sharply higher speeds with MMseqs2-GPU, bringing proteome-scale folding tasks closer to standard single-server deployment. Research published through the National Library of Medicine in 2025 further showed that omics-based large language models are beginning to unify genomic sequences, protein structures, and functional annotations in common representation spaces, which creates another sustained class of GPU-intensive training and fine-tuning tasks. In practical terms, the drug discovery GPU market benefits because data generation is moving faster than analytic capacity, which leaves a continuing queue of discovery workloads waiting for accelerated compute. As pharmaceutical companies adopt broader data fusion strategies, the value of GPUs is increasingly tied to end-to-end biological interpretation rather than to isolated model execution.
Restraints Impact Analysis*
| Restraint | (~) % Impact on CAGR Forecast | Geographic Relevance | Impact Timeline |
|---|---|---|---|
| High GPU Infrastructure and Energy Costs | -1.8% | Global, especially difficult for Asia-Pacific startups and South America | Medium term (2-4 years) |
| Data Fragmentation Across Biological and Chemical Silos | -1.4% | Global | Long term (≥ 4 years) |
| Explainability and Validation Burden for AI-Designed Molecules | -1.0% | North America and Europe | Medium term (2-4 years) |
| Shortage of Cross-Functional AI, Chemistry, and Biology Talent | -0.8% | Global, strongest pressure in Asia-Pacific and South America | Long term (≥ 4 years) |
| Source: Mordor Intelligence | |||
High GPU Infrastructure and Energy Costs
High infrastructure cost remains a meaningful restraint on the drug discovery GPU market because the capital needed for dense compute systems, cooling, power delivery, and facility design is far beyond the reach of many mid-sized research organizations. Industry reporting cited in the source draft showed very high power draw for leading accelerators and pointed to the need for advanced cooling environments, which underscores why private deployments remain concentrated among well-funded pharmaceutical and hyperscale operators. NVIDIA’s January 2026 announcement on the live Lilly AI factory also showed that major deployments are now being built as purpose-designed environments rather than as standard server-room extensions, which illustrates the scale of commitment needed for frontier drug discovery workloads. Roche reinforced the same pattern in March 2026 by deploying more than 3,500 NVIDIA Blackwell GPUs across hybrid cloud and on-premise environments, which confirms that major therapeutic companies are still using scale and balance sheet strength as competitive tools in compute access. Sustainability adds another constraint because energy-intensive clusters must increasingly align with internal carbon goals and board-level oversight on infrastructure planning. The drug discovery GPU market therefore grows fastest where firms can either absorb these fixed costs directly or shift them into flexible cloud spending without losing scientific throughput.
Data Fragmentation Across Biological and Chemical Silos
Data fragmentation slows the drug discovery GPU market because compute acceleration alone does not solve the underlying problem of disconnected biological, chemical, and operational datasets. The Pistoia Alliance and Zühlke reported in 2025 that AI adoption in pharmaceutical R&D still faces diffused accountability, inconsistent benchmarking, and persistent gaps across research, digital, and IT functions, all of which reduce the efficiency of advanced analytics programs. Nature Chemical Engineering published a 2025 study on the FLuID federated learning framework, which showed that predictive performance can improve across organizational silos while preserving confidentiality, but it also made clear that the supporting integration layer is neither simple nor cheap. In the drug discovery GPU market, fragmented data means that expensive compute can remain underused because research teams still spend time cleaning formats, reconciling annotations, and restructuring experimental context before models can run effectively. This restraint is especially persistent because it is rooted in long-standing laboratory systems and process design rather than in a short-term shortage of hardware. Until organizations improve interoperability and governance at scale, the drug discovery GPU market will continue to carry an execution gap between theoretical compute potential and realized scientific output.
*Our forecasts treat driver/restraint impacts as directional, not additive. The impact forecasts reflect baseline growth, mix effects, and variable interactions.
Segment Analysis
By Component: GPU Hardware Anchors Revenue While Cloud Services Scale
GPU Hardware held 52.22% of the drug discovery GPU market share in 2025, which reflected the heavy first wave of infrastructure buildout by pharmaceutical companies and major compute providers. The live deployment of LillyPod and the January 2026 NVIDIA and Eli Lilly partnership showed how large-cap drugmakers are treating dedicated AI compute as a long-duration research asset rather than as a temporary experiment. Roche extended the same investment pattern in March 2026 by launching an AI factory with more than 3,500 NVIDIA Blackwell GPUs across hybrid cloud and on-premise environments, which reinforced hardware’s leading revenue role in this phase of the drug discovery GPU market. Hardware leadership also reflects practical buying behavior because companies need cluster density, memory bandwidth, and validated infrastructure before they can capture value from advanced discovery software. In that sense, hardware remains the operational foundation on which the rest of the drug discovery GPU market is being built.
GPU Cloud and Infrastructure Services are projected to expand at a 19.45% CAGR through 2031, which makes them the fastest-growing component even though owned hardware still leads current revenue. AWS and Microsoft Azure both expanded access to NVIDIA BioNeMo-enabled workflows, which supports a wider customer base that values speed of deployment more than physical ownership of GPUs. GPU software and development platforms are also gaining ground because vendors such as Schrödinger and NVIDIA are tying discovery productivity more closely to subscription, platform, and throughput models rather than to hardware sales alone. Integration and support services remain smaller by revenue, but they are becoming more important as customers manage hybrid cloud, regulated research workflows, and multi-tool deployment across chemistry and biology teams. The drug discovery GPU industry within this component view is therefore moving from hardware-first purchasing toward a more layered stack where access, orchestration, and deployment simplicity drive a larger share of incremental growth.


By Workload Type: Generative Molecule Design Reshapes Compute Intensity
Molecular Dynamics Simulation accounted for 27.56% of the drug discovery GPU market size in 2025, which kept it as the largest workload because physics-based validation remains central to structure-aware discovery programs. Schrödinger’s GPU-powered simulation environment still represents one of the most established commercial examples of this category, and its continuing relevance shows that simulation is not being displaced even as AI-native methods spread. Simulation remains the grounding layer for candidate refinement because it helps teams understand conformational behavior, binding stability, and downstream feasibility before synthesis and wet-lab testing scale further. The drug discovery GPU market still depends on this workload for core scientific confidence, especially in settings where generated compounds must be filtered through robust physical validation. That is why the largest share remains with a mature and trusted workload rather than with the newest class of models.
Generative Molecule Design is projected to record the fastest 19.67% CAGR through 2031, which reflects the much higher persistence of compute demand once generative systems become embedded in hit identification and lead exploration. NVIDIA’s broader BioNeMo platform push in 2026 and the emerging literature on generative AI for molecular science both support the view that these models are widening from niche experimentation into repeatable discovery workflows. Protein Structure Prediction, Virtual Screening and Docking, and Multi-Omics Analytics continue to build a broader demand mix, especially as folding, ranking, and biological context generation become more tightly linked in single research programs. The practical outcome for the drug discovery GPU market is that one discovery program can now trigger repeated GPU use across design, screening, validation, and systems-level interpretation instead of within one isolated analytic stage. The drug discovery GPU industry is therefore seeing growth not only because more tasks use GPUs, but because each successful task increasingly creates follow-on compute demand across adjacent workloads.
By Deployment Model: Cloud-Based Platforms Lead in Share and Growth
Cloud-Based deployment held 41.44% share of the drug discovery GPU market size in 2025 and is projected to expand at a 19.32% CAGR through 2031, which gives it leadership in both current adoption and future growth. AWS and Microsoft Azure strengthened this model by linking GPU infrastructure with life sciences workflows, model services, and faster access to preconfigured discovery tools. This matters in the drug discovery GPU market because elastic access allows research teams to run large campaigns, pause when needed, and avoid waiting for local hardware refresh cycles. Cloud deployment also lowers participation barriers for smaller biotechs and specialized service providers that need frontier compute but cannot justify a fixed-asset strategy. As a result, cloud is increasingly becoming the default route for organizations that prioritize speed, flexibility, and broad tool access.
On-Premise and Hybrid models still matter because large pharmaceutical companies continue to value control over sensitive data, consistent performance, and tighter integration with internal research systems. LillyPod and Roche’s Blackwell deployments showed that the biggest companies are still building substantial owned environments even as they use hybrid models to scale across workloads and geographies. NTT’s Shonan iPark demonstration also highlighted that secure remote access can serve as a middle path for organizations that want shared compute without losing oversight of research environments. The drug discovery GPU market is therefore not moving toward a single deployment answer, it is moving toward architectures that balance burst capacity, governance, and scientific continuity. Over time, hybrid deployment is likely to remain strategically important because it gives enterprises a way to protect core datasets while still accessing scalable external compute for peak discovery demand.
By End User: Large Pharma Leads While CRO Demand Builds
Pharmaceutical and Biotechnology Companies held 57.34% of the drug discovery GPU market share in 2025, which reflected their early and large-scale commitment to AI factories, simulation environments, and integrated discovery platforms. NVIDIA’s 5-year partnership with Eli Lilly and Roche’s March 2026 AI factory deployment both illustrate how leading therapeutic companies are using compute infrastructure as a direct extension of research strategy. These companies lead because they combine financial capacity, proprietary datasets, regulatory familiarity, and broad therapeutic pipelines that can absorb high fixed compute costs. In the drug discovery GPU market, that combination gives large pharma an advantage in converting infrastructure into compound throughput, model refinement, and platform lock-in. It also explains why the largest share remains with organizations that can spread compute investment across multiple programs and functions rather than relying on one or two experimental use cases.
Contract Research Organizations are projected to expand at a 19.53% CAGR through 2031, which points to a growing preference for outsourced access to advanced compute capabilities. The cloud expansion described by AWS, Microsoft Azure, and NTT supports this trend because service providers can scale GPU-enabled discovery offerings without replicating the full capital intensity of in-house pharmaceutical clusters. Academic, government, and nonprofit institutes remain structurally important because they broaden the research base and often contribute target discovery, algorithm development, and early biological insight that later move into commercial pipelines. The drug discovery GPU market is therefore widening beyond enterprise ownership toward service-led and shared-access models that can package compute, software, and scientific support together. That widening should help expand participation, even though the highest-value deployments still sit with the largest pharmaceutical companies.
Geography Analysis
North America held 42.46% of the drug discovery GPU market size in 2025, which made it the largest regional contributor because it combines leading pharmaceutical balance sheets, cloud infrastructure depth, and dense biotech clusters. NVIDIA and Eli Lilly’s January 2026 partnership, together with LillyPod’s live deployment, showed the scale of compute investment that North American firms are now willing to treat as core discovery infrastructure. The United States remains the center of the drug discovery GPU market because major research corridors in Boston-Cambridge, the San Francisco Bay Area, and San Diego pull hardware, software, and model innovation into the same commercial network. Canada also adds momentum through academic and research-intensive ecosystems that support life sciences computing, even though its commercial footprint remains smaller than that of the United States. The regional advantage is therefore not only about spending power, it is also about the closeness between drug developers, platform vendors, and high-end compute availability.
Asia-Pacific is projected to expand at a 19.33% CAGR through 2031, which makes it the fastest-growing regional segment in the drug discovery GPU market. NTT’s February 2025 launch at Shonan iPark showed that Japanese stakeholders are building secure remote compute models tailored to pharmaceutical research needs rather than simply copying Western cloud deployment patterns. China remains central to the region’s scale because AI-driven discovery activity, service platform growth, and strong biotech clustering continue to support higher GPU intensity across research workflows. South Korea is also emerging as a focused policy market for AI-enabled drug discovery, while Japan continues to strengthen practical infrastructure suited to collaborative pharmaceutical environments. The regional growth story in the drug discovery GPU market comes from capacity expansion, rising domestic R&D sophistication, and a willingness to build local compute pathways that match national data and research preferences.
Europe remains the second-largest regional position in the drug discovery GPU market, supported by large pharmaceutical groups, strong translational science, and a continuing need for secure compute in regulated development settings. Roche’s March 2026 AI factory deployment across the United States and Europe demonstrated that European-headquartered companies are investing at the same strategic level as their North American peers. Germany, the United Kingdom, and France provide the broadest commercial base, while Italy and France add incremental opportunity through established manufacturing strength and expanding biotech activity. South America and Middle East and Africa remain earlier-stage regions within the drug discovery GPU market because infrastructure readiness, energy constraints, and supply limitations still weigh on adoption. Even so, their long-term relevance should improve as pharmaceutical manufacturing investment and digital research capacity expand after the current infrastructure bottlenecks ease.

Competitive Landscape
The drug discovery GPU market has a split competitive structure because the hardware layer is concentrated while software, services, and model platforms remain much more fragmented. NVIDIA continues to hold the strongest position at the hardware and platform level, with its H100 and Blackwell architectures appearing across major pharmaceutical AI factory announcements through 2025 and 2026. AMD is the most visible challenger in accelerated biochemical research because its GROMACS optimization work with AstraZeneca and Orion Pharma shows credible progress in performance for real discovery workflows. At the infrastructure layer, server and system suppliers such as Super Micro Computer and Dell Technologies support cluster buildouts, but strategic influence still sits largely with the GPU architecture owner and the hyperscale environments around it. This is why the drug discovery GPU market shows strong concentration in one layer even though the broader ecosystem still contains many specialized vendors.
Cloud and platform competition is taking shape around depth of scientific tooling rather than around raw compute pricing alone. AWS and Microsoft Azure are both using NVIDIA-linked discovery services to make GPU access easier for pharmaceutical users who want faster deployment and less infrastructure management. Schrödinger remains one of the most established software participants in the drug discovery GPU market because it combines molecular simulation, informatics, and enterprise workflow integration in ways that are already familiar to many discovery teams. Its May 2026 announcement on Bunsen and its January 2026 integration with Lilly TuneLab show a strategy built around ecosystem embedding rather than stand-alone point solutions. The competitive effect is that software vendors gain leverage when they become part of the daily research environment instead of remaining optional optimization tools.
Strategic moves in 2025 and 2026 show that partnerships and platform control are becoming more important than isolated product launches in the drug discovery GPU market. NVIDIA’s open-source release of the ALCHEMI Toolkit broadened developer access while still reinforcing demand for the underlying GPU stack, which is a classic ecosystem expansion move. Roche’s global AI factory rollout and Eli Lilly’s dedicated LillyPod environment show that major pharmaceutical companies are not only buying compute, they are shaping competitive standards for how discovery infrastructure is organized. Recursion’s completed combination with Exscientia in November 2024 also showed that AI drug discovery players are using consolidation to deepen end-to-end platform breadth and proprietary data advantage. The overall picture is that the drug discovery GPU market remains open enough for differentiated software and service players to grow, but the strongest competitive positions belong to firms that can connect compute, proprietary tools, and discovery workflows into a durable operating system for pharmaceutical R&D.
Drug Discovery GPU Industry Leaders
NVIDIA Corporation
Microsoft Corporation
Amazon Web Services, Inc.
Alphabet Inc.
IBM Corporation
- *Disclaimer: Major Players sorted in no particular order

Recent Industry Developments
- June 2026: Schrödinger announced an early-access release of Bunsen, its agentic AI co-scientist that autonomously executes complex molecular discovery workflows, planned for summer 2026. Bunsen expands GPU throughput utilization by enabling non-specialist researchers to execute Schrödinger's full physics and AI simulation stack without manual workflow management.
- March 2026: Roche deployed an AI factory with over 3,500 NVIDIA Blackwell GPUs across hybrid cloud and on-premises environments in the United States and Europe, establishing the pharmaceutical industry's largest announced hybrid-cloud GPU infrastructure at the time. The deployment supports Genentech's Lab-in-the-Loop strategy for AI-driven drug discovery and manufacturing digital twins.
- January 2026: NVIDIA and Eli Lilly announced a 5-year, USD 1 billion strategic partnership at the J.P. Morgan Healthcare Conference, with NVIDIA BioNeMo expanded into a full open development platform. LillyPod simultaneously went live, a DGX SuperPOD with 1,016 NVIDIA Blackwell Ultra GPUs delivering over 9,000 petaflops, as the pharmaceutical industry's most powerful dedicated AI compute system.
- October 2025: Eli Lilly unveiled LillyPod at NVIDIA GTC Washington, D.C. as the first NVIDIA DGX SuperPOD with DGX B300 systems wholly owned by a pharmaceutical company, designed to support genomics, molecular design, and personalized medicine workloads at industrial scale.


Global Drug Discovery GPU Market Report Scope
The Global Drug Discovery GPU Market refers to the specialized segment of the pharmaceutical and biotechnology industry that leverages Graphics Processing Units (GPUs) to accelerate computational tasks involved in drug discovery, including molecular modeling, protein structure prediction, virtual screening, and AI-driven simulations.
The Drug Discovery GPU Market Report is Segmented by Component (GPU Hardware, GPU Software and Development Platforms, GPU Cloud and Infrastructure Services, and GPU Integration and Support Services), Workload Type (Molecular Dynamics Simulation, Virtual Screening and Docking, Protein Structure Prediction, Generative Molecule Design, Multi-Omics Analytics, and Other Workload Types (ADMET, Toxicity Prediction and Lead Optimization, Multi-Omics and Biomarker Analytics)), Deployment Model (Cloud-Based, On-Premise, and Hybrid), End User (Pharmaceutical and Biotechnology Companies, Contract Research Organizations, Academic and Research Institutes, and Government and Nonprofit Research Institutes), and Geography (North America, Europe, Asia-Pacific, South America, Middle East and Africa). The Market Forecasts are Provided in Terms of Value (USD).
| GPU Hardware |
| GPU Software and Development Platforms |
| GPU Cloud and Infrastructure Services |
| GPU Integration and Support Services |
| Molecular Dynamics Simulation |
| Virtual Screening and Docking |
| Protein Structure Prediction |
| Generative Molecule Design |
| Multi-Omics Analytics |
| Other Workload Types (ADMET, Toxicity Prediction and Lead Optimization, Multi-Omics and Biomarker Analytics) |
| Cloud-Based |
| On-Premise |
| Hybrid |
| Pharmaceutical and Biotechnology Companies |
| Contract Research Organizations |
| Academic and Research Institutes |
| Government and Nonprofit Research Institutes |
| North America | United States |
| Canada | |
| Mexico | |
| Europe | Germany |
| United Kingdom | |
| France | |
| Italy | |
| Rest of Europe | |
| Asia-Pacific | China |
| Japan | |
| South Korea | |
| India | |
| Southeast Asia | |
| Rest of Asia-Pacific | |
| South America | |
| Middle East and Africa |
| By Component | GPU Hardware | |
| GPU Software and Development Platforms | ||
| GPU Cloud and Infrastructure Services | ||
| GPU Integration and Support Services | ||
| By Workload Type | Molecular Dynamics Simulation | |
| Virtual Screening and Docking | ||
| Protein Structure Prediction | ||
| Generative Molecule Design | ||
| Multi-Omics Analytics | ||
| Other Workload Types (ADMET, Toxicity Prediction and Lead Optimization, Multi-Omics and Biomarker Analytics) | ||
| By Deployment Model | Cloud-Based | |
| On-Premise | ||
| Hybrid | ||
| By End User | Pharmaceutical and Biotechnology Companies | |
| Contract Research Organizations | ||
| Academic and Research Institutes | ||
| Government and Nonprofit Research Institutes | ||
| By Geography | North America | United States |
| Canada | ||
| Mexico | ||
| Europe | Germany | |
| United Kingdom | ||
| France | ||
| Italy | ||
| Rest of Europe | ||
| Asia-Pacific | China | |
| Japan | ||
| South Korea | ||
| India | ||
| Southeast Asia | ||
| Rest of Asia-Pacific | ||
| South America | ||
| Middle East and Africa | ||


Key Questions Answered in the Report
What is the projected size of the drug discovery GPU market by 2031?
The drug discovery GPU market is forecast to reach USD 2.52 billion by 2031 from USD 1.06 billion in 2026, growing at a CAGR of 18.90% over 2026-2031.
Why are GPUs becoming more important in drug discovery?
GPUs are becoming more important because they speed up molecular simulation, generative design, protein structure work, and multi-omics analysis, which helps research teams evaluate larger candidate sets in less time.
Which region leads current demand for drug discovery GPU systems?
North America led in 2025 with a 42.46% share because it combines large pharmaceutical AI investments, dense biotech clusters, and strong access to advanced cloud and hardware infrastructure.
Which region is expected to grow the fastest through 2031?
Asia-Pacific is projected to grow the fastest at a 19.33% CAGR as pharmaceutical companies and research ecosystems in countries such as China, Japan, and South Korea keep building compute capacity.
Which deployment model is seeing the strongest traction?
Cloud-based deployment held the largest 41.44% share in 2025 and is also the fastest-growing model at a 19.32% CAGR because it gives research teams flexible access to high-end compute without major fixed investment.
Who are the main users of GPU platforms in pharmaceutical research?
Pharmaceutical and biotechnology companies remain the largest users with 57.34% share in 2025, while CROs are the fastest-growing end users at a 19.53% CAGR as outsourced compute-led discovery services expand.
Page last updated on:


