
GPU In Healthcare and Medical Imaging Market Size and Share
Market Overview
| Study Period | 2020 - 2031 |
|---|---|
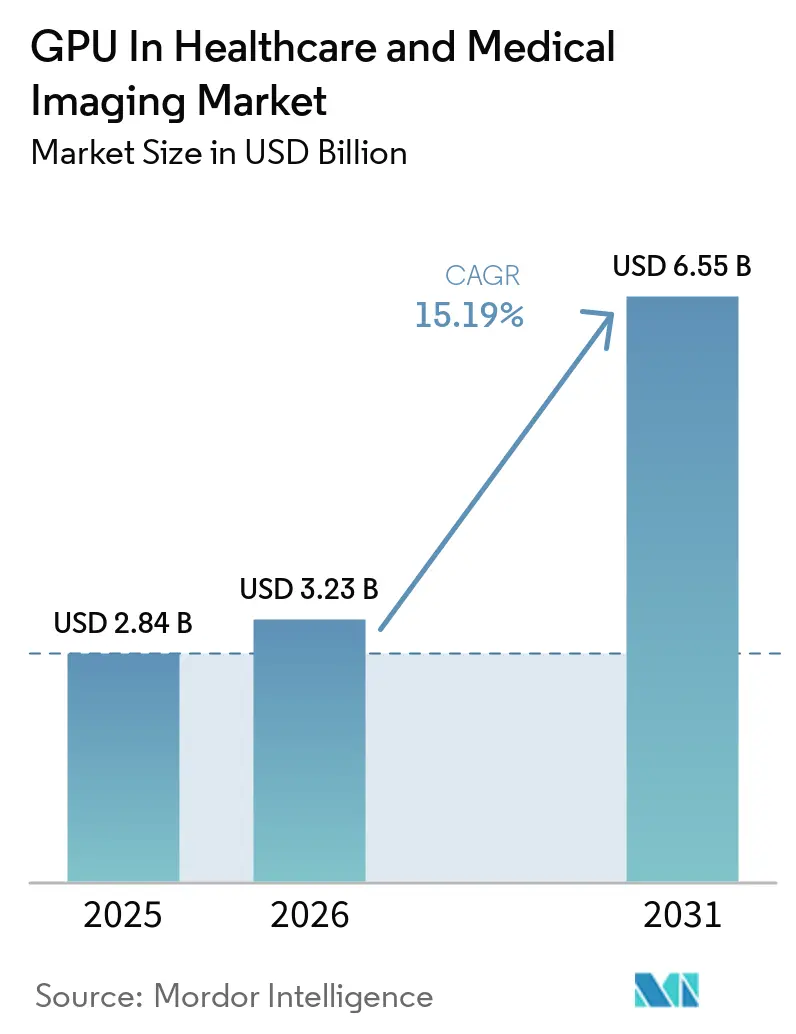
| Market Size (2026) | USD 3.23 Billion |
| Market Size (2031) | USD 6.55 Billion |
| Growth Rate (2026 - 2031) | 15.19 % |
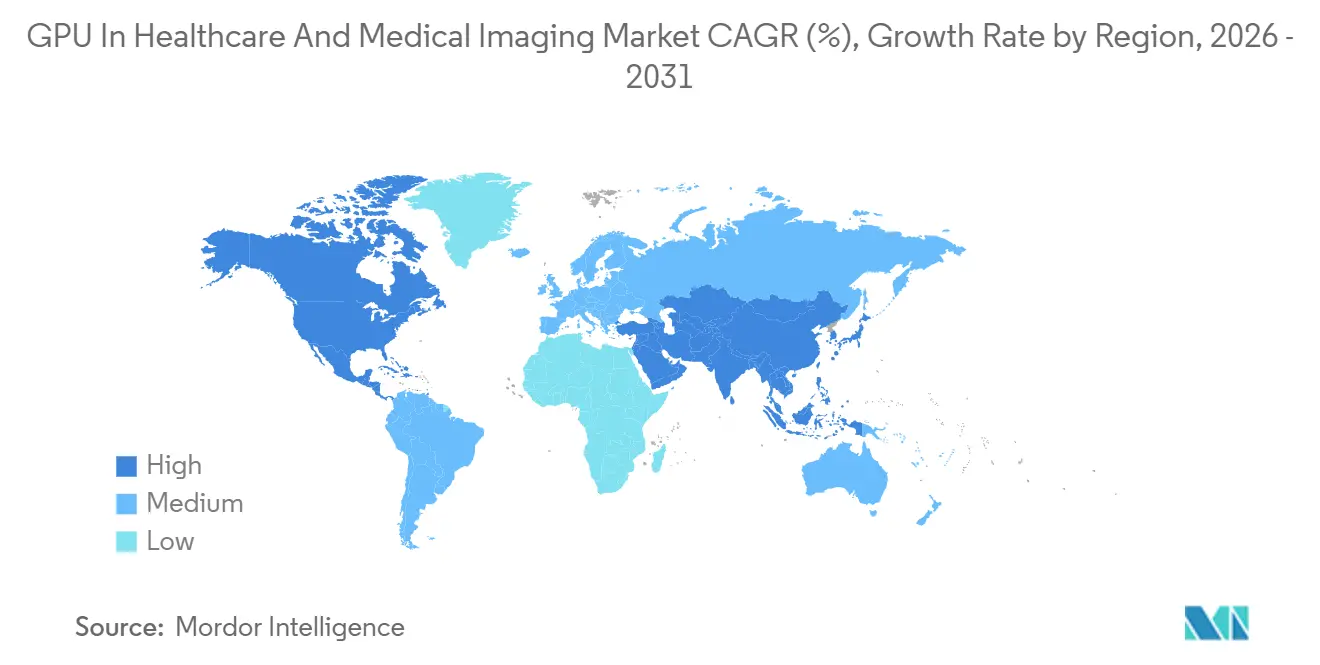
| Fastest Growing Market | Asia-Pacific |
| Largest Market | North America |
| Market Concentration | Medium |
Major Players *Disclaimer: Major Players sorted in no particular order Image © Mordor Intelligence. Reuse requires attribution under CC BY 4.0. | |
GPU In Healthcare and Medical Imaging Market Analysis by Mordor Intelligence
The GPU in healthcare and medical imaging market size is expected to increase from USD 2.84 billion in 2025 to USD 3.23 billion in 2026 and reach USD 6.55 billion by 2031, growing at a CAGR of 15.19% over 2026-2031. The rise mirrors surging compute needs as hospitals move from narrow radiology models to multimodal foundation models that combine imaging, genomics and clinical text. Vendors respond with GPU-accelerated platforms that bundle pre-trained models and managed regulatory documentation, lowering barriers for mid-tier providers. Competitive momentum centers on liquid-cooled H100-class systems, edge inference appliances and cloud GPU subscriptions, each targeting latency, capital-expenditure and data-sovereignty pain points. At the same time, regulatory fast-tracking in the United States and the European Union compresses approval timelines, prompting faster refresh cycles for AI-enabled scanners and surgical workstations.
Key Report Takeaways
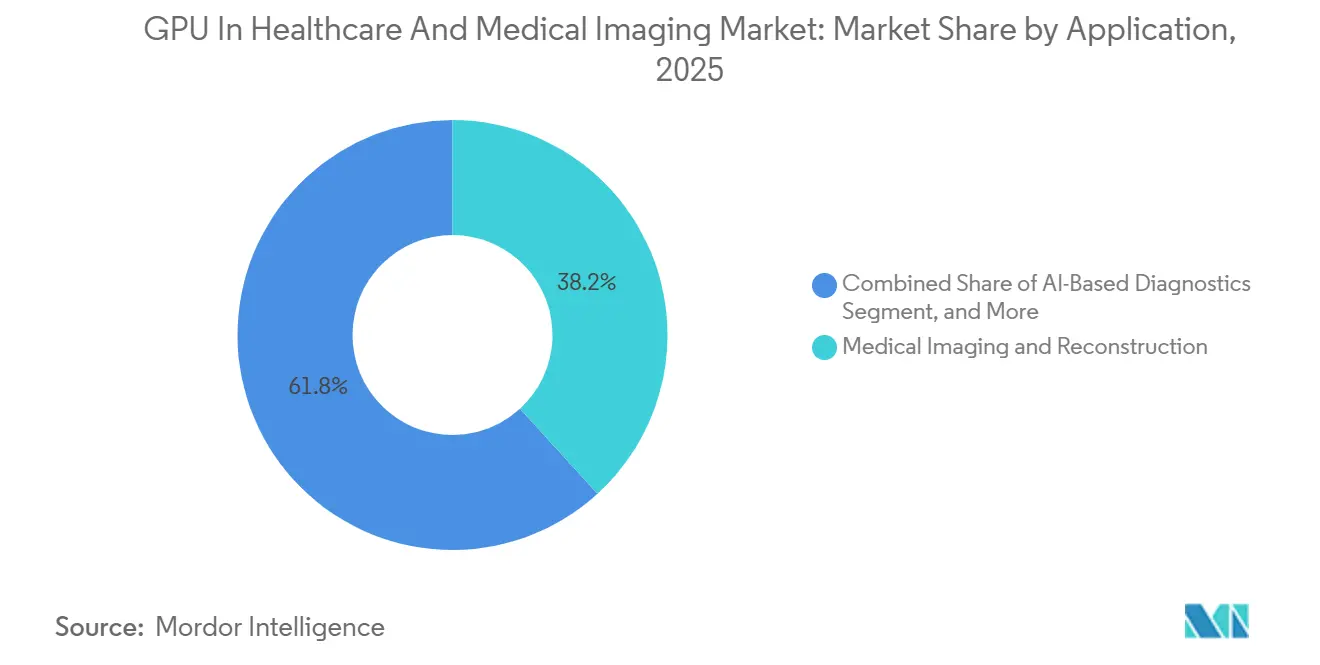
- By application, medical imaging and reconstruction led with 38.22% share of the GPU in healthcare and medical imaging market in 2025, while drug discovery and simulation are forecast to expand at the fastest CAGR of 15.34% through 2031.
- By deployment model, on-premise clusters accounted for 51.45% of the GPU in the healthcare and medical imaging market size in 2025, and cloud-based healthcare AI platforms are projected to record the highest growth rate of 15.73% to 2031.
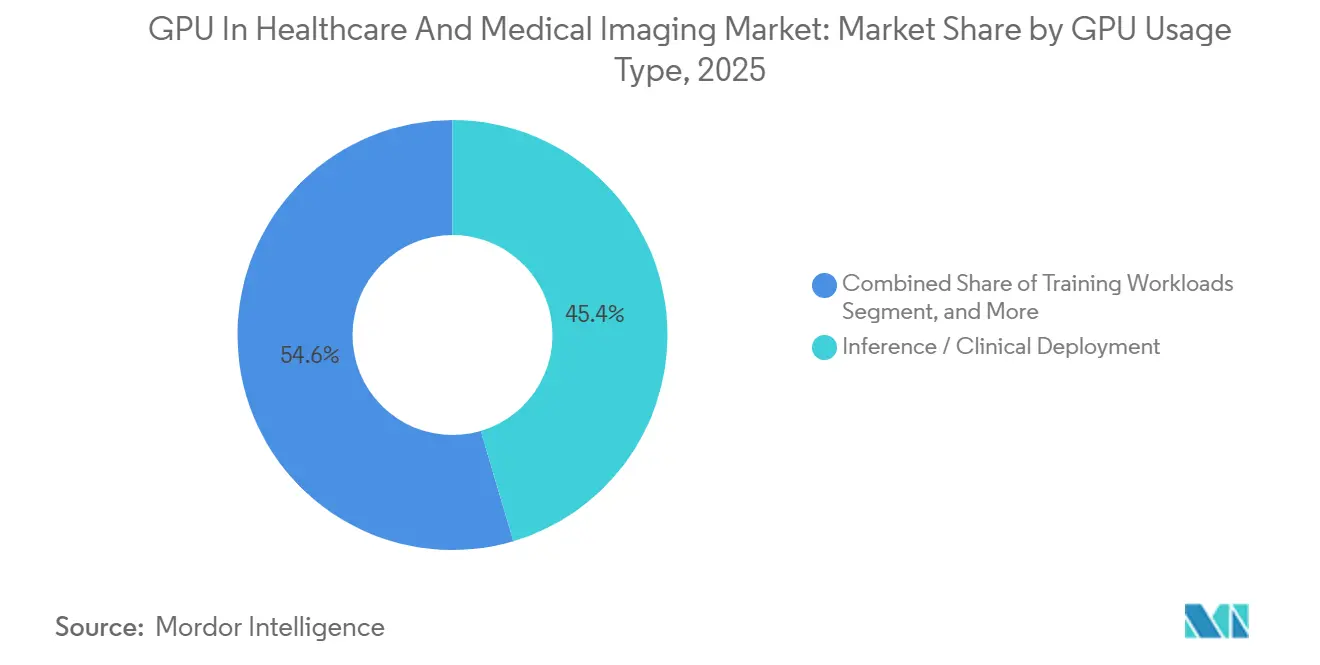
- By GPU usage type, inference and clinical deployment held 45.43% share of the GPU in the healthcare medical imaging market size in 2025, whereas training workloads will experience the highest CAGR at 15.62% through 2031.
- By end-user, hospitals and diagnostic centers captured 48.76% share of the GPU in healthcare medical imaging market size in 2025, whereas pharmaceutical and biotech companies are advancing at the highest CAGR of 15.42% through 2031.
- By geography, North America commanded 40.67% of the GPU in healthcaremedical imaging market share in 2025, and Asia-Pacific is projected to be the fastest-growing region with an CAGR of 15.77% over the forecast period.
Note: Market size and forecast figures in this report are generated using Mordor Intelligence’s proprietary estimation framework, updated with the latest available data and insights as of January 2026.
Market Trends and Insights
Drivers Impact Analysis of GPU In Healthcare and Medical Imaging Market*
| Driver | (~) % Impact on CAGR Forecast | Geographic Relevance | Impact Timeline |
|---|---|---|---|
| Accelerating adoption of foundation-model medical imaging LLMs | +3.8% | Global, with early uptake in North America and Europe | Medium term (2-4 years) |
| Surge in multi-modal AI diagnostics integrating radiology and pathology | +3.2% | Global, strongest adoption in Asia-Pacific and North America | Short term (≤2 years) |
| Genomic sequencing price drop below USD 100 spurring GPU cloud demand | +2.9% | Global, particularly pronounced in North America and China | Short term (≤2 years) |
| Regulatory fast-tracking of SaMD algorithms in the U.S. and Europe | +2.4% | North America and Europe, with spillover into Asia-Pacific | Medium term (2-4years) |
| Hospital-edge data centers enabling real-time surgical visualization | +1.7% | North America and Europe, emerging in Asia-Pacific tier-1 cities | Long term (≥4 years) |
| Venture capital inflow into generative drug-discovery startups | +1.9% | Global, concentrated in North America and Europe | Short term (≤2 years) |
| Source: Mordor Intelligence | |||
Accelerating Adoption of Foundation-Model Medical Imaging LLMs
Foundation models trained on more than 10 million radiology scans deliver zero-shot performance across CT, MRI and ultrasound. A 2025 Nature Communications study reported radiologist-level sensitivity on 14 chest-pathology classes, but real-time deployment required GPU (Graphics Processing Unit) clusters with at least 640 GB aggregate memory.[1] Hospitals therefore shift budgets toward H100-class accelerators that support mixed-precision inference and micro-second interconnects. The FDA clearance of triage algorithm K243866 validated clinical utility, shortening procurement cycles. However, interpretability challenges and rising liquid-cooling costs constrain adoption among mid-tier facilities.
Surge in Multi-Modal AI Diagnostics Integrating Radiology and Pathology
Oncology programs increasingly fuse MRI volumes with whole-slide pathology images to correlate macro-anatomical and micro-biomarker patterns. A 2024 European deployment reduced biopsy rates by 18% but required a 16-GPU cluster to process 40-gigapixel slides alongside 3D scans. Compliance with the EU AI Act’s transparency mandate favors vendors with ISO 13485 processes.[2] Smaller startups struggle to secure annotated data and meet sub-5-second latency expectations in tumor boards.
Genomic Sequencing Price Drop Below USD 100 Spurring GPU Cloud Demand
Sequencing costs fell to USD 99 per genome in late 2024, doubling global sequencing volumes to an estimated 12 million genomes. Each genome generates 200 GB of raw data, and variant-calling pipelines now rely on GPU-accelerated GATK workflows that must finish within 48 hours. Cloud vendors bundle GPU capacity with optimized bioinformatics stacks, trimming compute costs by 30%. Data-sovereignty rules force labs to retain raw data on-premise, driving hybrid architectures that complicate latency and cost governance.
Regulatory Fast-Tracking of SaMD Algorithms in United States and Europe
The FDA cleared 18 AI-based SaMD algorithms under the 510(k) pathway in 2024 as predetermined change-control plans gained traction.[3] Vendors iterate more quickly, yet post-market surveillance requirements and a 2025 negligence lawsuit underscore liability risks. In Europe, dual compliance with MDR and the AI Act extends technical-file preparation to up to 18 months, offsetting some speed gains but still shortening historical approval cycles.
Restraints Impact Analysis of GPU In Healthcare and Medical Imaging Market*
| Restraint | (~) % Impact on CAGR Forecast | Geographic Relevance | Impact Timeline |
|---|---|---|---|
| Persistent Bottlenecks in Healthcare Data-Labeling Quality | -2.1% | Global, particularly acute in emerging markets | Medium term (2-4 years) |
| High Total Cost of Ownership of On-Premise H100-Class GPU Clusters for Mid-Tier Hospitals | -1.8% | Global, most pronounced in North America and Europe | Short term (≤2 years) |
| Interoperability Gaps Between PACS/RIS and AI Inference Pipelines | -1.3% | Global, with legacy systems prevalent in mature markets | Long term (≥4 years) |
| Rising Scrutiny Over the Carbon Footprint of Large-Scale Model Training | -0.9% | Europe and North America, emerging concern in Asia-Pacific | Medium term (2-4 years) |
| Source: Mordor Intelligence | |||
Persistent Bottlenecks in Healthcare Data Labeling Quality
Radiology departments face a 15,000-radiologist shortfall in the United States, and outsourced labeling shows inter-annotator agreement below regulatory thresholds. Multi-stage review workflows extend project timelines by up to nine months, while active-learning solutions still demand GPU resources, creating a circular dependency for resource-constrained clinics.
High TCO of On-Premise H100-Class GPU Clusters for Mid-Tier Hospitals
A fully configured 8-GPU H100 rack costs up to USD 400,000 and consumes 10.2 kW, translating to USD 89,000 in annual electricity spend. Five-year TCO runs 2.3× higher than equivalent cloud deployments, even before considering cooling retrofits. Hospitals therefore adopt hybrid models, yet dual environments complicate governance and data-residency compliance, especially for sub-200-millisecond surgical-navigation workloads.
*Our forecasts treat driver/restraint impacts as directional, not additive. The impact forecasts reflect baseline growth, mix effects, and variable interactions.
GPU In Healthcare and Medical Imaging Market Segment Analysis
By Application:
Imaging Dominates but Drug Discovery AcceleratesMedical imaging and reconstruction generated 38.22% of 2025 revenue within the GPU in healthcare and medical imaging market size, reaffirming CT reconstruction, MRI denoising and 3D surgical visualization as Graphics Processing Unit-intensive mainstays. AI-based diagnostics broaden the mix as cleared algorithms address diabetic retinopathy, stroke triage and pulmonary embolism. Growing genomics pipelines leverage GPUs for real-time variant calling as sequencing volumes soar. Drug discovery and simulation, though a smaller slice, posts the fastest growth, buoyed by generative models that screen billions of compounds in weeks rather than months.
Early adopters combine 512-GPU clusters with diffusion models to identify lead molecules, compressing traditional 18-month screening windows to just six weeks. Healthcare robotics and surgery remains nascent but demonstrates promise through pilot deployments that use GPU-accelerated vision to guide instruments and classify tissue in vivo. Continued regulatory clarity around autonomy and liability is expected to unlock further uptake after 2028.

By Deployment Model:
Cloud Gains Ground on FlexibilityOn-premise systems delivered 51.45% of 2025 revenue, anchored by legacy PACS integration and stringent latency targets. Nevertheless, cloud-based healthcare AI platforms record the steepest CAGR, as subscription models eliminate capital intensity and provide instant access to foundation models. A 2025 hospital survey indicated 38% had already migrated at least one workload to public cloud resources.
Hybrid strategies dominate among academic medical centers that retain sensitive data locally while bursting to cloud for training. Cloud vendors have countered sovereignty concerns with dedicated healthcare regions and contract-level audit logging, narrowing the trust gap. The Graphics Processing Unit in healthcare and imaging market continues to rebalance as rural hospitals favor managed services, whereas urban tertiary centers maintain edge clusters for time-critical tasks.
By GPU Usage Type:
Inference Overtakes Training in Clinical SettingsInference workloads claimed 45.43% share of the GPU in healthcare and medical imaging market size in 2025, confirming the shift from R&D to production AI. Hospitals now prioritize Graphics Processing Units optimized for low-precision inference, high memory bandwidth and reduced power draw. Training roles persist for fine-tuning foundation models on rare disease datasets and remain critical in pharmaceutical discovery.
Visualization workloads, though smaller, gain prominence as surgical teams demand real-time 3D reconstruction and AR overlays. A 2024 radiology network cut latency by 40% when replacing V100 units with L40S Graphics Processing Units, demonstrating energy and performance advantages. Vendors hence differentiate by balancing inference efficiency with enough FP8 throughput for on-site transfer learning.
By End-User Type:
Pharma and Biotech Surge AheadHospitals and diagnostic centers provided 48.76% of 2025 revenue, fueled by AI triage deployments that alleviate specialist shortages. Pharmaceutical and biotech companies, however, exhibit the highest CAGR, channeling multi-million-dollar venture rounds into generative chemistry clusters. One 2024 startup funded a 2,048-GPU environment to simulate 10 million molecular interactions per day, targeting sub-12-month discovery timelines.
Research institutions serve as innovation pipelines, often co-locating compute with biobanks to minimize data movement. Telemedicine and digital health providers, while the smallest group, scale rapidly in emerging economies as edge Graphics Processing Units enable point-of-care diagnostics. Combined, these end-user dynamics sustain broad demand diversity for the GPU in healthcare and medical imaging market.
Geography Analysis
North America GPU in Healthcare and Medical Imaging Market
North America led the GPU in healthcare market with 40.67% revenue share in 2025, propelled by dense academic-medical ecosystems, venture funding and a streamlined FDA 510(k) process that cleared 18 SaMD algorithms since 2024. U.S. metropolitan centers deploy liquid-cooled H100 clusters for radiology and pathology applications, while Canada invests in cloud-based telemedicine to reach remote communities. Mexico’s private hospital chains adopt AI diagnostics to differentiate offerings, though scale remains modest.
APAC GPU in Healthcare and Medical Imaging Market
Asia-Pacific is the fastest-growing region through 2031. China’s Healthy China 2030 earmarked CNY 50 billion (USD 7 billion) for IT modernization, prioritizing GPU-backed imaging and telehealth. India’s National Digital Health Mission integrates AI triage across a 1.4 billion-person population, demanding regional cloud zones with latency under 150 milliseconds. Japan and South Korea focus on robotics-assisted surgery and precision oncology, leveraging mature reimbursement frameworks. Regulatory heterogeneity persists, yet regional bodies such as the NMPA and CDSCO move toward risk-based SaMD approvals.
EMEA and South America GPU in Healthcare and Medical Imaging Market
Europe holds a moderate share, characterized by stringent MDR and AI Act compliance that lengthens technical-file preparation but improves market trust. Germany, the United Kingdom and France lead adoption via national radiology networks. South America and the Middle East and Africa remain smaller, but pilot programs in Brazil and the United Arab Emirates illustrate growing interest, especially in tuberculosis screening and diabetic retinopathy detection.
Competitive Landscape
The GPU in healthcare and medical imaging market is moderately concentrated. NVIDIA retains the lion’s share through its CUDA software stack and deep integrations with imaging OEMs. AMD and Intel advance alternative ecosystems, yet inertia around CUDA impedes rapid share gains. Cloud hyperscalers compete on GPU-hour pricing and pre-trained model catalogs, offering multi-year discounts that slash total cost by up to 40%.
Medical-device OEMs embed proprietary AI co-processors into scanners, seeking differentiation on reconstruction speed and power efficiency. Cerebras Systems and Graphcore promote wafer-scale and IPU architectures that promise superior performance-per-watt for sparse models, yet limited tooling confines uptake to research centers. Regulatory pedigree emerges as a key differentiator as hospitals favor partners with ISO 13485 credentials and proven post-market surveillance capabilities.
White-space opportunities include battery-powered ultrasound with on-device inference, edge accelerators for low-resource digital pathology and federated-learning platforms that train across hospitals without centralizing patient data. A 2024 patent filing detailed such a federated architecture that could reshape competitive boundaries if commercialized.
Recent Industry Developments in GPU In Healthcare and Medical Imaging Market
- April 2026: NVIDIA released Clara Holoscan 2.0, adding MI300X support for surgical robotics with sub-80-millisecond latency.
- March 2026: Amazon Web Services launched HealthImaging-Edge, a rack-scale GPU appliance that synchronizes with AWS HealthImaging regions for hybrid deployments.
- February 2026: Siemens Healthineers introduced DL-Reconstruct Ultra for CT, halving radiation dose while delivering real-time imaging on embedded GPUs.
- January 2026: Google Cloud opened a HIPAA-accelerated region in Texas featuring H100 clusters dedicated to generative drug-discovery workloads.
Global GPU In Healthcare and Medical Imaging Market Report Scope
The GPU in Healthcare and Medical Imaging Market pertains to the industry segment utilizing Graphics Processing Units (GPUs) to enhance computational efficiency in healthcare applications, with a primary focus on medical imaging, diagnostics, and research.
The GPU in Healthcare and Medical Imaging Market Report is Segmented by Application (Medical Imaging and Reconstruction, AI-Based Diagnostics, Genomics and Bioinformatics, Drug Discovery and Simulation, Healthcare Robotics and Surgery), Deployment Model (On-Premise (Hospitals / Labs), Cloud-Based Healthcare AI Platforms, Hybrid), GPU Usage (Training Workloads, Inference / Clinical Deployment, Visualization / Rendering), End-User Type (Hospitals and Diagnostic Centers, Pharmaceutical and Biotech Companies, Research Institutions, Telemedicine / Digital Health Providers), and Geography (North America, Europe, Asia-Pacific, South America, Middle East and Africa). The Market Forecasts are Provided in Terms of Value (USD).
Segmentation Overview
| Medical Imaging and Reconstruction |
| AI-Based Diagnostics |
| Genomics and Bioinformatics |
| Drug Discovery and Simulation |
| Healthcare Robotics and Surgery |
| On-Premise (Hospitals / Labs) |
| Cloud-Based Healthcare AI Platforms |
| Hybrid |
| Training Workloads |
| Inference / Clinical Deployment |
| Visualization / Rendering |
| Hospitals and Diagnostic Centers |
| Pharmaceutical and Biotech Companies |
| Research Institutions |
| Telemedicine / Digital Health Providers |
| North America | United States |
| Canada | |
| Mexico | |
| Europe | Germany |
| United Kingdom | |
| France | |
| Rest of Europe | |
| Asia-Pacific | China |
| Japan | |
| South Korea | |
| India | |
| Rest of Asia-Pacific | |
| South America | |
| Middle East and Africa |
| By Application | Medical Imaging and Reconstruction | |
| AI-Based Diagnostics | ||
| Genomics and Bioinformatics | ||
| Drug Discovery and Simulation | ||
| Healthcare Robotics and Surgery | ||
| By Deployment Model | On-Premise (Hospitals / Labs) | |
| Cloud-Based Healthcare AI Platforms | ||
| Hybrid | ||
| By GPU Usage Type | Training Workloads | |
| Inference / Clinical Deployment | ||
| Visualization / Rendering | ||
| By End-User Type | Hospitals and Diagnostic Centers | |
| Pharmaceutical and Biotech Companies | ||
| Research Institutions | ||
| Telemedicine / Digital Health Providers | ||
| By Geography | North America | United States |
| Canada | ||
| Mexico | ||
| Europe | Germany | |
| United Kingdom | ||
| France | ||
| Rest of Europe | ||
| Asia-Pacific | China | |
| Japan | ||
| South Korea | ||
| India | ||
| Rest of Asia-Pacific | ||
| South America | ||
| Middle East and Africa | ||
Key Questions Answered in the Report
What is the current GPU in healthcare and medical imaging market size?
The GPU in healthcare and medical imaging market reached USD 2.84 billion in 2025 and is projected to continue expanding through 2031.
How fast is the market growing between 2026 and 2031?
Market is estimated at a CAGR of 15.19% for the GPU in healthcare and medical imaging market during 2026-2031, driven by demand from medical imaging AI, genomics, and drug-discovery workloads.
Which application will post the strongest growth through 2031?
Drug discovery and simulation is expected to grow the fastest as generative chemistry and molecular simulation platforms scale GPU clusters to shorten preclinical timelines.
Why are mid-tier hospitals shifting to cloud GPUs?
Cloud GPU services reduce upfront capital expenditure, include regulatory documentation, and provide elastic compute capacity, helping hospitals avoid USD 320,000-400,000 hardware investments.
Which region is set to be the fastest growing?
Asia-Pacific is expected to lead growth, supported by health digitization programs in China and India and rising adoption of AI-enabled telemedicine platforms.
What is the main technical bottleneck holding back wider adoption?
High-quality data labeling remains the key bottleneck, as inconsistent annotations can extend dataset preparation by up to nine months and negatively affect model accuracy.