Scientific Computing GPU Market Size and Share
Market Overview
| Study Period | 2020 - 2031 |
|---|---|
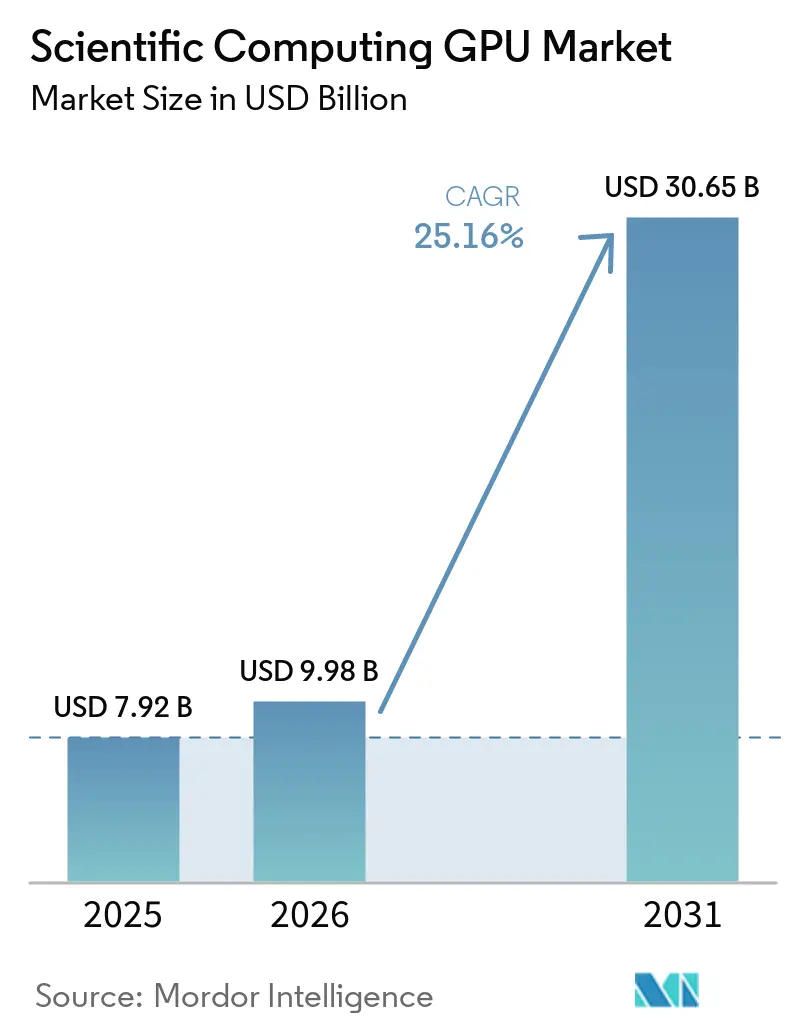
| Market Size (2026) | USD 9.98 Billion |
| Market Size (2031) | USD 30.65 Billion |
| Growth Rate (2026 - 2031) | 25.16% CAGR |
| Fastest Growing Market | Asia-Pacific |
| Largest Market | North America |
| Market Concentration | High |
Major Players *Disclaimer: Major Players sorted in no particular order Image © Mordor Intelligence. Reuse requires attribution under CC BY 4.0. | |
Scientific Computing GPU Market Analysis by Mordor Intelligence
The scientific computing GPU market size was valued at USD 7.92 billion in 2025 and estimated to grow from USD 9.98 billion in 2026 to reach USD 30.65 billion by 2031, at a CAGR of 25.16% during the forecast period (2026-2031). Demand is rising because national laboratories, pharmaceutical companies, and defense research groups now treat GPU capacity as core research infrastructure instead of a periodic hardware upgrade. The market is also changing because simulation and AI workloads increasingly run on the same systems, which pushes buyers toward platforms that can support both high-precision modeling and large-scale AI work. Faster product cycles are shortening refresh plans from the older three-to-five-year pattern, so institutions are reworking procurement, power, and cooling strategies more often than before. Cloud access is expanding the buyer base, especially for universities and smaller research centers that cannot fund the latest systems on-site. Competition is tightening across processor performance, software ecosystems, and energy efficiency, creating room for niche accelerator suppliers even as the leading processor vendors remain dominant.
Key Report Takeaways
- By GPU architecture and form factor, Discrete Data Center and HPC GPUs held 87.32% of the scientific computing GPU market share in 2025, while GPU-Based Heterogeneous Accelerators are projected to expand at a 25.96% CAGR through 2031.
- By deployment mode, On-Premises HPC and Research Infrastructure held 46.89% share in 2025, while Public Cloud is projected to advance at a 26.13% CAGR through 2031.
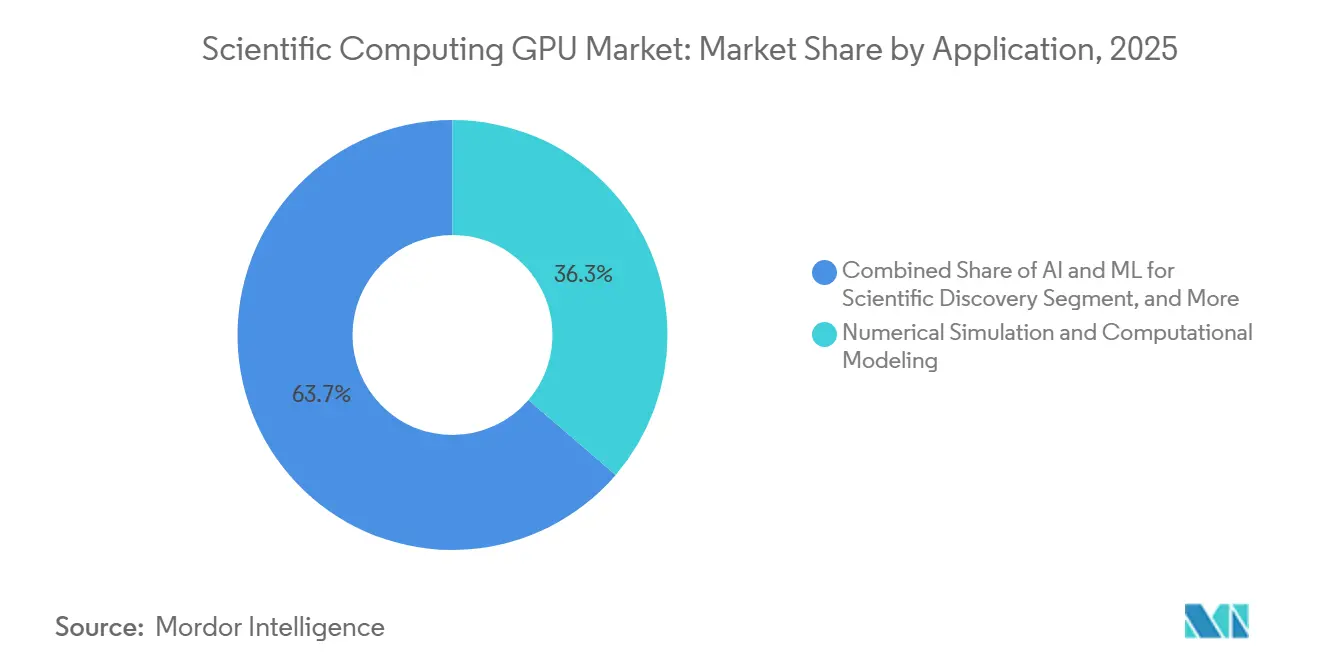
- By application, Numerical Simulation and Computational Modeling accounted for 36.28% share of the scientific computing graphics processing unit (GPU) market size in 2025, while AI and Machine Learning for Scientific Discovery is projected to grow at a 26.34% CAGR through 2031.
- By end-user, Research Institutions and Academia held 26.74% share in 2025, while Healthcare, Pharmaceutical, and Life Sciences are projected to expand at a 26.71% CAGR through 2031.
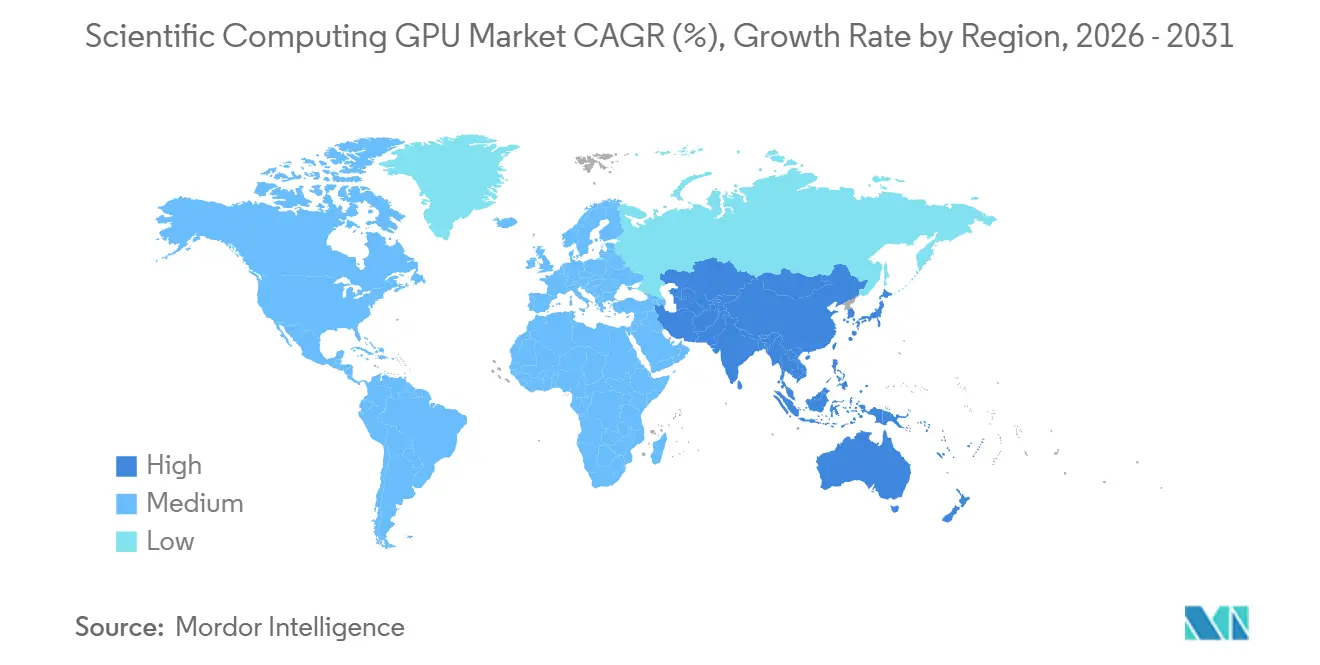
- By geography, North America held 48.23% share in 2025, while Asia-Pacific is projected to record the highest CAGR at 26.09% through 2031.
Note: Market size and forecast figures in this report are generated using Mordor Intelligence’s proprietary estimation framework, updated with the latest available data and insights as of January 2026.
Global Scientific Computing GPU Market Trends and Insights
Driver Impact Analysis*
| Driver | (~) % Impact on CAGR Forecast | Geographic Relevance | Impact Timeline |
|---|---|---|---|
| Rising Demand for GPU-Accelerated Scientific Simulation | +6.5% | Global, highest intensity in North America and Europe | Short term (≤ 2 years) |
| Growth in AI-Driven Research Workloads | +5.8% | Global, fastest adoption in North America and Asia-Pacific | Short term (≤ 2 years) |
| Expanding Use of Cloud-Based GPU Access for Research Institutions | +4.2% | Global, significant in Europe, South Asia, and Southeast Asia | Medium term (2-4 years) |
| Increasing Adoption of Multi-GPU and Heterogeneous Compute Clusters | +3.4% | North America, Europe, Japan, South Korea | Medium term (2-4 years) |
| Export-Control-Led Reconfiguration of High-End Compute Supply Chains | +2.1% | Asia-Pacific core, with spillover to Southeast Asia and the Middle East and Africa | Medium term (2-4 years) |
| Power-Efficiency Pressure in National Supercomputing Programs | +1.8% | Europe and Japan, with early gains in North America | Long term (≥ 4 years) |
| Source: Mordor Intelligence | |||
Rising Demand for GPU-Accelerated Scientific Simulation
GPU-accelerated simulation remains the main engine of demand in the scientific computing GPU market because large research programs still depend on high-precision modeling in fusion, materials, energy, and quantum work. The US Department of Energy announced more than USD 1 billion in public-private investment for the Lux and Discovery systems at Oak Ridge National Laboratory, underscoring how national programs are anchoring large purchase cycles.[1]U.S. Department of Energy, “Energy Department Announces New Public-Private Partnership Model, Two Supercomputers, to Accelerate American Dominance in Science and Technology,” U.S. Department of Energy, energy.gov Research from Lawrence Livermore National Laboratory and collaborators showed that GB200 and GH200 GPUs delivered up to 59% performance gains on key finite element kernels and reduced energy use by up to 83%, strengthening the case for faster upgrades in the scientific computing GPU market. These gains matter because shorter run times let institutions move more models into production use instead of reserving GPUs for only the largest jobs. Buyers, therefore, want a single system that can support both double-precision simulation and AI-assisted modeling, which is changing how the scientific computing GPU market is specified in new procurements.
Growth in AI-Driven Research Workloads
AI-heavy research workloads are growing faster than simulation-only jobs inside the scientific computing GPU market, so buyers are now weighing AI throughput alongside FP64 performance. RIKEN deployed 1,600 NVIDIA Blackwell GPUs for AI-for-science applications spanning drug discovery, materials science, and climate modeling, which shows how national labs are building combined AI and HPC capacity. A September 2025 study in Nature Methods found that GPU-accelerated protein homology search reduced processing time by 6x compared to CPU systems while maintaining agreement with established benchmarks. NVIDIA launched the BioNeMo Agent Toolkit in 2026, and the platform is integrated into the workflows of Dassault Systèmes, Cadence, and Schrödinger for drug discovery. As AI moves into the research loop rather than remaining at the analysis stage, the scientific computing graphics processing unit (GPU) market is shifting toward platforms that can run simulation, training, and inference on the same fabric.
Expanding Use of Cloud-Based GPU Access for Research Institutions
Cloud access is broadening the customer base in the scientific computing GPU market because many universities and smaller research centers cannot keep pace with each hardware cycle on-site. AWS cut H100 instance pricing by 44% in June 2025 and, in June 2026, added P6e-GB200 and P6e-GB300 UltraServer support within its Parallel Computing Service, which made large managed clusters more reachable for research users. NVIDIA said AWS, Google Cloud, Microsoft Azure, and Oracle Cloud Infrastructure will be among the first providers to offer Vera Rubin-based instances in the second half of 2026. A 2026 cloud HPC evaluation found that major cloud platforms now deliver competitive performance across a growing set of scientific workloads, supporting more routine use of off-site GPU capacity. This is pushing the scientific computing GPU market toward a hybrid buying pattern, where institutions keep critical work on-site and use cloud capacity for overflow, pilot studies, and time-sensitive campaigns.
Increasing Adoption of Multi-GPU and Heterogeneous Compute Clusters
Multi-GPU and heterogeneous clusters are becoming more common in the scientific computing GPU market, as many research sites now want a single environment for simulation, AI training, and inference. NVIDIA reported 35 new AI and HPC supercomputers in development across Europe at ISC High Performance 2026, with many designs centered on NVLink-connected multi-GPU nodes. RIKEN, Fujitsu, and NVIDIA are co-designing FugakuNEXT around a Fujitsu MONAKA-X CPU and NVIDIA GPU combination that aims to deliver more than 5x the performance of Fugaku. These designs matter because coherent CPU-GPU memory and workload-aware scheduling help facilities use expensive hardware more efficiently across a mix of job types. As this model spreads, the scientific computing GPU market is rewarding vendors that combine processors, interconnect, and systems software in a more integrated offer.
Restraint Impact Analysis*
| Restraint | (~) % Impact on CAGR Forecast | Geographic Relevance | Impact Timeline |
|---|---|---|---|
| High Upfront Cost of Scientific Computing GPU Infrastructure | -4.2% | Global, most acute in South America, the Middle East and Africa, and smaller European institutions | Medium term (2-4 years) |
| Advanced Packaging and HBM Supply Concentration | -3.1% | Global, most visible in North America and Asia-Pacific buyer markets | Short term (≤ 2 years) |
| Cooling, Power Delivery, and Rack Density Constraints | -2.4% | North America, Europe, Asia-Pacific, and legacy facilities globally | Medium term (2-4 years) |
| Software Portability and Kernel Optimization Friction Across GPU Architectures | -1.8% | Global, most acute where multi-vendor GPU procurement is standard | Long term (≥ 4 years) |
| Source: Mordor Intelligence | |||
High Upfront Cost of Scientific Computing GPU Infrastructure
High upfront cost still limits adoption in the scientific computing GPU market, especially outside national labs, top pharmaceutical companies, and the largest research universities. Supermicro said a Vera Rubin NVL4 rack-scale unit uses 1,152 GPUs and is rated at 362 kW, which shows that power and cooling upgrades are often as important as the chips themselves.[2]Super Micro Computer, Inc., “Supermicro Delivers NVIDIA Vera Rubin NVL4 End-to-End DCBBS Blueprint with Native FP64 Performance,” Supermicro, supermicro.com Smaller institutions in South America, the Middle East, Africa, and parts of Europe often lack the budget or facility headroom for this level of density, which slows direct participation in the scientific computing GPU market. Public-private programs such as the US Department of Energy's Lux and Discovery projects are easing this barrier for some buyers, but these models remain concentrated in a limited number of countries. Until similar financing structures spread more widely, growth will continue to favor institutions that can fund both compute hardware and the supporting facility rebuild.
Advanced Packaging and HBM Supply Concentration
Supply constraints in HBM and advanced packaging are constraining the scientific computing GPU market because a small supplier base controls the memory stacks and assembly steps required for top-end accelerators. In April 2026, SK Hynix said demand over the next 3 years exceeded its production capacity and that 2026 output was already allocated to priority customers. Samsung began commercial HBM4 shipments in February 2026, following earlier qualification delays, underscoring how supplier execution can shift delivery timing by multiple quarters. As memory and packaging supply tighten, research buyers face longer lead times, higher procurement premiums, and greater planning risk for multi-year facility programs in the scientific computing GPU market. This bottleneck does not change long-term demand, but it can delay deployments enough to push institutions toward staggered rollouts or interim cloud contracts.
*Our forecasts treat driver/restraint impacts as directional, not additive. The impact forecasts reflect baseline growth, mix effects, and variable interactions.
Segment Analysis
By GPU Architecture and Form Factor: Discrete Hardware Leads, Heterogeneous Designs Gain Momentum
Discrete Data Center and HPC GPUs held 87.32% of the scientific computing GPU market share in 2025, which kept this category at the center of production research deployments. This position reflects the large installed base of NVIDIA H100, GH200, and GB200 systems, as well as AMD MI300X and MI355X platforms already embedded in global HPC sites. The scientific computing GPU market still favors this class because most simulation codes have been tuned for discrete-accelerator environments for many years, making migration slow and expensive for institutions with deep software portfolios. That installed base effect is reinforced by mature programming stacks, where vendor software environments continue to anchor workflow stability for major research users.
GPU-Based Heterogeneous Accelerators are projected to grow at a 25.96% CAGR through 2031, which makes them the most dynamic architecture segment in the scientific computing GPU market. EuroHPC's Alice Recoque system, contracted in November 2025, specified AMD MI430X GPUs, AMD Venice processors, and SiPearl Rhea2 processors in a coherent-memory design, demonstrating that mixed architectures are becoming a baseline requirement in flagship systems. The smaller, integrated, and specialized accelerator segments remain relevant when edge instruments, low-latency inference, or unusual dataflow patterns make standard racks less efficient, and Sandia-backed research on the Cerebras Wafer-Scale Engine showed a 179-fold improvement in molecular dynamics timesteps per second compared with the Frontier platform for a targeted workload. This is widening the scientific computing GPU market from a single-architecture purchase decision into a portfolio approach, where facilities combine discrete GPUs with niche accelerators for specific tasks.


By Deployment Mode: On-Premises Systems Lead, Cloud Access Expands Faster
On-Premises HPC and Research Infrastructure held a 46.89% share in 2025, indicating that direct control over systems, data, and interconnect design still matters in the scientific computing GPU market. National laboratories, government research centers, and major universities continue to prefer dedicated hardware because they run predictable workloads and often handle restricted or sensitive data. The scientific computing GPU market still leans toward on-site systems where customized networking, security rules, and workload tuning go beyond standard cloud templates. At the same time, next-generation rack densities are making it harder for older university facilities to host the newest platforms, which is raising interest in hosted and colocation models.
Public Cloud is projected to expand at a 26.13% CAGR through 2031, the fastest pace across deployment modes in the scientific computing GPU market. AWS added support for P6e-GB200 and P6e-GB300 UltraServer models in June 2026, giving research users access to up to 72 NVIDIA Blackwell GPUs in a single NVLink domain via a managed service. NVIDIA also said major cloud providers will be among the first to deploy Vera Rubin-based instances in the second half of 2026, which extends advanced capacity to institutions that cannot buy the newest systems outright. Hybrid and multi-cloud use is therefore becoming a practical risk-control model, with buyers splitting workloads between internal clusters and outside capacity to reduce delays and keep projects moving.
By Application: Simulation Holds The Largest Base, AI For Science Grows The Fastest
Numerical Simulation and Computational Modeling accounted for 36.28% of the scientific computing GPU market in 2025, keeping simulation at the core of current demand. Climate models, molecular dynamics, computational fluid dynamics, finite element analysis, and quantum chemistry continue to consume a large share of installed GPU time across the scientific computing GPU market. This leadership persists because many institutions spent years porting major codes to accelerator environments and are now using those assets more intensively rather than starting over with new hardware models. DOE-backed work on FP64 tensor cores achieved up to 59% performance gains on key finite element kernels, supporting the ongoing value of simulation-heavy procurement.
AI and Machine Learning for Scientific Discovery is projected to grow at a 26.34% CAGR through 2031, making it the fastest-moving application area in the scientific computing graphics processing unit (GPU) market. A 2026 study in Frontiers in High-Performance Computing showed that AI surrogate models for numerical simulations can scale well on HPC platforms when scheduling overlaps, data movement, and GPU computation. In the life sciences, Nature Methods reported that GPU-accelerated protein homology search reduced processing time by 6x compared with CPU systems, supporting broader use of AI-driven methods in research workflows. As a result, buyers increasingly judge the scientific computing GPU market by discovery speed and workflow flexibility rather than by raw floating-point output alone.
By End-User: Academia Leads In Share, Life Sciences Moves Ahead In Growth
Research Institutions and Academia held a 26.74% share in 2025, making them the largest end-user group in the scientific computing GPU market. This base is supported by a wide network of university HPC centers and national research computing programs that spread demand across many countries. Government laboratories remain a second pillar, and the Solstice program at Argonne National Laboratory will bring 100,000 NVIDIA Blackwell GPUs into a DOE-backed environment for open science across energy, science, and security. That kind of sovereign investment keeps the scientific computing GPU market anchored in public research even as private-sector demand rises.
Healthcare, Pharmaceutical, and Life Sciences is projected to grow at a 26.71% CAGR through 2031, which makes it the fastest-growing end-user segment in the scientific computing GPU market. Eli Lilly launched LillyPod in February 2026, featuring 1,016 NVIDIA Blackwell Ultra GPUs and more than 9,000 petaflops of AI performance for genomics and drug discovery. Roche expanded to more than 3,500 NVIDIA Blackwell GPUs across hybrid cloud and on-premises environments in March 2026 for biological foundation models, drug discovery, and manufacturing digital twins. This broadening customer mix is making the scientific computing GPU market less dependent on public procurement cycles alone, even though large national programs still set the pace for the highest-end systems
Geography Analysis
North America held 48.23% of the scientific computing GPU market share in 2025, maintaining the region's clear lead. US Department of Energy procurements at Argonne and Oak Ridge created a large public-sector demand anchor through Solstice, Lux, and Discovery. Pharmaceutical investment added a second stream, with Eli Lilly and Roche both scaling sizable GPU programs in early 2026. This combination of federal science spending, university research capacity, and commercial drug development keeps North America at the center of the scientific computing GPU market.[3]NVIDIA Corporation, “NVIDIA and Oracle to Build U.S. Department of Energy’s Largest AI Supercomputer for Scientific Discovery,” NVIDIA Investor Relations, investor.nvidia.com
Europe remained the second-largest region in 2025, and the scientific computing GPU market there is being shaped by coordinated procurement under the EuroHPC Joint Undertaking. JUPITER, equipped with around 24,000 NVIDIA GH200 Grace Hopper Superchips, ranked 4th on the June 2025 TOP500 list and became Europe's first exascale-class system. The Alice Recoque contract added a second major step by combining AMD GPUs with SiPearl processors, reflecting Europe's effort to broaden supply options while maintaining strong local system participation. Funding commitments, such as the UK's GBP 750 million (USD 945 million) investment in a national supercomputer and the SEANERGYS program, show that performance and energy efficiency are advancing together in regional planning.
Asia-Pacific is projected to expand at a 26.09% CAGR through 2031, making it the fastest-growing regional block in the scientific computing GPU market. Japan is driving this growth through RIKEN's deployment of 2,140 NVIDIA Blackwell GPUs across new AI-for-science and quantum systems, while FugakuNEXT remains under joint design for a later step-change in performance. China is following a different path under export controls, and the National Supercomputing Center in Shenzhen announced the 2 exaflops LineShine system built on domestic Huawei LX2 processors without GPU accelerators. These approaches show that the scientific computing graphics processing unit (GPU) market in Asia-Pacific is splitting between open global procurement, as seen in Japan, and sovereign substitution programs, as seen in China. South America, the Middle East, and Africa, and smaller Asia-Pacific markets, remain more dependent on cloud access than on local exascale infrastructure, which keeps adoption moving but at a different scale than in the leading regions.

Competitive Landscape
The scientific computing GPU market remains concentrated at the processor layer, with NVIDIA and AMD supplying most discrete HPC GPU deployments in active scientific facilities. NVIDIA holds an advantage through a broad software stack that includes CUDA, CUDA-X libraries, BioNeMo for life sciences, and DAQIRI for instrument-level AI, making its hardware harder to replace in established workflows. AMD is challenging by focusing on native FP64 performance, and the Instinct MI430X previewed in 2026 is designated for Alice Recoque in Europe and Discovery at Oak Ridge.[4]Advanced Micro Devices, Inc., “AMD Sets New Bar for HPC with AMD Instinct MI430X GPU FP64 Performance,” AMD, amd.com That two-vendor structure means the scientific computing GPU market remains concentrated, even as buyer interest in alternatives continues to grow.
The scientific computing GPU market is also expanding around a smaller group of specialized accelerator vendors that target inference-heavy or highly specific scientific workloads. SambaNova announced the SN50 Reconfigurable Dataflow Unit, a multi-year collaboration with Intel, and more than USD 350 million in funding in February 2026, which positions it around AI-native inference rather than broad simulation. d-Matrix moved its Corsair inference platform into full production in June 2026, focusing on low-latency, energy-efficient workloads for which standard GPU racks are oversized. Cerebras continues to attract attention in targeted research settings after Sandia-backed work demonstrated strong gains in molecular dynamics on its wafer-scale system. These niche players do not yet change the processor hierarchy, but they are widening the scientific computing GPU market in the layers where latency, memory flow, or power use matter more than general-purpose scale.
A third competitive layer is forming around system integration, cloud delivery, and orchestration, because buyers now need complete environments rather than chips alone in the scientific computing GPU market. Major cloud providers are preparing Vera Rubin-based instances, which lets them compete for institutions that want fast access without a full facility build. European system builders such as Eviden and processor firms such as SiPearl are also gaining strategic weight through large public procurements that link hardware choice with sovereignty goals. Overall, the scientific computing GPU market rewards vendors that can combine processor performance, software readiness, supply reliability, and deployment support into a single offer.
Scientific Computing GPU Industry Leaders
NVIDIA Corporation
Advanced Micro Devices, Inc.
Intel Corporation
Qualcomm Incorporated
Imagination Technologies Limited
- *Disclaimer: Major Players sorted in no particular order

Recent Industry Developments
- June 2026: NVIDIA announced the Vera Rubin platform for science at ISC High Performance 2026. Commitments include NERSC's Doudna system at Lawrence Berkeley National Laboratory, combining 5 petaflops of native FP64 performance and over 7 exaflops of AI performance in direct-liquid-cooled racks of up to 144 GPUs. Deployment Laboratory, Leibniz Supercomputing Center's Blue Lion supercomputer, expected online in 2027, and Los Alamos National Laboratory's Mission, Vision, and Veritas systems, collectively defining the next generation of US and European national HPC infrastructure.
- June 2026: AMD previewed the Instinct MI430X GPU at the HPC User Forum in Austin, Texas, projecting over 200 TFLOPs of native FP64 performance, more than 6x the FP64 throughput of the next-generation NVIDIA Rubin architecture. The MI430X is designated for the Alice Recoque European exascale system, operated by GENCI and CEA, and the DOE's Discovery supercomputer at Oak Ridge National Laboratory, planned for 2028.
- June 2026: NVIDIA announced 35 new AI and HPC supercomputers in development across Europe, including IT4LIA with over 8,000 GPUs and HLRS's HammerHAI with over 850 GPUs, both via NVIDIA GB200 NVL4 systems, equipping more than 3 million European researchers with next-generation scientific compute infrastructure.
- June 2026: AWS announced that its Parallel Computing Service now supports P6e-GB200 and P6e-GB300 UltraServer instances, enabling research customers to run large-scale GPU workloads using NVIDIA Blackwell architecture within Slurm-managed clusters, providing up to 72 NVIDIA Blackwell GPUs within a single NVLink domain and up to 13.4 TB of total HBM3e.


Global Scientific Computing GPU Market Report Scope
The Scientific Computing GPU Market comprises graphics processing units (GPUs), associated software platforms, and supporting infrastructure deployed to accelerate computationally intensive scientific, engineering, and research workloads. Scientific computing GPUs provide parallel processing capabilities that significantly enhance the speed, efficiency, and scalability of complex computations, enabling researchers and organizations to perform large-scale simulations, data analysis, artificial intelligence (AI) model development, visualization, and advanced scientific discovery across diverse disciplines.
The Scientific Computing GPU Market Report is Segmented by GPU Architecture/Form Factor (Discrete Data Center and HPC GPUs, Integrated and SoC GPUs, GPU-Based Heterogeneous Accelerators, and Other Specialized Scientific Computing GPUs), Deployment Mode (On-Premises HPC and Research Infrastructure, Hosted / Colocation HPC Infrastructure, Edge and On-Instrument Deployment, and Hybrid and Multi-Cloud Deployment), Application (Numerical Simulation and Computational Modeling, AI and Machine Learning for Scientific Discovery, High-Performance Data Analytics and Scientific Visualization, Life Sciences and Bioinformatics Computing, Quantum Simulation and Advanced Physics Research, and Other Scientific Computing Applications), End-User (Research Institutions and Academia, Government Laboratories and National Research Centers, Defense, Aerospace, and Space Organizations, Healthcare, Pharmaceutical, and Life Sciences, Manufacturing and Industrial R&D, Information Technology, Cloud Service Providers, and Telecommunications, Financial Services and Quantitative Research, and Other End-Users), and Geography (North America, Europe, Asia-Pacific, South America, and Middle East and Africa). The Market Forecasts are Provided in Terms of Value (USD).
| Discrete Data Center and HPC GPUs |
| Integrated and SoC GPUs |
| GPU-Based Heterogeneous Accelerators |
| Other Specialized Scientific Computing GPUs |
| On-Premises HPC and Research Infrastructure |
| Public Cloud |
| Hosted / Colocation HPC Infrastructure |
| Edge and On-Instrument Deployment |
| Hybrid and Multi-Cloud Deployment |
| Numerical Simulation and Computational Modeling |
| AI and Machine Learning for Scientific Discovery |
| High-Performance Data Analytics and Scientific Visualization |
| Life Sciences and Bioinformatics Computing |
| Quantum Simulation and Advanced Physics Research |
| Other Scientific Computing Applications |
| Research Institutions and Academia |
| Government Laboratories and National Research Centers |
| Defense, Aerospace, and Space Organizations |
| Healthcare, Pharmaceutical, and Life Sciences |
| Manufacturing and Industrial R&D |
| Information Technology, Cloud Service Providers, and Telecommunications |
| Financial Services and Quantitative Research |
| Other End-Users |
| North America | United States |
| Canada | |
| Mexico | |
| Europe | Germany |
| United Kingdom | |
| France | |
| Italy | |
| Rest of Europe | |
| Asia-Pacific | China |
| Japan | |
| South Korea | |
| India | |
| Southeast Asia | |
| Rest of Asia-Pacific | |
| South America | |
| Middle East and Africa |
| By GPU Architecture / Form Factor | Discrete Data Center and HPC GPUs | |
| Integrated and SoC GPUs | ||
| GPU-Based Heterogeneous Accelerators | ||
| Other Specialized Scientific Computing GPUs | ||
| By Deployment Mode | On-Premises HPC and Research Infrastructure | |
| Public Cloud | ||
| Hosted / Colocation HPC Infrastructure | ||
| Edge and On-Instrument Deployment | ||
| Hybrid and Multi-Cloud Deployment | ||
| By Application | Numerical Simulation and Computational Modeling | |
| AI and Machine Learning for Scientific Discovery | ||
| High-Performance Data Analytics and Scientific Visualization | ||
| Life Sciences and Bioinformatics Computing | ||
| Quantum Simulation and Advanced Physics Research | ||
| Other Scientific Computing Applications | ||
| By End-User | Research Institutions and Academia | |
| Government Laboratories and National Research Centers | ||
| Defense, Aerospace, and Space Organizations | ||
| Healthcare, Pharmaceutical, and Life Sciences | ||
| Manufacturing and Industrial R&D | ||
| Information Technology, Cloud Service Providers, and Telecommunications | ||
| Financial Services and Quantitative Research | ||
| Other End-Users | ||
| By Geography | North America | United States |
| Canada | ||
| Mexico | ||
| Europe | Germany | |
| United Kingdom | ||
| France | ||
| Italy | ||
| Rest of Europe | ||
| Asia-Pacific | China | |
| Japan | ||
| South Korea | ||
| India | ||
| Southeast Asia | ||
| Rest of Asia-Pacific | ||
| South America | ||
| Middle East and Africa | ||


Key Questions Answered in the Report
What is the size of the scientific computing GPU market in 2026?
The scientific computing GPU market is estimated at USD 9.98 billion in 2026 and is forecast to reach USD 30.65 billion by 2031 at a 25.16% CAGR.
Which application area currently leads demand for scientific computing GPUs?
Numerical Simulation and Computational Modeling led demand with a 36.28% share in 2025, supported by heavy use in climate modeling, molecular dynamics, and finite element analysis.
Which application is expanding the fastest through 2031?
AI and Machine Learning for Scientific Discovery is projected to grow at a 26.34% CAGR through 2031 as research groups use AI inside the core discovery workflow.
Why does North America lead global demand?
North America held 48.23% share in 2025 because US national lab procurement, university research capacity, and large pharmaceutical GPU investments all scaled at the same time.
What is driving faster cloud adoption for research users?
Cloud growth is being supported by lower access costs, managed HPC services, and new Blackwell-based instances that help institutions run advanced workloads without building new facilities.
Which end-user group is growing the fastest?
Healthcare, Pharmaceutical, and Life Sciences is projected to expand at a 26.71% CAGR through 2031 as companies build internal GPU environments for drug discovery, genomics, and digital twin work.
Page last updated on:


