United States Discrete GPU Market Size and Share
Market Overview
| Study Period | 2021 - 2031 |
|---|---|
| Forecast Data Period | 2026 - 2031 |
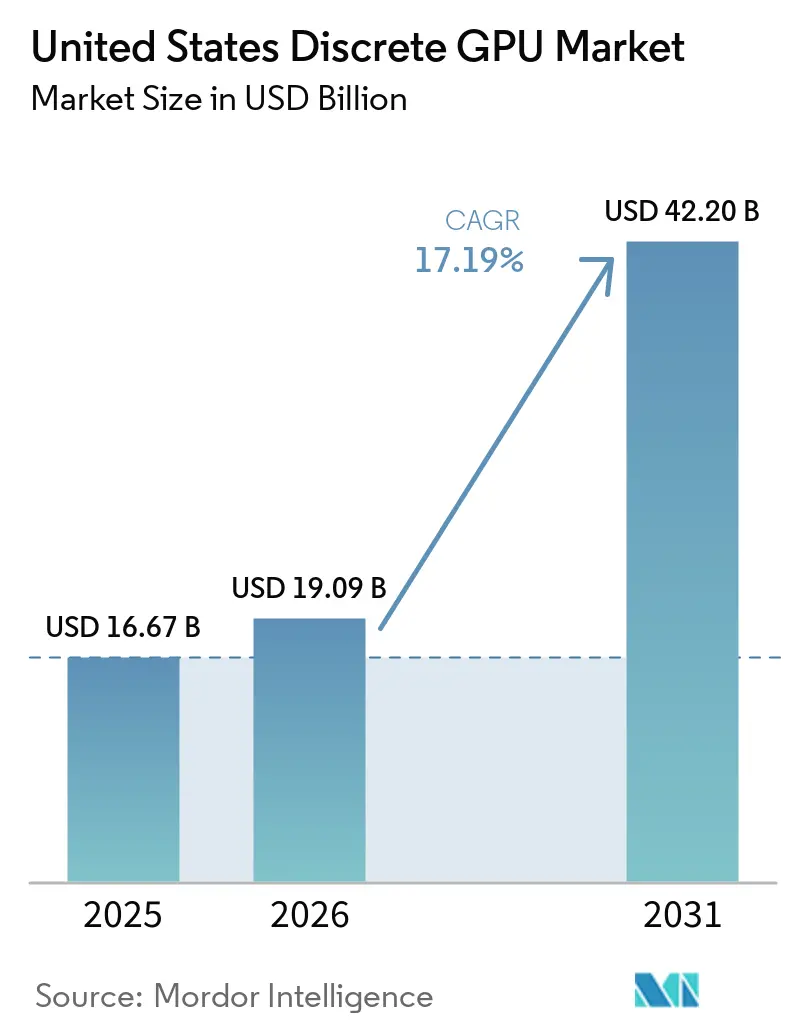
| Base Year Market Size (2025) | USD 16.67 Billion |
| Market Size (2026) | USD 19.09 Billion |
| Market Size (2031) | USD 42.20 Billion |
| Growth Rate (2026 - 2031) | 17.19% CAGR |
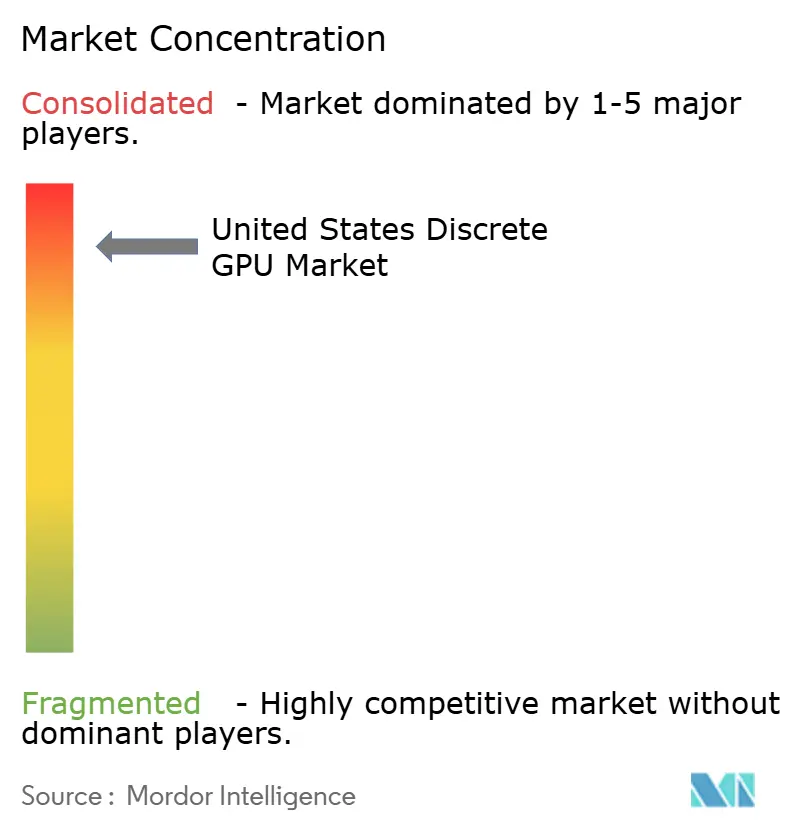
| Market Concentration | High |
Major Players *Disclaimer: Major Players sorted in no particular order Image © Mordor Intelligence. Reuse requires attribution under CC BY 4.0. | |
United States Discrete GPU Market Analysis by Mordor Intelligence
The United States discrete GPU market size was valued at USD 16.67 billion in 2025 and estimated to grow from USD 19.09 billion in 2026 to reach USD 42.20 billion by 2031, at a CAGR of 17.19% during the forecast period (2026-2031). Robust demand from hyperscale data centers, fresh domestic manufacturing incentives, and accelerating adoption of AI-optimized accelerators underpin this surge. Hyperscalers now purchase more than two in every five discrete GPUs shipped domestically, a structural break from the gamer-centric cycle that defined the pre-2024 era. Capital commitments announced through 2026 show sustained procurement pipelines extending well beyond node transitions, signaling secular rather than cyclical momentum. Simultaneously, the CHIPS and Science Act is redirecting a portion of capacity onshore, tightening supply for foreign customers and locking future volume to U.S. buyers.
Key Report Takeaways
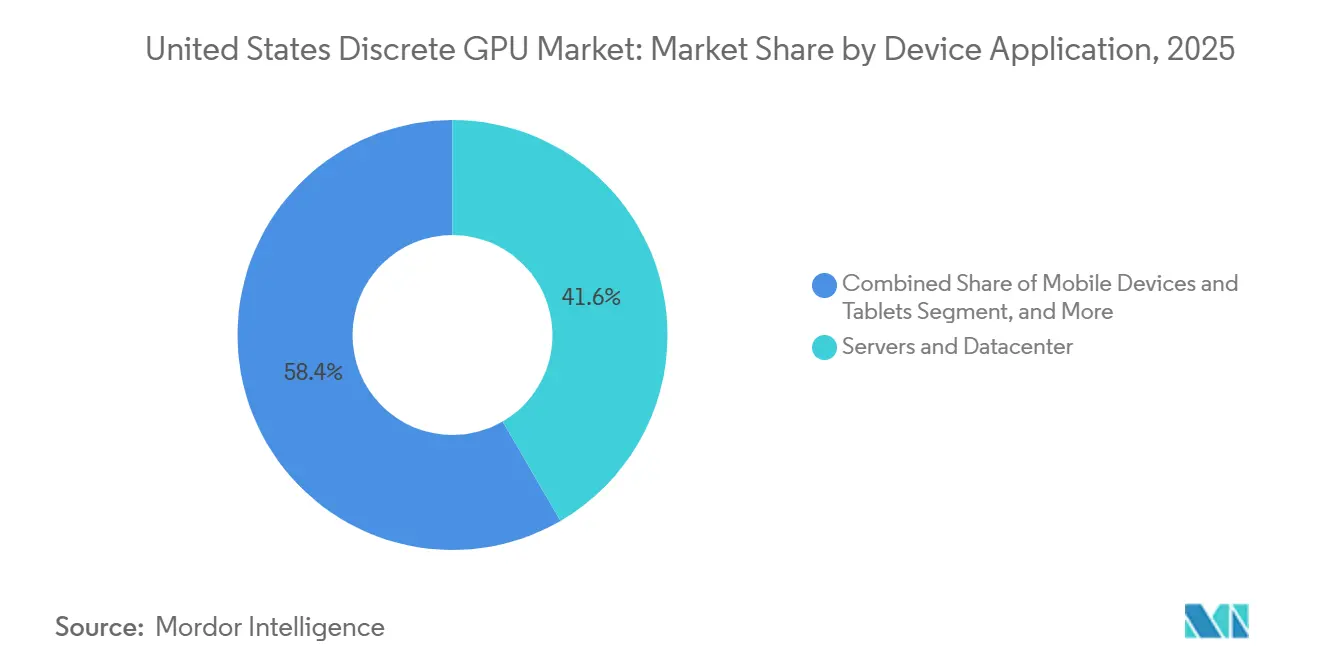
- By device application, servers and datacenter accelerators led with 41.62% revenue share in 2025, while the segment is projected to advance at a 17.95% CAGR between 2026 and 2031.
- By memory type, GDDR-based products held 69.47% of the United States discrete GPU market share in 2025; HBM devices are set to expand at a 17.85% CAGR through 2031.
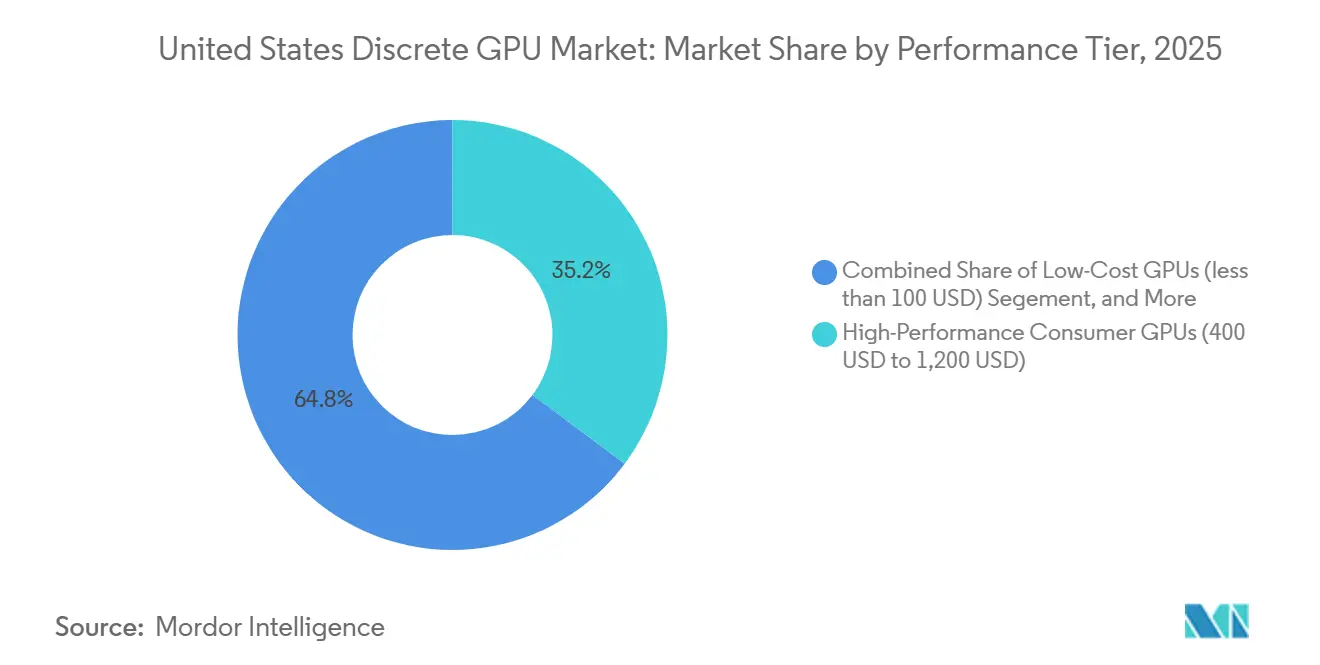
- By performance tier, high-performance consumer GPUs commanded 35.22% share of the United States discrete GPU market size in 2025, whereas accelerators priced above USD 1,200 are on track for a 17.81% CAGR over 2026-2031.
Note: Market size and forecast figures in this report are generated using Mordor Intelligence’s proprietary estimation framework, updated with the latest available data and insights as of January 2026.
United States Discrete GPU Market Trends and Insights
Drivers Impact Analysis*
| Driver | (~) % Impact on CAGR Forecast | Geographic Relevance | Impact Timeline |
|---|---|---|---|
| Proliferation of AI and Machine Learning Workloads in Data Centers | +6.2% | National, concentrated in Northern Virginia, Silicon Valley, Dallas-Fort Worth | Medium term (2-4 years) |
| CHIPS Act Subsidies Stimulating Domestic GPU Production | +3.8% | National, with early gains in Arizona, Ohio, New York | Long term (≥ 4 years) |
| Expansion of Cloud Gaming Infrastructure Across the United States | +2.1% | National, urban centers with fiber penetration above 80% | Short term (≤ 2 years) |
| Rise in High-Resolution Gaming and Esports Monitor Adoption | +1.9% | National, youth demographics in metropolitan areas | Short term (≤ 2 years) |
| Accelerated Content Creation Demands in Media and Entertainment Workflows | +1.7% | National, concentrated in Los Angeles, New York, Atlanta | Medium term (2-4 years) |
| Automotive OEM Adoption of Discrete GPUs for Advanced Driver-Assistance Systems | +1.5% | National, Detroit and Silicon Valley automotive clusters | Long term (≥ 4 years) |
| Source: Mordor Intelligence | |||
Proliferation Of AI And Machine Learning Workloads In Data Centers
Hyperscalers have moved from episodic refresh cycles to continuous fleet expansion, driven by large-language-model inference that demands sustained compute availability. OpenAI signed a multi-year contract for AMD Instinct MI400 accelerators equal to 6 GW of datacenter capacity, while Meta committed to a matching 6 gigawatts in early 2026.[1]AMD Inc., “AMD and Meta Expand AI Partnership,” amd.com Despite record construction, only 23% of planned U.S. data-center capacity through 2026 has secured firm utility interconnects, tilting procurement criteria toward performance-per-watt. NVIDIA’s Rubin platform addresses this by cutting idle draw 40% through liquid cooling and dynamic voltage scaling.[2]NVIDIA Corporation, “NVIDIA Introduces Rubin Platform,” nvidia.comVendors demonstrating sub-300-watt TDP for inference stand to win disproportionate allocations as grid constraints tighten.
CHIPS Act Subsidies Stimulating Domestic GPU Production
Federal incentives are re-shaping the production map. Intel’s USD 7.86 billion award funds four advanced fabs that will bring 18-angstrom process capacity onstream in 2027.[4]Intel Corporation, “Intel Awarded CHIPS Act Funding,” commerce.gov TSMC’s Arizona complex, backed by USD 6.6 billion, adds six fabs plus advanced CoWoS packaging, enabling onshore integration of HBM stacks.[3]TSMC Ltd., “TSMC Arizona Progress Update,” tsmc.com Close proximity between design, fab, and packaging is projected to compress tape-out-to-volume timelines from 18 months to under 12 months. Micron’s planned HBM facility in New York further diversifies supply, mitigating reliance on overseas memory providers.
Expansion Of Cloud Gaming Infrastructure Across The United States
Cloud gaming crossed the 20-millisecond latency threshold in major metros during 2025, unlocking competitive esports use cases. Boosteroid lifted its domestic server count 40% that year, deploying NVIDIA RTX 4080 instances across 15 new cities. Microsoft embedded Xbox Cloud Gaming into mainstream smart TVs, displacing the traditional console upgrade cycle. Each RTX 6000 Ada now serves up to eight simultaneous 1080p game streams, substituting multi-tenant GPU time for individual hardware sales. The shift forces consumer GPU roadmaps to add virtualization features historically reserved for data-center SKUs.
Rise In High-Resolution Gaming And Esports Monitor Adoption
U.S. esports venues upgraded to 240 Hz, 4K displays during 2025, raising GPU headroom requirements in competitive franchises. NVIDIA’s Reflex latency suite and AMD’s Anti-Lag+ features delivered perceptible advantages on these high-refresh monitors, catalyzing demand for GPUs capable of sustaining 300 frames per second at 1440p. Monitor OEMs shipped more than 6 million 4K 240 Hz panels domestically in 2025, double the prior year, reinforcing a virtuous cycle where display upgrades beget GPU purchases.
Restraints Impact Analysis*
| Restraint | (~) % Impact on CAGR Forecast | Geographic Relevance | Impact Timeline |
|---|---|---|---|
| Supply Chain Vulnerability to Advanced Node Manufacturing Capacity | -2.8% | National, dependent on TSMC Taiwan and Samsung Korea | Medium term (2-4 years) |
| Growing Energy Consumption Concerns of High-End GPUs in Data Centers | -2.3% | National, acute in California, Texas, Virginia grid-constrained regions | Short term (≤ 2 years) |
| Cannibalization by Integrated GPUs in Entry-Level PCs | -1.6% | National, consumer and education segments | Medium term (2-4 years) |
| Geopolitical Export Controls Limiting Chinese Foundry Collaboration | -1.2% | National, indirect impact via supply-chain fragmentation | Long term (≥ 4 years) |
| Source: Mordor Intelligence | |||
Supply Chain Vulnerability To Advanced Node Manufacturing Capacity
TSMC and Samsung control above 90% of global sub-7-nanometer capacity, and both are running at near-full utilization through 2026. NVIDIA’s Blackwell GPUs rely on TSMC’s 4 nm process with CoWoS -L packaging that is also used by Apple’s A-series processors, lengthening lead times for GPU wafers. AMD’s MI400 uses TSMC 3 nm, yet volume is capped until late 2026. Although Intel’s 18-angstrom node provides a prospective hedge, its yields remain unproven. Limited foundry headroom empowers incumbents with multiyear wafer agreements while constraining new entrants.
Growing Energy Consumption Concerns Of High-End GPUs In Data Centers
Data-center GPU electricity consumption is projected to top 300 TWh by 2027, matching a midsize nation’s usage. NVIDIA H100 draws 700 W under load; AMD MI300X exceeds 750 W AMD.COM. Microsoft’s 2026 sustainability report revealed a 35% year-on-year Scope 2 emission jump tied to AI infrastructure. Operators in power-scarce regions such as Northern California and Northern Virginia now score GPU bids on performance per watt. Intel’s Gaudi 3 promises 50% lower inference draw than H100, targeting cost-of-ownership over peak throughput.
*Our forecasts treat driver/restraint impacts as directional, not additive. The impact forecasts reflect baseline growth, mix effects, and variable interactions.
Segment Analysis
By Device Application: Datacenters Eclipse Consumer Segments
Servers and datacenter accelerators accounted for 41.62% of shipments in 2025 within the United States discrete GPU market, reflecting the pivot from gamer-centric demand to AI inference clusters. The United States discrete GPU market size attributed to this segment is set to widen further as hyperscalers deploy millions of additional accelerators under multi-year roadmaps. PCs and workstations, once the backbone of volumes, now trail at roughly 30%, pressured by integrated GPU gains and longer replacement cycles. Gaming consoles remain niche, while automotive ADAS designs such as NVIDIA DRIVE Thor introduce fresh high-ASP pockets.
The remainder of the unit volume is split across mobile, embedded vision, and edge servers, each consuming specialized SKUs. Edge inference gateways in retail analytics, smart factories, and healthcare imaging illustrate early but material opportunities. Given sustained hyperscaler appetite, datacenter demand has become secular rather than cyclical, positioning the segment to surpass 50% of the United States discrete GPU market revenues before 2028.


By Memory Type: HBM Gains Share Despite Tight Supply
GDDR products retained 69.47% share in 2025 as the cost per gigabyte remains paramount for gamers and mainstream creators. HBM devices, however, are expanding at a 17.85% clip through 2031 thanks to bandwidth-hungry AI training workloads. NVIDIA’s Blackwell and Rubin families absorb more than 60% of the total HBM4 supply, placing datacenter customers at the front of the allocation queue. NVIDIA.COM. The United States discrete GPU market share contribution of HBM-based accelerators is set to approach 40% by 2030, even though their shipment share stays well below unit parity.
GDDR7 offers an intermediate path: RTX 5090 integrates 32 GB running at 28 Gbps, supplying 1.5 TB/s at roughly one-third the cost of HBM3E, creating a bridge product for price-sensitive workstations. Suppliers are maintaining GDDR6/GDDR7 in high volume to serve mass-market SKUs, while directing capex toward HBM lines that deliver outsized gross margins.
By Performance Tier: Premium Segments Drive Revenue Growth
High-performance consumer GPUs (USD 400-1,200) captured 35.22% share in 2025, buoyed by 4K esports and creator workflows. Yet accelerators priced above USD 1,200, largely datacenter boards, are scaling faster at 17.81% CAGR, fueling a barbell revenue model. The United States discrete GPU market size allocated to these premium accelerators will overshadow mainstream growth as enterprises accept steep ASPs for density and software maturity.
Entry-level discrete boards face cannibalization from advanced integrated GPUs inside Intel Panther Lake and AMD Ryzen mobile chips. NVIDIA halted RTX 4050 production in late 2025, and AMD exited sub-USD 150 projects, choosing instead to channel resources into high-margin datacenter SKUs and professional GPUs.
Geography Analysis
Regional demand clusters around the Northern Virginia, Silicon Valley, and Dallas-Fort Worth datacenter corridors, areas that now swallow the majority of new GPU allocations. More than 50 large-scale campuses in these zones reserved capacity for at least 100 MW of accelerator racks scheduled to go live by end-2027. Midwest manufacturing sites in Ohio and Arizona are emerging as secondary hubs due to CHIPS Act-funded fabs, encouraging local tool-chain suppliers and subcontractors to co-locate.
On the consumer side, coastal metropolitan areas with fiber penetration above 80%, such as Los Angeles, New York, and Seattle, dominate premium desktop and monitor attach rates. Southern states demonstrate faster console GPU growth, driven by lower electricity tariffs and a strong esports culture. Automotive GPU installations concentrate in Detroit and Silicon Valley, following OEM design centers and autonomous-vehicle test sites.
Overall, widespread availability of federally subsidized manufacturing is expected to equalize regional supply by 2028, reducing freight costs and shortening lead times for domestic OEMs. However, electricity pricing disparities and grid saturation keep power-rich states at the forefront of datacenter deployments, reinforcing regional imbalances in installed GPU base.
Competitive Landscape
NVIDIA maintains an 80% stronghold in U.S. datacenter accelerators through exclusive CUDA tooling and first-mover HBM integration. The firm’s Rubin roadmap extends this edge by pairing HBM4 with liquid-cooling-ready boards that slash idle power, a metric increasingly vital in contract bids. AMD counters with ROCm 7.2’s automated CUDA-to-HIP translation, trimming migration overheads by 60% but still facing inertia among enterprise developers. Intel leverages vertical integration: its December 2025 accord with NVIDIA enables x86 CPUs bearing NVLink, allowing Intel Foundry Services to monetize advanced packaging even when board design remains in NVIDIA’s control.
Challenger architectures emphasize efficiency. Tenstorrent’s Blackhole inference chip claims tenfold performance-per-watt over H100, appealing to grid-constrained hyperscalers. Graphcore refocuses its IPU on sparse inference after SoftBank’s acquisition, while Cerebras’ wafer-scale engines achieve leadership on memory-bound scientific codes. As procurement criteria widen to energy and software portability, incumbents must defend moats beyond raw.
Export controls issued in January 2026 direct restricted H200 and MI325X volumes toward domestic clouds, inadvertently strengthening NVIDIA’s U.S. share while constraining global expansion. Simultaneously, tight HBM supply empowers memory vendors to negotiate higher long-term pricing, shifting bargaining power up the supply chain.
United States Discrete GPU Industry Leaders
NVIDIA Corporation
Advanced Micro Devices Inc.
Intel Corporation
Qualcomm Technologies Inc.
Tenstorrent Inc.
- *Disclaimer: Major Players sorted in no particular order

Recent Industry Developments
- January 2026: NVIDIA and Intel finalized a USD 5 billion collaboration to co-develop x86 CPUs with NVLink and RTX chiplets, using Intel’s Foveros and EMIB packaging.
- January 2026: The Bureau of Industry and Security introduced case-by-case export reviews on NVIDIA H200 and AMD MI325X, limiting shipments to 50% of prior volumes and imposing 25% tariffs on destinations of concern.
- January 2026: NVIDIA debuted its Rubin platform with HBM4 and integrated liquid cooling, claiming 2× inference throughput versus H100.


United States Discrete GPU Market Report Scope
A discrete GPU, or discrete graphics processing unit, is a dedicated hardware component designed exclusively to handle graphics rendering and parallel computational tasks, operating independently from the central processing unit (CPU) with its own dedicated video memory (VRAM) and power circuitry.
The United States Discrete GPU Market Report is Segmented by Device Application (Mobile Devices and Tablets, PCs and Workstations, Servers and Datacenter Accelerators, Gaming Consoles and Handhelds, Automotive/ADAS, and Other Embedded and Edge Devices), Memory Type (GDDR-based GPUs, and HBM-based GPUs), Performance Tier (Low-Cost GPUs, Mainstream GPUs, High-Performance Consumer GPUs, and Data Center/AI Accelerator GPUs). The Market Forecasts are Provided in Terms of Value (USD).
| Mobile Devices and Tablets |
| PCs and Workstations |
| Servers and Datacenter Accelerators |
| Gaming Consoles and Handhelds |
| Automotive / ADAS |
| Other Embedded and Edge Devices |
| GDDR-based GPUs |
| HBM-based GPUs |
| Low-Cost GPUs (less than 100 USD) |
| Mainstream GPUs (100 USD to 400 USD) |
| High-Performance Consumer GPUs (400 USD to 1,200 USD) |
| Data Center / AI Accelerator GPUs (greater than 1,200 USD) |
| By Device Application | Mobile Devices and Tablets |
| PCs and Workstations | |
| Servers and Datacenter Accelerators | |
| Gaming Consoles and Handhelds | |
| Automotive / ADAS | |
| Other Embedded and Edge Devices | |
| By Memory Type | GDDR-based GPUs |
| HBM-based GPUs | |
| By Performance Tier | Low-Cost GPUs (less than 100 USD) |
| Mainstream GPUs (100 USD to 400 USD) | |
| High-Performance Consumer GPUs (400 USD to 1,200 USD) | |
| Data Center / AI Accelerator GPUs (greater than 1,200 USD) |


Key Questions Answered in the Report
How large is the United States discrete GPU market in 2026?
The United States discrete GPU market is estimated at USD 19.09 billion in 2026, on track to reach USD 42.20 billion by 2031.
Which application segment is expanding fastest?
Servers and datacenter accelerators, forecast to grow at 17.95% CAGR from 2026-2031.
What memory technology is gaining share against GDDR?
HBM-based GPUs are increasing at a 17.85% CAGR as AI workloads demand ultra-high bandwidth.
Who holds the leadership position in datacenter accelerators?
NVIDIA controls more than 80% of U.S. datacenter accelerator shipments due to CUDA ecosystem lock-in.
Page last updated on:


