Desktop GPU Market Size and Share
Market Overview
| Study Period | 2020 - 2031 |
|---|---|
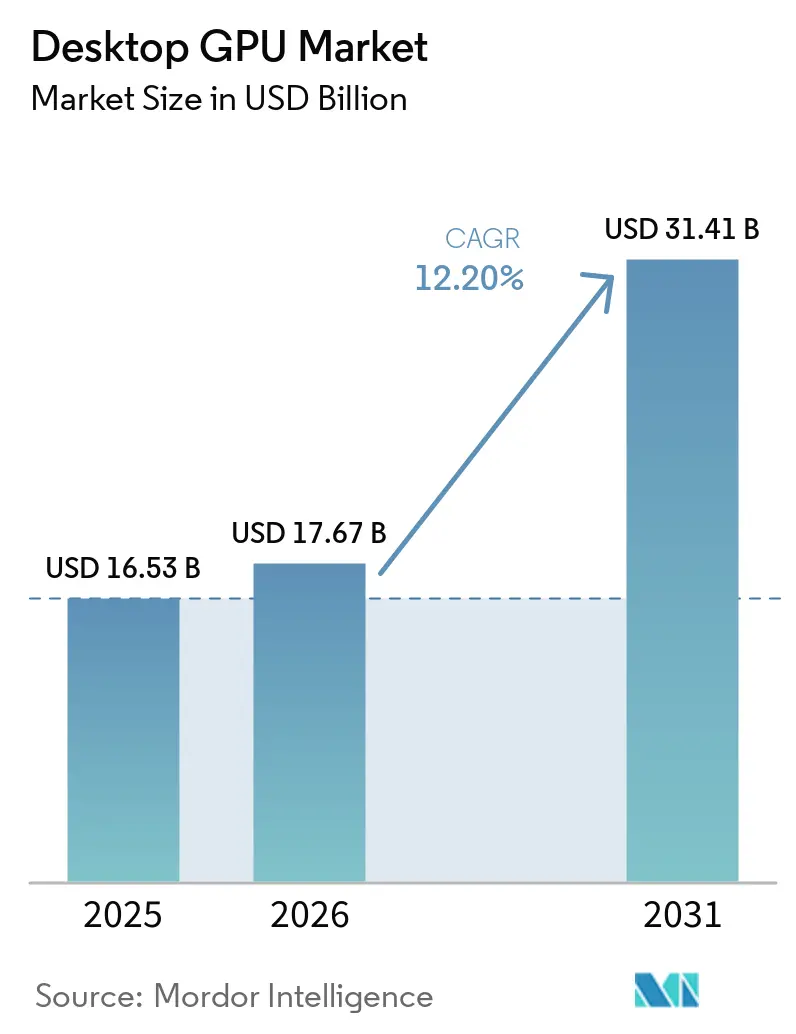
| Market Size (2026) | USD 17.67 Billion |
| Market Size (2031) | USD 31.41 Billion |
| Growth Rate (2026 - 2031) | 12.20% CAGR |
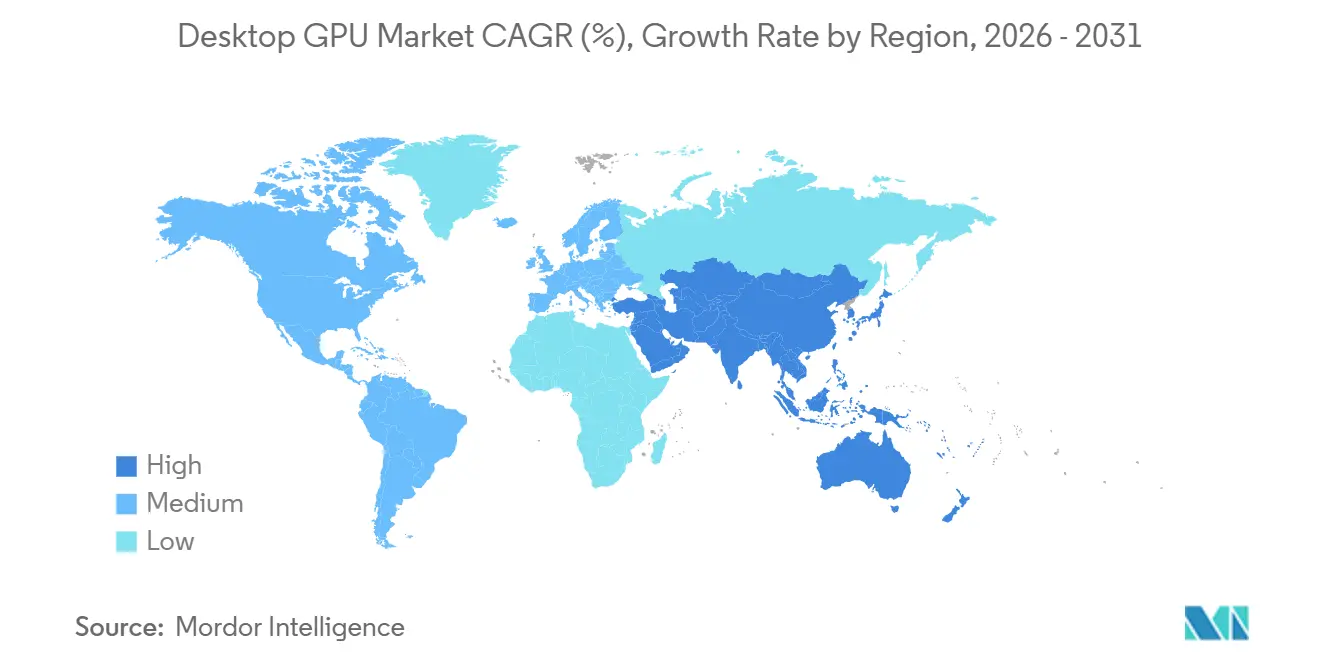
| Fastest Growing Market | Asia-Pacific |
| Largest Market | Asia-Pacific |
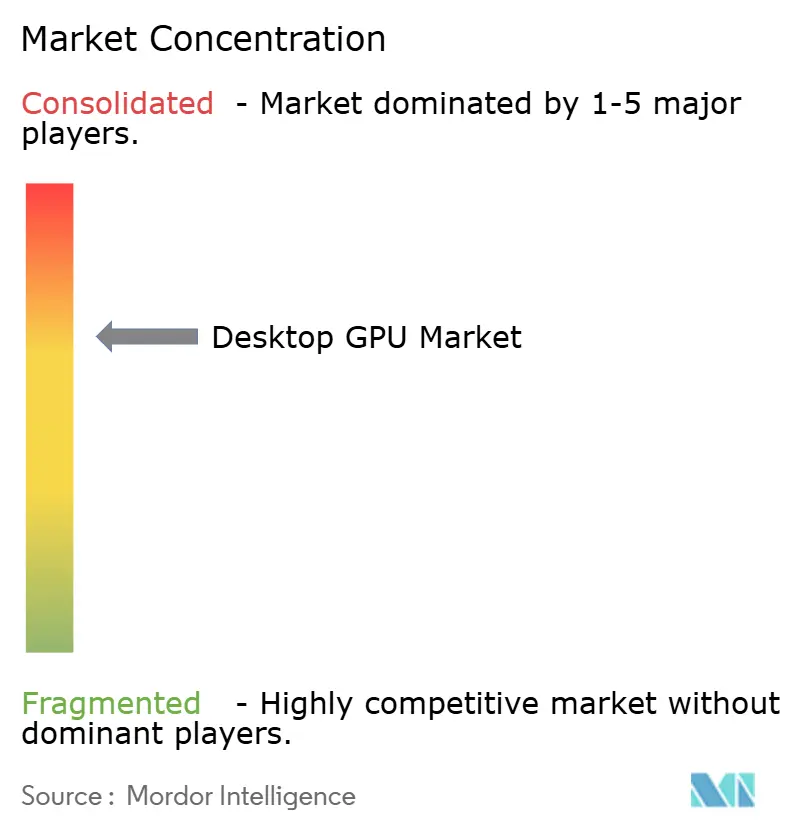
| Market Concentration | Medium |
Major Players *Disclaimer: Major Players sorted in no particular order Image © Mordor Intelligence. Reuse requires attribution under CC BY 4.0. | |
Desktop GPU Market Analysis by Mordor Intelligence
The desktop GPU market size is projected to be USD 16.53 billion in 2025, USD 17.67 billion in 2026, and reach USD 31.41 billion by 2031, growing at a CAGR of 12.20% from 2026 to 2031. The desktop GPU market is being shaped less by a pure gaming cycle and more by the overlap between gaming hardware, creator workloads, and local AI processing. That overlap is lifting average selling prices across the desktop GPU market because buyers are increasingly paying for cards that can handle both visual workloads and AI tasks in the same system. The desktop GPU market is therefore expanding faster in value than in unit terms, which changes the basis of competition for chip designers, board partners, and channel sellers. Companies are responding with launches that tie hardware performance to software ecosystems, creator tools, and AI features instead of relying only on raster graphics gains. The clearest openings remain in premium consumer cards, creator-oriented systems, and desktop configurations built for private inference and fine-tuning inside enterprise and prosumer environments.
Key Report Takeaways
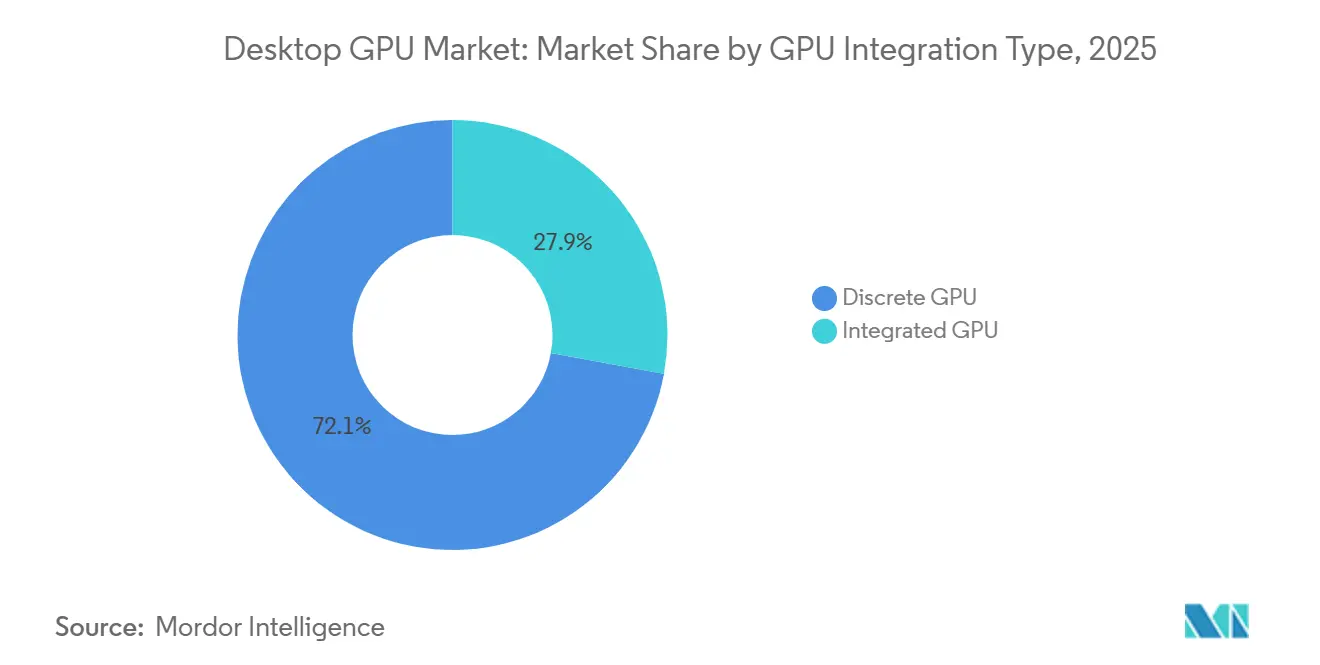
- By GPU integration type, discrete GPUs held 72.11% of the desktop GPU market size in 2025 and also represented the fastest-growing sub-segment with a 13.23% CAGR through 2031.
- By application, gaming accounted for 48.33% of the desktop GPU market in 2025, while multimedia editing and content creation is projected to expand at a 13.45% CAGR through 2031.
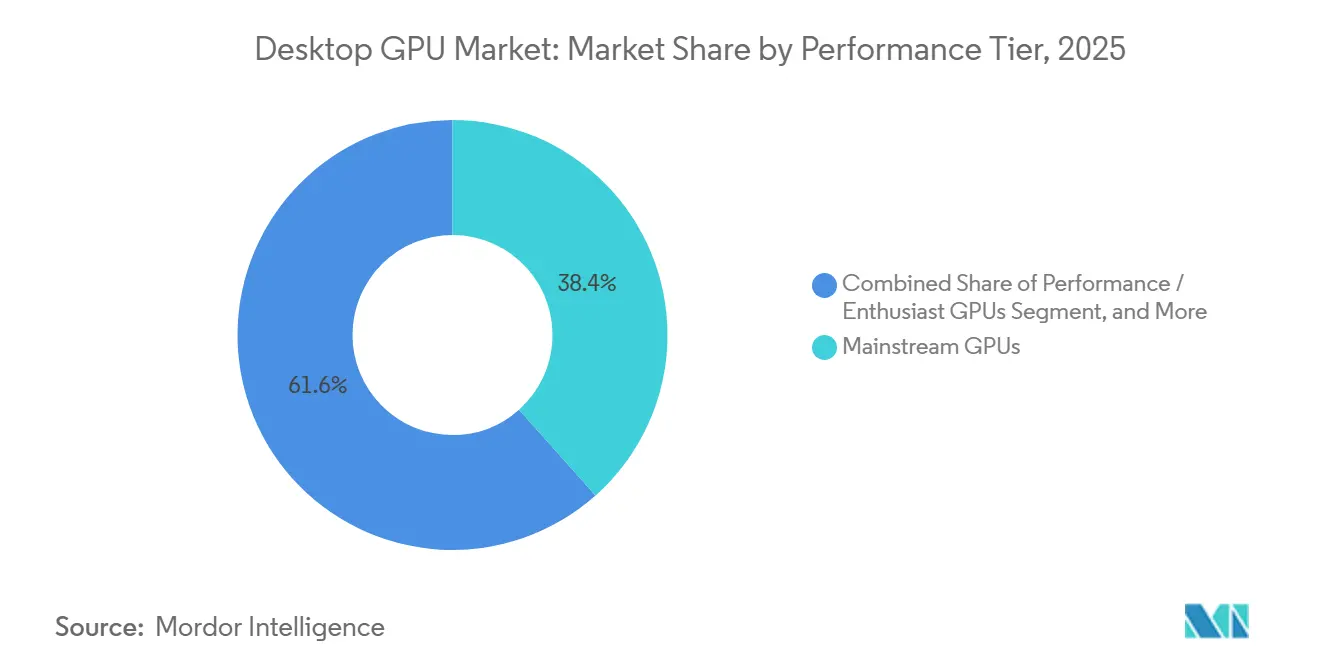
- By performance tier, mainstream GPUs captured 38.42% of desktop GPU market size in 2025, while performance and enthusiast GPUs are expected to record the highest CAGR at 13.32% through 2031.
- By geography, Asia-Pacific held 37.44% of the desktop GPU market in 2025 and is projected to remain the fastest-growing regional segment at a 13.67% CAGR through 2031.
Note: Market size and forecast figures in this report are generated using Mordor Intelligence’s proprietary estimation framework, updated with the latest available data and insights as of January 2026.
Global Desktop GPU Market Trends and Insights
Drivers Impact Analysis*
| Driver | (~) % Impact on CAGR Forecast | Geographic Relevance | Impact Timeline |
|---|---|---|---|
| Artificial Intelligence Workloads Moving Into Desktop-Class GPUs | +3.1% | Global, strongest in North America and Asia-Pacific | Short term (≤ 2 years) |
| Premium Gaming and Esports Upgrade Cycles | +2.7% | Global, core in Asia-Pacific, North America, and Europe | Medium term (2-4 years) |
| Creator and Professional Visualization Demand | +2.1% | North America and Europe, emerging in Asia-Pacific | Medium term (2-4 years) |
| Desktop AI Inference and Local Model Fine-Tuning | +1.8% | Global, strongest in North America and Japan | Short term (≤ 2 years) |
| Domestic GPU Supply Chain Localization in China | +1.3% | China, spill-over to Asia-Pacific partners | Long term (≥ 4 years) |
| Higher Average Selling Prices From Next-Generation Memory and Power Delivery | +1.5% | Global | Short term (≤ 2 years) |
| Source: Mordor Intelligence | |||
Artificial Intelligence Workloads Moving into Desktop-Class GPUs
The desktop GPU market is seeing its strongest push from AI workloads that now run on consumer desktops instead of staying inside cloud or data center environments. NVIDIA stated that GeForce RTX 50 series products based on Blackwell brought fifth-generation Tensor Cores and FP4 support, with FLUX.1 image generation completing in 5 seconds on the RTX 5090 versus 15 seconds on the prior generation with FP16, which materially changed the practical value of consumer cards for AI creation tasks.[1]NVIDIA Corporation, “GeForce RTX 50 Series GPUs Double Creative Performance,” NVIDIA Blog, blogs.nvidia.com That change means buyers in the desktop GPU market are no longer choosing between a gaming card and an AI card because the same discrete product now supports both use cases. It also shortens the replacement cycle because buyers can justify an upgrade on productivity, rendering, and local model performance at the same time. NVIDIA reinforced that shift by pairing silicon advances with NIM microservices and AI Blueprints, which gave developers more reasons to stay inside RTX-oriented workflows. As a result, the desktop GPU market is moving toward higher price bands where software support and AI throughput matter as much as frame rates.
Premium Gaming and Esports Upgrade Cycles
Premium gaming remains a major engine of the desktop GPU market, but demand is now centered on higher display resolutions, higher refresh rates, and AI-assisted rendering rather than on entry-level play. NVIDIA said DLSS 4 with Multi Frame Generation can multiply frame rates by up to 8x over traditional rendering on RTX 50 series hardware, which raises the practical value of premium cards for 1440p, 4K, and competitive gaming setups. AMD also positioned its RDNA 4 launch around this shift, highlighting a 2x gain in ray tracing throughput per compute unit and up to 8x INT8 throughput versus RDNA 3 in its AI accelerator path. The desktop GPU market benefits because esports organizations, internet cafes, and professional LAN venues refresh hardware for both gameplay quality and streaming output, which extends demand beyond single-home buyers. That makes the upgrade cycle more durable, since commercial operators often replace systems on a more predictable schedule than retail consumers. The desktop GPU market therefore keeps drawing support from gaming even as the logic behind upgrades becomes broader and more performance intensive.
Creator and Professional Visualization Demand
The desktop GPU market is also gaining from creator workflows that increasingly combine AI tools with 3D rendering, video production, simulation, and design software. NVIDIA launched its RTX PRO Blackwell family in March 2025, including the RTX PRO 6000 Blackwell Workstation Edition with 96 GB of VRAM and a USD 8,500 launch price, which signaled a clear effort to push desktop-class GPU adoption deeper into engineering, media, and simulation tasks. This matters because creative and technical buyers in the desktop GPU market evaluate hardware against billable throughput, render times, and project turnaround rather than against gaming metrics alone. Puget Systems also reported that AMD’s Radeon AI PRO R9700 posted competitive or stronger results than NVIDIA professional GPUs in several SOLIDWORKS and Autodesk CAD benchmarks, which suggests buyers have more leverage than in earlier workstation cycles. Greater competition at the professional end can widen adoption because it improves the value case for studios, design firms, and engineering teams that need certified or stable GPU performance. The desktop GPU market is therefore expanding its revenue base by serving more professional use cases without losing its gaming core.
Desktop AI Inference and Local Model Fine-Tuning
A separate layer of demand in the desktop GPU market is coming from private AI inference and local model tuning on enterprise or prosumer hardware. NVIDIA announced DGX Spark in March 2025 with the GB10 Grace Blackwell Superchip and up to 1,000 TOPS of AI compute in a desktop form factor, showing that local AI systems are becoming a direct commercial category rather than a niche experiment. This matters because organizations with strict data governance rules are more willing to buy local compute than to send proprietary data to external AI platforms. The desktop GPU market gains when privacy rules and internal compliance practices turn local AI deployment into a hardware purchase decision. The same theme is visible in China, where Moore Threads said in February 2026 that its MTT S5000 reached full-stack compatibility with Alibaba Cloud’s Qwen3.5 model family, supporting domestic enterprise inference use cases on local GPU platforms.[2]South China Morning Post Staff, “Moore Threads' Flagship AI Chip Compatible with Alibaba Models in Tech Self-Reliance Push,” South China Morning Post, scmp.com The desktop GPU market is therefore benefiting from a structural use case that sits outside entertainment and is tied to security, latency, and workflow control.
Restraints Impact Analysis*
| Restraint | (~) % Impact on CAGR Forecast | Geographic Relevance | Impact Timeline |
|---|---|---|---|
| Memory Supply Tightness and Rising Board Costs | -2.4% | Global, most acute in North America and Europe | Short term (≤ 2 years) |
| Integrated Graphics and High-Performance Notebooks Cannibalizing Entry-Level Demand | -1.9% | Global, most pronounced in price-sensitive Asia-Pacific and South America | Medium term (2-4 years) |
| Power, Cooling, and PSU Upgrade Burden at the High End | -1.0% | North America and Europe | Medium term (2-4 years) |
| Export Controls and Product Mix Distortion in China | -0.8% | China, spill-over to Asia-Pacific partners | Long term (≥ 4 years) |
| Source: Mordor Intelligence | |||
Memory Supply Tightness and Rising Board Costs
The desktop GPU market faces a direct constraint from memory supply because graphics card production depends on the same broad memory ecosystem that is also being pulled toward AI accelerator demand. The core issue is that suppliers have stronger incentives to commit advanced capacity to higher-value memory products, which leaves consumer graphics memory under pressure. In the desktop GPU market, that pressure does not only lift retail prices, it also narrows the room that board partners have to protect margins in mainstream products. The result is a market where premium cards can still clear because buyers accept higher prices, while price-sensitive tiers become harder to serve profitably. This changes the competitive balance in favor of brands with better supply agreements and stronger channel control. It also reinforces the shift of the desktop GPU market toward value growth rather than broad unit expansion.
Integrated Graphics and High-Performance Notebooks Cannibalizing Entry-Level Demand
The lower end of the desktop GPU market is under steady substitution pressure from better integrated graphics and from notebooks that now deliver a level of gaming and creator performance that once required a desktop build. AMD’s Ryzen AI MAX+ platform with Strix Halo combined high-core-count CPU performance with integrated RDNA 3.5 graphics and unified LPDDR5X memory, which raised the baseline capability of systems that do not need a separate add-in board. NVIDIA also pushed laptop performance further with RTX 50 series notebook systems that went as thin as 14.9 mm while retaining strong gaming and creator positioning. This matters because buyers who once would have entered the desktop GPU market through an entry card can now meet their needs through an integrated desktop platform or a portable system. That shift compresses the volume base at the low end and pushes the desktop GPU market further toward mainstream, performance, and enthusiast tiers. The overall effect is not a collapse in demand, but a more polarized mix where value pools move upward even when entry-level volume faces pressure.
*Our forecasts treat driver/restraint impacts as directional, not additive. The impact forecasts reflect baseline growth, mix effects, and variable interactions.
Segment Analysis
By GPU Integration Type: Discrete Cards Lead on AI Demand
Discrete GPUs accounted for 72.11% of desktop GPU market share in 2025, and they are also the fastest-growing integration type with a 13.23% CAGR through 2031. That leadership reflects the fact that the desktop GPU market now depends on workloads such as 4K gaming, ray tracing, local AI inference, video encoding, and 3D simulation that remain beyond the practical reach of integrated graphics at similar price levels. The desktop GPU industry is therefore placing its highest value on cards that can serve more than one demanding workflow in the same machine. NVIDIA reinforced this end of the desktop GPU market when it launched the GeForce RTX 5090 in January 2025 with 32 GB of GDDR7 memory, 1,792 GB/s of bandwidth, and a USD 1,999 list price that reset the performance ceiling for consumer cards. That launch mattered beyond one product because it pulled the pricing structure of adjacent discrete tiers upward and made high-end AI-ready gaming cards more acceptable in the retail channel.
Integrated GPUs made up the remaining 28% of revenue in 2025, and their role in the desktop GPU market is larger than that revenue figure alone suggests. They continue to serve office systems, light creative work, and casual gaming, where cost, thermal limits, and system simplicity still matter more than peak graphics throughput. The desktop GPU market also uses integrated graphics as a reference point for entry-level value, since every improvement in on-die graphics raises the pressure on low-margin discrete cards. AMD’s RDNA 3.5 integrated graphics in Ryzen AI 300 series desktop processors moved the baseline higher for 1080p gaming and lighter compute tasks, which makes some low-end discrete purchases easier to postpone. As software frameworks from AMD and Intel improve support for integrated GPU compute, the desktop GPU industry may see more light AI inference and media tasks handled without a separate card, while the discrete tier keeps its advantage in higher-value workloads.


By Application: Gaming Leads as Content Creation Gains Momentum
Gaming represented 48.33% of desktop GPU market size in 2025, which kept it as the largest application in the desktop GPU market by a clear margin. That leading position still reflects the installed base of players, the importance of visual fidelity, and the willingness of enthusiasts to upgrade for higher refresh rates, ray tracing, and AI-based upscaling. The desktop GPU market, however, is no longer driven by gaming in a simple volume sense because premium buyers now link a graphics upgrade to broader uses such as recording, streaming, and local AI-enabled play enhancement. AMD’s RDNA 4 rollout made that shift visible when it introduced the Radeon RX 9070 XT at USD 599 with a value position aimed at delivering 4K-class performance closer to the price territory once associated with 1440p cards. That pricing pressure matters because it forces all suppliers in the desktop GPU market to defend margin while still showing clear gains in performance per dollar.
Multimedia editing and content creation is projected to expand at a 13.45% CAGR through 2031, making it the fastest-growing application in the desktop GPU market. Creator workflows are now blending video encoding, image generation, AI enhancement, and 3D content production in ways that reward higher-end desktop hardware. NVIDIA said its ninth-generation NVENC encoder on RTX 50 series hardware exported video 60% faster than the RTX 4090, which turned GPU upgrades into a direct productivity decision for studios and individual creators. Professional visualization and CAD also remain important because simulation and render acceleration keep expanding in architecture, engineering, and design settings. Other applications, including scientific computing, medical imaging, and machine learning work on desktop rigs, still account for a smaller share, but they add meaningful incremental demand to the desktop GPU market where cloud budgets are limited or local control matters.
By Performance Tier: Mainstream Volume Anchors, Enthusiast Segment Accelerates
Mainstream GPUs captured 38.42% of desktop GPU market size in 2025, which made them the largest performance tier by revenue. This tier continues to anchor the desktop GPU market because it sits in the broadest practical price band for annual upgrades, balancing acceptable performance with a budget range that serves both do-it-yourself builders and prebuilt system buyers. At the same time, performance and enthusiast GPUs are forecast to grow at 13.32% CAGR through 2031, showing that the strongest growth in the desktop GPU market is moving upward rather than downward. That acceleration reflects the fact that cards in the USD 500 to USD 1,000 band now appeal to buyers who want strong gaming performance and enough VRAM for local AI workloads in one purchase. The desktop GPU market share of premium cards is therefore benefiting from the overlap between entertainment and compute needs, not only from a traditional enthusiast upgrade cycle.
The professional workstation tier operates on a smaller unit base but on much higher value per system, and it remains a critical part of the desktop GPU market. NVIDIA’s RTX PRO 6000 Blackwell Workstation Edition entered the market at USD 8,500 in March 2025, which showed how much buyers in engineering, medical imaging, and media production are willing to pay for certified, stable, and memory-rich desktop graphics platforms. These buyers often focus on application certification, long-session stability, and ecosystem compatibility rather than on retail gaming benchmarks. The desktop GPU industry also faces a balancing effect here because software improvements can extend the useful life of installed performance cards, especially when new upscaling or AI features are delivered through software layers. Even so, the desktop GPU market remains tilted toward higher value tiers because the strongest buyer motivation is increasingly tied to mixed gaming, creator, and AI workloads rather than to entry-level play alone.

Geography Analysis
Asia-Pacific accounted for 37.44% of desktop GPU market share in 2025, and it is projected to expand at 13.67% CAGR through 2031, making it the largest and fastest-growing regional segment in the desktop GPU market. Japan supported that momentum with record PC refresh activity, as Nikkei reported annual domestic PC shipments of 18.059 million units in fiscal 2025, up 32.6% year over year, driven by Windows 10 end-of-support replacement and GIGA School device renewal.[3]Nikkei Staff, “2025 Annual Domestic PC Shipments Survey Results,” Nikkei, nikkei.com That matters for the desktop GPU market because refresh cycles in consumer and prosumer systems tend to lift attachment opportunities for discrete graphics in gaming and creative setups. South Korea continues to matter because its gaming culture and internet cafe footprint sustain high replacement activity in systems built for esports and streaming. China adds a different kind of support to the desktop GPU market because domestic GPU localization is creating demand for local hardware stacks and reinforcing investment across consumer, enterprise, and software layers.
North America and Europe remain the highest-value regions in the desktop GPU market because they concentrate creator, engineering, game development, and AI software activity. Buyers in these regions are more likely to purchase performance, enthusiast, and workstation systems where graphics cards serve professional output as well as leisure use. The desktop GPU market in North America is supported by a deep base of AI developers, visual effects studios, and simulation-heavy enterprises that keep demand firm even when household upgrade cycles stretch out. Europe adds another layer through enterprise procurement rules and energy-efficiency requirements, which make buyers more selective but still willing to spend on capable desktop systems that serve longer work cycles.
South America and the Middle East and Africa represent a smaller revenue base, but they remain important growth spaces for the desktop GPU market. Brazil carries much of the regional weight in South America because gaming, creator activity, and local digital media production keep demand centered on mainstream discrete products. In the Middle East and Africa, esports venues, creator spaces, and entertainment investments are widening the addressable base for desktop-class graphics systems. The desktop GPU market in both regions remains price sensitive, which keeps mainstream and entry-level products central to adoption even as supply conditions and import structures continue to shape actual retail availability.

Competitive Landscape
The desktop GPU market remains highly concentrated at the silicon level even though board-level branding appears more varied to end buyers. NVIDIA continues to set the pace in the desktop GPU market because it combines hardware leadership with CUDA, DLSS, creator tools, and AI software support that deepen customer dependence on its platform. Its January 2025 launch of the GeForce RTX 5090 and RTX 5080 extended that position by tying Blackwell architecture, neural rendering, and large memory capacity to the top end of the consumer stack. NVIDIA also widened its reach in March 2025 through the RTX PRO Blackwell family, which aligned professional workstation demand with the same broader platform strategy seen in gaming and creator products. This gives the desktop GPU market a competitive structure where one supplier benefits from ecosystem depth as much as from raw chip performance.
AMD remains the clearest challenger in the desktop GPU market because it used the RX 9000 series launch to sharpen value positioning in mainstream and performance tiers. The Radeon RX 9070 XT and RX 9070 entered in March 2025 with RDNA 4 architecture, third-generation ray tracing accelerators, and FSR 4 AI upscaling, which gave AMD a stronger technical and pricing basis for competing in the most commercially active parts of the market. Intel is still more limited in reach, but its Arc B580 and Arc B570 launches established a more credible value-tier presence with XeSS 2 frame generation and accessible launch prices. The desktop GPU market therefore has visible competition in price-performance terms even if the ecosystem gap remains substantial.
China is where the most meaningful longer-term disruption in the desktop GPU market is taking shape. Moore Threads is pushing that shift by pairing domestic GPU hardware with software compatibility milestones, including full-stack support for Alibaba Cloud’s Qwen3.5 models, which strengthens its case for enterprise and institutional procurement. That matters because localized software support can reduce the practical advantage of foreign incumbents in specific domestic workloads. The desktop GPU market could therefore become more regionally split over time, with Western ecosystems and China-focused ecosystems evolving on different commercial paths even when both target desktop AI, gaming, and professional use cases.
Desktop GPU Industry Leaders
NVIDIA Corporation
Advanced Micro Devices, Inc.
Intel Corporation
ASUSTeK Computer Inc.
Micro-Star International Co., Ltd.
- *Disclaimer: Major Players sorted in no particular order

Recent Industry Developments
- June 2026: NVIDIA reduced RTX 50-series GPU allocations to AIC partners by 15-20%, citing GDDR7 memory supply constraints. Street prices for RTX 50-series cards climbed 15-19% above MSRP globally, with the RTX 5090 trading above USD 3,000 in multiple markets. NVIDIA confirmed it would continue shipping all GeForce SKUs while acknowledging memory supply remained constrained.
- June 2026: AMD Radeon RX 9070 GRE launched globally at USD 549, expanding the RX 9000 series beyond its China-first release. The card features 48 RDNA 4 compute units and 12 GB of GDDR6 memory on a 192-bit interface, positioning it between the RX 9070 and RX 9070 XT in the performance stack for international markets.
- May 2026: AMD SVP Jack Huynh announced, that FSR 4.1, the AI-accelerated upscaling technology previously exclusive to RDNA 4, would extend to RDNA 3-based Radeon RX 7000 series GPUs in July 2026, expanding the addressable software-upgrade base to millions of installed discrete GPUs.
- March 2026: NVIDIA launched the RTX PRO Blackwell professional GPU series, including the RTX PRO 6000 Blackwell Workstation Edition with 96 GB of VRAM and USD 8,500 launch price, the RTX PRO 5000 Blackwell at USD 4,500 (48 GB, 1,344 GB/s bandwidth), and mid-range Blackwell workstation GPUs targeting CAD and AEC workflows.


Global Desktop GPU Market Report Scope
The Global Desktop GPU Market represents the worldwide industry focused on the development, manufacturing, and distribution of graphics processing units (GPUs) designed for desktop computers, catering to diverse applications such as gaming, professional visualization, artificial intelligence, machine learning, and cryptocurrency mining.
The Desktop GPU market Report is segmented by GPU Integration Type (Discrete GPU and Integrated GPU), Application (Gaming, Professional Visualization and CAD, Multimedia Editing and Content Creation, and Other Applications), Performance Tier (Entry-Level GPUs, Mainstream GPUs, Performance / Enthusiast GPUs, and Professional Workstation GPUs), End User (Consumer, Enterprise, Education, and Government), and Geography (North America, Europe, Asia-Pacific, South America, and Middle East and Africa). The Market Forecasts are Provided in Terms of Value (USD).
| Discrete GPU |
| Integrated GPU |
| Gaming |
| Professional Visualization and CAD |
| Multimedia Editing and Content Creation |
| Other Applications |
| Entry-Level GPUs |
| Mainstream GPUs |
| Performance / Enthusiast GPUs |
| Professional Workstation GPUs |
| North America | United States |
| Canada | |
| Mexico | |
| Europe | Germany |
| United Kingdom | |
| France | |
| Italy | |
| Rest of Europe | |
| Asia-Pacific | China |
| Japan | |
| South Korea | |
| India | |
| Southeast Asia | |
| Rest of Asia-Pacific | |
| South America | |
| Middle East and Africa |
| By GPU Integration Type | Discrete GPU | |
| Integrated GPU | ||
| By Application | Gaming | |
| Professional Visualization and CAD | ||
| Multimedia Editing and Content Creation | ||
| Other Applications | ||
| By Performance Tier | Entry-Level GPUs | |
| Mainstream GPUs | ||
| Performance / Enthusiast GPUs | ||
| Professional Workstation GPUs | ||
| By Geography | North America | United States |
| Canada | ||
| Mexico | ||
| Europe | Germany | |
| United Kingdom | ||
| France | ||
| Italy | ||
| Rest of Europe | ||
| Asia-Pacific | China | |
| Japan | ||
| South Korea | ||
| India | ||
| Southeast Asia | ||
| Rest of Asia-Pacific | ||
| South America | ||
| Middle East and Africa | ||


Key Questions Answered in the Report
What is the current and forecast value of the desktop GPU space?
The desktop GPU market size stood at USD 16.53 billion in 2025, is valued at USD 17.67 billion in 2026, and is projected to reach USD 31.41 billion by 2031 at a 12.20% CAGR.
Which product type leads desktop GPU demand?
Discrete GPUs led with 72.11% revenue share in 2025 and are also the fastest-growing integration type at a 13.23% CAGR through 2031.
Why are AI workloads becoming important for desktop graphics cards?
Buyers now use desktop GPUs for local inference, image generation, video enhancement, and model tuning, which increases demand for cards with stronger memory, AI throughput, and software support.
Which application generates the most revenue for desktop graphics processors?
Gaming remained the largest application with 48.33% of revenue in 2025, while multimedia editing and content creation is growing faster at a 13.45% CAGR through 2031.
Which region is expanding the fastest for desktop graphics cards?
Asia-Pacific led with 37.44% share in 2025 and is forecast to grow at 13.67% CAGR through 2031, supported by refresh cycles, gaming demand, and localization efforts.
What is shaping competition among desktop GPU vendors in 2026?
Competition is being shaped by ecosystem strength, AI-ready product launches, creator features, and regional software alignment, with NVIDIA, AMD, Intel, and emerging China-based vendors all influencing the mix.
Page last updated on:


