United States GPU Market Size and Share
Market Overview
| Study Period | 2021 - 2031 |
|---|---|
| Forecast Data Period | 2026 - 2031 |
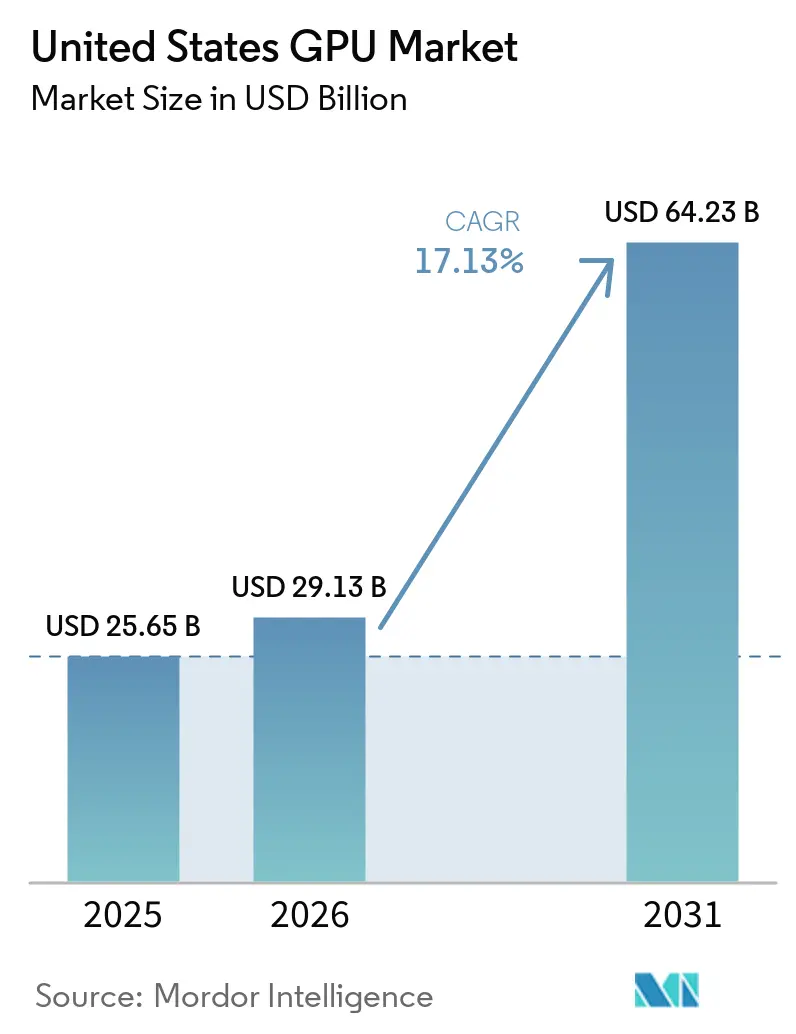
| Base Year Market Size (2025) | USD 25.65 Billion |
| Market Size (2026) | USD 29.13 Billion |
| Market Size (2031) | USD 64.23 Billion |
| Growth Rate (2026 - 2031) | 17.13% CAGR |
| Market Concentration | High |
Major Players *Disclaimer: Major Players sorted in no particular order Image © Mordor Intelligence. Reuse requires attribution under CC BY 4.0. | |
United States GPU Market Analysis by Mordor Intelligence
The United States GPU market size is projected to expand from USD 25.65 billion in 2025 and USD 29.13 billion in 2026 to USD 64.23 billion by 2031, registering a CAGR of 17.13% between 2026 and 2031. Accelerated adoption of large language models, growth in data-center graphics workloads, and the emergence of generative AI services are the structural forces behind this rapid scale-up. Spending is tilting from retail graphics cards toward datacenter accelerators as cloud providers pre-order entire production runs, locking in scarce advanced-node capacity. Government incentives under the CHIPS and Science Act are catalyzing on-shore fabrication, while supply constraints in high-bandwidth memory and advanced packaging push average selling prices higher. Competitive dynamics favor full-stack platforms that integrate silicon, interconnects, and software, giving incumbent ecosystem leaders stronger pricing power and margins even as total unit volumes shift toward enterprise channels.
Key Report Takeaways
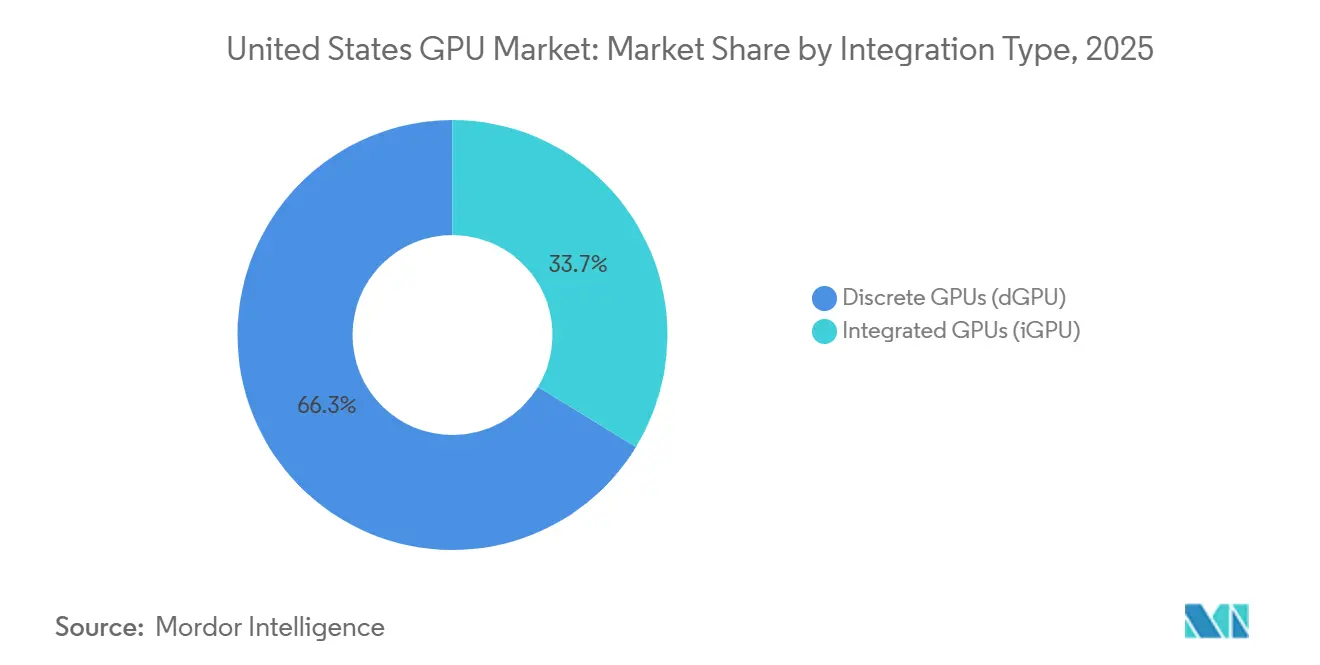
- By integration type, discrete GPUs led with 66.29% revenue share in 2025, while integrated GPUs are forecast to expand at a 16.48% CAGR through 2031.
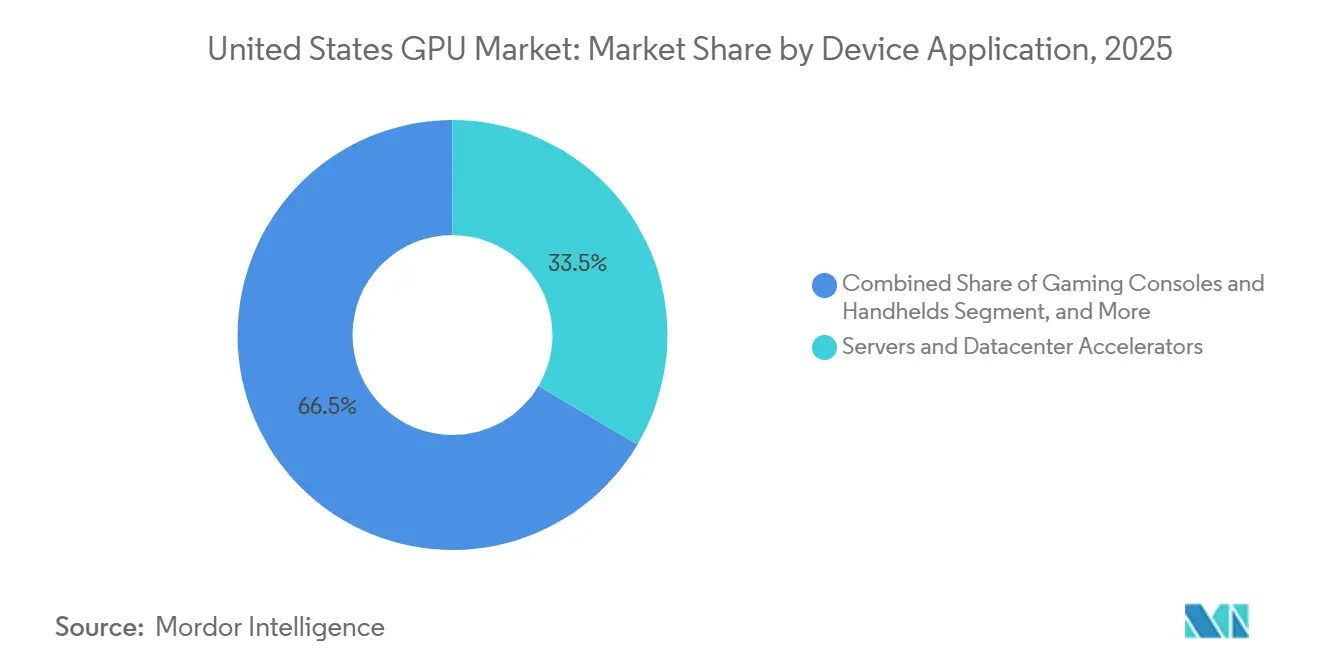
- By device application, servers and datacenter accelerators accounted for 33.51% of the United States GPU market share in 2025 and are advancing at a 17.61% CAGR through 2031.
Note: Market size and forecast figures in this report are generated using Mordor Intelligence’s proprietary estimation framework, updated with the latest available data and insights as of January 2026.
United States GPU Market Trends and Insights
Drivers Impact Analysis*
| Driver | (~) % Impact on CAGR Forecast | Geographic Relevance | Impact Timeline |
|---|---|---|---|
| Growth in AI and Data Center Acceleration Adoption | +6.20% | United States – hyperscale clusters in Virginia, Oregon, Texas, Iowa | Medium term (2-4 years) |
| Expanding Demand for High-Performance Gaming PCs | +3.10% | United States – urban concentration | Short term (≤ 2 years) |
| Government Incentives for Domestic Semiconductor Manufacturing | +2.80% | United States – Arizona, Ohio, New York fab sites | Long term (≥ 4 years) |
| Rising Popularity of Cloud Gaming Services | +1.90% | United States – latency-sensitive metro areas | Medium term (2-4 years) |
| Increasing Content Creation Workloads Among Prosumers | +1.50% | United States – Los Angeles, New York, Austin | Short term (≤ 2 years) |
| Emergence of GPU Virtualization for Enterprise Desktops | +1.20% | United States – enterprise-dense Northeast and West Coast | Medium term (2-4 years) |
| Source: Mordor Intelligence | |||
Growth In AI And Data Center Acceleration Adoption
Hyperscale operators deployed more than one million accelerators domestically in 2025, with Microsoft Azure, AWS, and Google Cloud representing nearly four-fifths of shipments. Multi-year supply contracts now replace spot buys, locking in wafer and packaging capacity well before tape-out. Such commitments protect production priority but reduce availability for regional cloud providers and research labs, indirectly propelling the GPU-as-a-Service model. A single state-of-the-art training run can occupy tens of thousands of cards for months, requiring on-site generation or co-location near baseload power to manage 300- to 1,000-megawatt loads.[1] U.S. Department of Energy, “AI Compute Infrastructure Load Management Guidance,” energy.gov
Expanding Demand For High-Performance Gaming PCs
U.S. shipments of discrete gaming cards climbed to 8.4 million units in Q4 2024, buoyed by ray-tracing titles and AI-driven upscaling that demand dedicated compute. Yet mid-range boards priced from USD 300 to USD 500 grabbed share from USD 1,000-plus flagships, trimming blended average prices. The entry-level market is being eroded by cloud gaming, while eSports enthusiasts still pay premiums for 240 fps hardware.[2]Jon Peddie, “GPU Shipments Q4 2024,” jonpeddie.com
Government Incentives For Domestic Semiconductor Manufacturing
The CHIPS and Science Act unlocked USD 52.7 billion in federal support, triggering private commitments that surpass USD 400 billion. TSMC, Intel, and Samsung are building Arizona, Ohio, and Texas megafabs with 3 nm and 2 nm nodes that shorten supply chains for AI accelerators. Although on-shore wafer costs run higher than Asian equivalents, investment tax credits and reduced geopolitical risk improve the total cost of ownership. Advanced packaging capacity, still concentrated offshore, remains the critical missing link, delaying full benefit realization.[3]NVIDIA Corporation, “GeForce NOW Milestones,” nvidia.com
Rising Popularity Of Cloud Gaming Services
Subscriber counts topped 40 million in 2025, with aggregate streaming hours growing faster than discrete GPU sales. A single datacenter card can now support scores of concurrent 1080p sessions, driving up utilization from the mid-teens in home PCs to more than 70% in cloud farms. Low-latency edge points limit serviceable geography, but where infrastructure exists, subscriptions substitute for entry-level hardware purchases, redistributing demand into enterprise procurement.
Restraints Impact Analysis*
| Restraint | (~) % Impact on CAGR Forecast | Geographic Relevance | Impact Timeline |
|---|---|---|---|
| Supply Chain Constraints of Advanced Nodes | -2.40% | United States – reliance on TSMC and Samsung 3 nm-5 nm capacity | Short term (≤ 2 years) |
| High Power Consumption and Cooling Challenges | -1.80% | United States – datacenter hubs in Virginia, Oregon, Texas | Medium term (2-4 years) |
| Market Cannibalization by Integrated GPUs | -1.10% | United States – consumer PC and mobile segments | Short term (≤ 2 years) |
| Rising Scrutiny Over GPU Energy Emissions | -0.90% | United States – California, New York, Washington | Long term (≥ 4 years) |
| Source: Mordor Intelligence | |||
Supply Chain Constraints Of Advanced Nodes
Advanced packaging lags wafer output by roughly 18 months, restricting shipments even when plenty of 3 nm wafers are available. The supply of high-bandwidth memory is also tight, forcing smaller buyers to accept 40% spot-price premiums or defer projects. Domestic gigafab construction will close the gap only after 2028, so scarcity will keep prices elevated and allocate priority to hyperscalers with long-term contracts.[4]TSMC, “April 2026 Packaging Capacity Briefing,” tsmc.com
High Power Consumption And Cooling Challenges
Latest accelerator racks draw more than 120 kilowatts, demanding liquid cooling and new substation capacity. Retrofitting existing facilities costs millions and delays deployment timelines by more than a year. Federal guidelines now recommend direct liquid cooling to achieve PUE targets below 1.2, but adoption remains limited due to capital expense and operator learning curves.[5]U.S. Environmental Protection Agency, “Guidelines for Liquid-Cooled Data Centers,” epa.gov
*Our forecasts treat driver/restraint impacts as directional, not additive. The impact forecasts reflect baseline growth, mix effects, and variable interactions.
Segment Analysis
By Integration Type: Discrete GPUs Anchor Performance Leadership
Discrete accelerators accounted for 66.29% of the United States GPU market in 2025, reflecting demand for dedicated memory stacks, independent power rails, and aggressive thermal solutions. Premium datacenter boards showcase 700-watt envelopes, 192 GB of HBM3E, and FP8 throughput exceeding 20 petaflops, enabling trillion-parameter model training. The United States GPU market size for discrete products is projected to grow at 17.53% CAGR as hyperscalers scale clusters by the million-accelerator level. Integrated designs hold 33.71% share and target laptop, tablet, and thin-client workloads where 15-watt budgets are paramount. Qualcomm, Apple, and Intel are closing the capability gap, offering 15-30 teraflops in battery-powered devices, which compresses entry-level discrete demand.
Integrated GPUs are capturing mid-tier consumer spend once served by cards below USD 300. Intel’s forthcoming Panther Lake platform integrates ray tracing and matrix engines, while Qualcomm’s Snapdragon X2 Elite delivers 80 TOPS neural throughput at sub-15-watt draw. Vendors of discrete boards, therefore, concentrate on high-margin datacenter, workstation, and enthusiast segments, where customers value peak performance per node and invest in liquid cooling infrastructure to unlock gains. This strategic pivot supports gross margins above 60% despite flat to declining unit volume in the consumer channel.


By Device Application: Datacenter Accelerators Drive Revenue Expansion
Servers and datacenter accelerators represented 33.51% of the United States GPU market share in 2025 and are on track for the fastest 17.61% CAGR. Multi-year framework agreements exceeding USD 10 billion each underpin this trajectory, tying wafer allocation directly to cloud capacity roadmaps. The United States GPU market size, attributed to server deployments, rises sharply as accelerators displace CPU-only compute for AI inference and high-performance analytics. PCs and professional workstations, holding close to 28% share, advance at 15.8% as content creators, engineers, and quantitative analysts harness GPU compute for parallel workloads.
Mobile devices and tablets make up roughly 22% share and expand at 16.2%, reflecting on-device AI and console-class gaming on handhelds. Gaming consoles and handhelds contribute about 9%, while automotive and ADAS capture sub-5% yet post nearly 19% CAGR, the highest among tracked applications. Edge industrial and medical devices round out the balance at a moderate 13.7% growth pace. The pattern shows enterprise and automotive verticals absorbing incremental demand, with consumer channels maturing and migrating toward service delivery models.

Geography Analysis
GPU demand is geographically concentrated in four hyperscale corridors. Loudoun County, Virginia, alone houses more than 25 million square feet of datacenter space and consumes a quarter of local grid load. Oregon’s high-voltage lines, Texas’s deregulated markets, and Iowa’s wind resources attract new AI campuses. CHIPS Act incentives are diversifying semiconductor fabrication into Arizona, Ohio, and Texas, where 3 nm and 2 nm lines will come online late in the decade, creating a domestic supply for the United States GPU market needs.
Urban creation hubs such as Los Angeles, New York, and Austin stimulate workstation sales, while New York and Chicago drive accelerated analytics for finance. Automotive design activity spans Detroit to Silicon Valley, fueling ADAS GPU demand. Enterprise VDI rollouts cluster along the Northeast corridor and the West Coast, where regulated industries prefer on-premises hardware that meets data sovereignty obligations.
State policies shape deployment dynamics. California and New York enforce emissions caps, encouraging liquid cooling and renewable procurement, whereas Texas and Iowa focus on tax relief and lower power prices. Federal energy guidelines recommend aggressive PUE targets, nudging older facilities toward retrofit or retirement. Collectively, the geography narrative underscores that electricity cost, fiber backhaul, and incentives, rather than simple population density, dictate where United States GPU market investments materialize.
Competitive Landscape
The United States GPU market is highly consolidated in datacenter acceleration, with Nvidia surpassing 90% share of AI revenue in 2025. AMD captures single-digit share through cost-competitive MI300 variants that appeal to inference clusters, while Intel aims at mid-range and integrated segments. Nvidia’s CUDA ecosystem and NVLink fabric create switching costs exceeding USD 10 million per codebase, reinforcing its moat. AMD responds with ROCm compatibility and strategic acquisitions in AI software and system integration to close functionality gaps.
Intel’s 18A foundry partnership with Nvidia, announced in December 2025, represents coopetition: Intel monetizes advanced process capacity while Nvidia hedges geopolitical exposure. Qualcomm and Nvidia contest the automotive compute frontier, where lower watt budgets favor system-on-chip solutions over discrete boards. Vertical service providers such as CoreWeave and Lambda Labs monetize demand overflow from hyperscalers by offering GPU-as-a-Service to startups and research institutions.
Challenger architectures from Graphcore and Cerebras promise order-of-magnitude gains on sparse or wafer-scale workloads, but ecosystem inertia and software fragmentation slow adoption. Export curbs on high-end accelerators alter demand distribution, redirecting supply to domestic buyers yet sparking international alternatives that could dilute global standards. Overall, platform breadth, software stickiness, and early access to advanced packaging capacity define competitive advantage in the United States GPU market.
United States GPU Industry Leaders
Nvidia Corporation
Advanced Micro Devices, Inc.
Intel Corporation
Qualcomm Incorporated
Apple Inc.
- *Disclaimer: Major Players sorted in no particular order

Recent Industry Developments
- March 2026: NVIDIA and AWS signed a 1 million-GPU supply agreement valued at about USD 50 billion, securing Blackwell and Rubin production.
- March 2026: Google Cloud rolled out G4 instances based on Nvidia L4 accelerators for power-efficient inference workloads.
- February 2026: Microsoft deployed GB300 NVL72 racks on Azure and introduced RTX PRO 6000 Blackwell GPUs for virtual desktops.
- January 2026: TSMC committed USD 165 billion to a six-fab Arizona cluster with integrated advanced packaging capacity.


United States GPU Market Report Scope
The United States GPU Market Report is Segmented by Integration Type (Integrated GPUs, Discrete GPUs) and Device Application (Mobile Devices and Tablets, PCs and Workstations, Servers and Datacenter Accelerators, Gaming Consoles and Handhelds, Automotive/ADAS, Other Embedded and Edge Devices). The Market Forecasts are Provided in Terms of Value (USD).
| Integrated GPUs (iGPU) |
| Discrete GPUs (dGPU) |
| Mobile Devices and Tablets |
| PCs and Workstations |
| Servers and Datacenter Accelerators |
| Gaming Consoles and Handhelds |
| Automotive / ADAS |
| Other Embedded and Edge Devices |
| By Integration Type | Integrated GPUs (iGPU) |
| Discrete GPUs (dGPU) | |
| By Device Application | Mobile Devices and Tablets |
| PCs and Workstations | |
| Servers and Datacenter Accelerators | |
| Gaming Consoles and Handhelds | |
| Automotive / ADAS | |
| Other Embedded and Edge Devices |


Key Questions Answered in the Report
How large is the United States GPU market in 2026?
It is estimated at USD 29.13 billion, on its way to USD 64.23 billion by 2031.
What CAGR is expected for U.S. GPU revenue through 2031?
The market is projected to grow at 17.13% from 2026 to 2031.
Which segment grows fastest in the forecast period?
Servers and datacenter accelerators are advancing at 17.61% CAGR, the quickest among tracked applications.
How will CHIPS Act funding influence domestic GPU supply?
New fabs in Arizona, Ohio, and Texas will add advanced 3 nm-2 nm capacity after 2028, shortening supply chains and reducing geopolitical risk.
Page last updated on:


