
GPU Server Market Size and Share
Market Overview
| Study Period | 2020 - 2031 |
|---|---|
| Market Size (2026) | USD 65.72 Billion |
| Market Size (2031) | USD 186.43 Billion |
| Growth Rate (2026 - 2031) | 23.19 % |
| Fastest Growing Market | Asia-Pacific |
| Largest Market | Asia-Pacific |
| Market Concentration | Medium |
Major Players *Disclaimer: Major Players sorted in no particular order Image © Mordor Intelligence. Reuse requires attribution under CC BY 4.0. | |
GPU Server Market Analysis by Mordor Intelligence
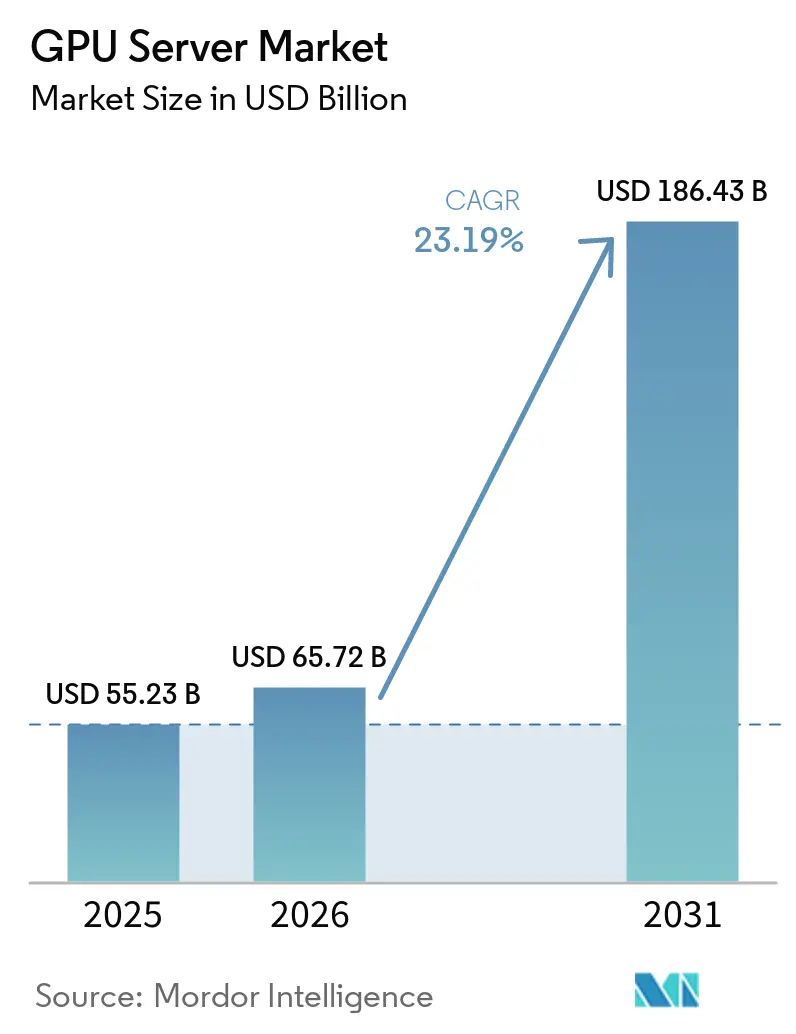
The GPU server market size was valued at USD 55.23 billion in 2025 and estimated to grow from USD 65.72 billion in 2026 to reach USD 186.43 billion by 2031, at a CAGR of 23.19% during the forecast period (2026-2031). Explosive capital expenditure by hyperscale operators, tightening refresh cycles driven by generative AI, and rising GPU density per rack are propelling demand. Liquid cooling has moved from experimental to mainstream, enabling 16-32 GPUs per rack and supporting thermal design points above 700 watts. Export controls on cutting-edge accelerators are re-shaping supply chains, encouraging domestic alternatives in China and propelling sovereign AI programs in India, Japan, and South Korea. Meanwhile, electricity tariffs in Europe and parts of Asia are pushing operators to design facilities with power usage effectiveness below 1.2 and to negotiate long-term renewable contracts.
Key Report Takeaways
- By deployment, data centers retained 88.21% of the revenue share in 2025, while edge installations are set to grow at a 23.59% CAGR through 2031, reflecting telecom initiatives that embed GPUs in 5G nodes to achieve sub-10 millisecond latency.
- By workload, AI training accounted for 53.47% of 2025 revenue, but AI inference is projected to expand at a 23.99% CAGR, underscoring the shift from model development to production-scale querying.
- By configuration, multi-GPU systems held a 39.71% share in 2025, yet single-GPU servers are poised to outpace them with a 23.42% CAGR as enterprises favor lower-cost inference nodes.
- By form factor, rack-mounted systems captured 46.93% revenue in 2025, whereas modular architectures are on course for a 23.79% CAGR, driven by hyperscalers adopting plug-and-play data-hall expansion.
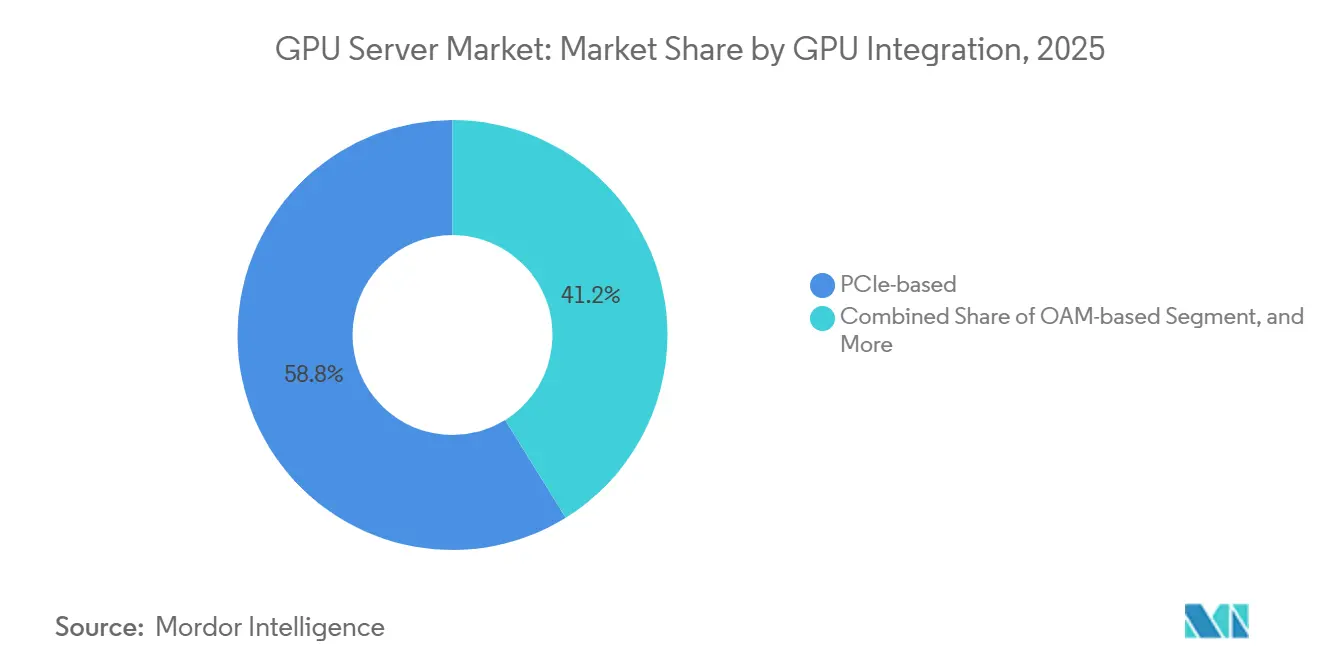
- By GPU integration, PCIe solutions accounted for 58.83% of 2025 deployments, but SXM and NVLink installations are advancing at a 23.59% CAGR, as training clusters require 1.8 terabytes per second of GPU-to-GPU bandwidth.
- By end user, cloud service providers commanded 62.73% of 2025 revenue; the enterprise segment is projected to grow at a 23.88% CAGR as Fortune 500 banks and healthcare systems internalize inference workloads.
- By geography, Asia-Pacific led with 67.63% share in 2025 and is forecast to remain the fastest growing region at 24.19% CAGR, buoyed by China’s domestic GPU push and India’s 1 gigawatt data-center expansion.
Note: Market size and forecast figures in this report are generated using Mordor Intelligence’s proprietary estimation framework, updated with the latest available data and insights as of January 2026.
Market Trends and Insights
Drivers Impact Analysis of GPU Server Market*
| Driver | (~) % Impact on CAGR Forecast | Geographic Relevance | Impact Timeline |
|---|---|---|---|
| Surging Demand for AI Training Capacity in Hyperscale Data Centers | +8.5% | Global, concentrated in North America and Asia-Pacific | Medium term (2-4 years) |
| Generative AI Boom Driving GPU Server Refresh Cycles | +6.2% | Global, led by North America and Europe | Short term (≤ 2 years) |
| Deployment of Large-Language-Model Inference at the Network Edge | +3.8% | North America, Europe, Asia-Pacific urban centers | Medium term (2-4 years) |
| Shift Toward Liquid-Cooled High-Density Racks | +2.9% | Global, early adoption in Europe and North America | Long term (≥ 4 years) |
| Rising Adoption of GPU-Accelerated Databases in FinTech and Retail | +1.4% | North America, Europe, Asia-Pacific financial hubs | Medium term (2-4 years) |
| Government-Funded Exascale HPC Programs | +0.9% | United States, China, Japan, European Union | Long term (≥ 4 years) |
| Source: Mordor Intelligence | |||
Surging Demand for AI Training Capacity in Hyperscale Data Centers
Hyperscale operators are rolling out clusters containing more than 100,000 accelerators to train frontier models with parameter counts exceeding 1 trillion, a scale that requires investment in dedicated substations and high-capacity interconnects. Meta aims to operate roughly 600,000 H100-class GPUs, while Microsoft’s USD 80 billion fiscal-2026 plan steers billions toward liquid-cooled racks.[1] Power-purchase agreements stretching 10-20 years are locking in 50-100 megawatts per campus. Sovereign AI policies in the European Union and the Middle East are driving incremental demand by requiring local hosting of sensitive training data. Collectively, these moves lift the base of training capacity, extending multi-year visibility for GPU server orders.
Generative AI Boom Driving GPU Server Refresh Cycles
Enterprises have trimmed the traditional four-year server life cycle to barely two, swapping CPU-heavy nodes for GPU accelerators to run chatbots, code assistants, and multimodal content tools. Dell reported a doubling of GPU server bookings in fiscal 2025, and HPE posted 35% growth in AI-optimized systems. The debut of NVIDIA’s Blackwell and AMD’s MI300 families, each offering 2-3× the performance per watt, creates a financial case for retiring hardware installed just 2 years ago. Enterprises also need larger memory footprints to support multimodal models, driving purchases of servers equipped with the latest GPUs.
Deployment of Large-Language-Model Inference at the Network Edge
Telecom operators are installing GPU servers at multi-access edge compute sites to keep inference latency below 10 milliseconds for real-time translation, augmented-reality navigation, and autonomous driving support. Verizon covered 15 U.S. metros in 2025; AT&T followed by adding NVIDIA T4 and L4 GPUs to its edge fabric. Strict data sovereignty rules in Europe and Asia reinforce local processing, making edge GPU nodes a compliance accelerator. Because these sites run on limited power budgets, operators favor single-GPU boards optimized for INT8 inference.
Shift Toward Liquid-Cooled High-Density Racks
Thermal design points topping 700 watts per GPU made air-cooled racks above 40 kilowatts impractical by 2025. Supermicro’s DLC-2 direct-to-chip solution reduces power consumption by up to 20%. ASUS and Meta have adopted immersive or direct liquid cooling for Blackwell-based pods exceeding 120 kilowatts per rack. Real-estate constraints in Northern Virginia and Singapore elevate rack-level density as a profit lever, and new EU energy rules mandate power usage effectiveness below 1.2. Consequently, liquid cooling has shifted from cost-avoidance to a strategic enabler of higher GPU counts per square meter.
Restraints Impact Analysis of GPU Server Market*
| Restraint | (~) % Impact on CAGR Forecast | Geographic Relevance | Impact Timeline |
|---|---|---|---|
| Supply Chain Constraints for Advanced Packaging Substrates | -3.2% | Global, acute in Asia-Pacific manufacturing hubs | Short term (≤ 2 years) |
| Escalating TCO Due to Soaring Data-Center Power Tariffs | -2.6% | Europe, select Asia-Pacific markets | Medium term (2-4 years) |
| Geopolitical Export Controls on High-End GPUs | -1.8% | China, Russia, select Middle East markets | Medium term (2-4 years) |
| Skills Gap in Parallel Programming for Heterogeneous Systems | -0.7% | Global, more pronounced in emerging markets | Long term (≥ 4 years) |
| Source: Mordor Intelligence | |||
Supply Chain Constraints for Advanced Packaging Substrates
CoWoS capacity at TSMC expanded by 50% in 2025 yet remained oversubscribed, with booking queues stretching into the first half of 2026. SK Hynix kept HBM3 lines fully allocated, forcing NVIDIA and AMD to ration flagship parts. U.S. curbs on shipments of packaging equipment to China compound the risk by centralizing production in Taiwan and South Korea. The shortfall delays enterprise deliveries by up to 9 months, stalling data center buildouts and compressing revenue visibility for OEMs.
Escalating TCO Due to Soaring Data-Center Power Tariffs
Electricity averaged EUR 0.30 (USD 0.32) per kilowatt-hour in Germany and exceeded USD 0.15 in parts of Asia in 2025, pushing an 8-GPU server consuming 6 kilowatts to incur annual power costs of USD 7,900. EU carbon pricing at EUR 90 (USD 97) per metric ton further raises indirect operating expenses.[2] Enterprises without bulk power contracts gravitate toward inference-optimized GPUs rated at 70-150 watts, curbing capital commitments to high-end accelerators.
*Our forecasts treat driver/restraint impacts as directional, not additive. The impact forecasts reflect baseline growth, mix effects, and variable interactions.
GPU Server Market Segment Analysis
By Deployment:
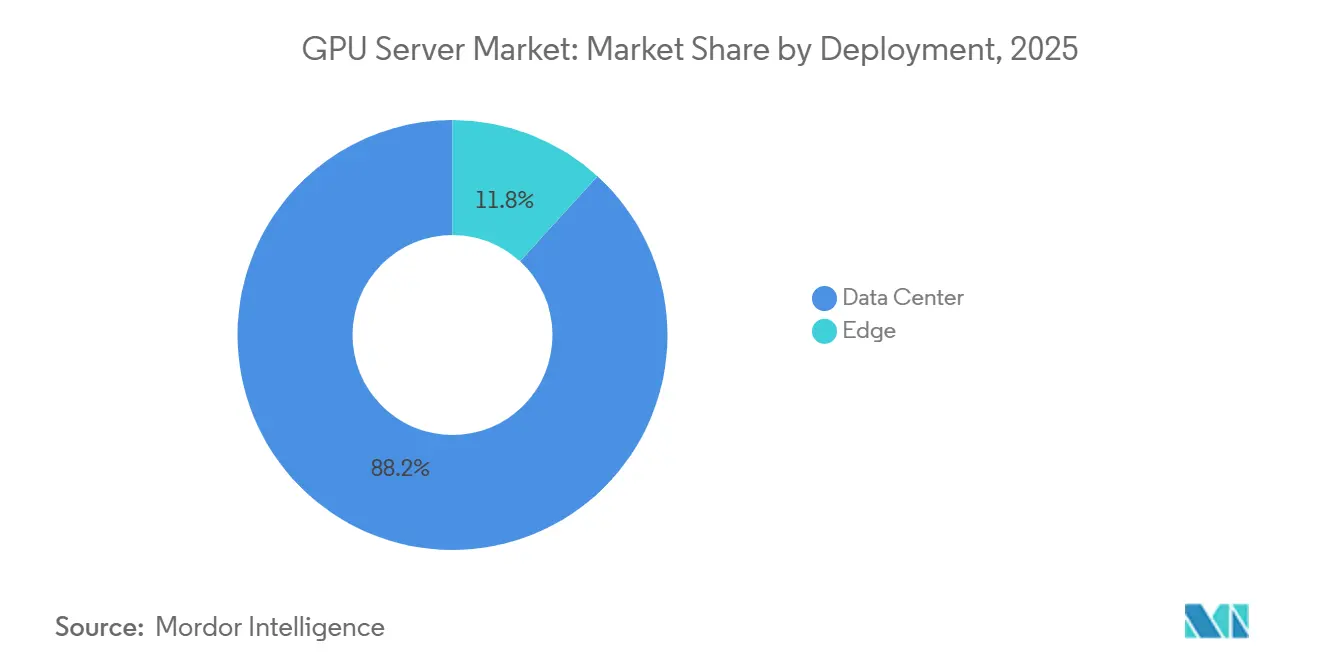
Edge Installations Gain Momentum Amid Latency MandatesEdge installations accounted for a modest slice of the GPU server market share in 2025. However, this segment is projected to grow at a robust CAGR of 23.59%, gradually reducing the dominance of data centers, which commanded 88.21% of the revenue in the base year. This growth is primarily driven by the adoption of 5G-enabled monetization models that prioritize sub-10-millisecond response times and local data processing, making edge installations increasingly relevant in the evolving market landscape. Despite this growth, data-center deployments are expected to remain the cornerstone of the GPU server market through 2031. This is largely due to hyperscale training clusters that rely on thousands of GPUs per hall to handle intensive computational tasks.
Nevertheless, the edge segment is expanding faster, particularly in regions such as South Korea, Japan, and densely populated metropolitan areas in India. These regions face challenges such as limited real estate availability and the need for user proximity, making edge installations a more viable solution. The market is witnessing the emergence of two distinct supply chains: low-power single-GPU nodes housed in rugged enclosures for edge applications, and 16-GPU liquid-cooled racks designed for core data center campuses. This differentiation highlights the diverse requirements and applications driving the GPU server market forward.
By Workload:
Inference Overtakes Training in Deployment VelocityAI inference revenue is projected to climb at a 23.99% CAGR, significantly outpacing the broader GPU server market and surpassing the growth rates of training. In 2025, training accounted for 53.47% of total revenue; however, the volume of daily inference queries for tools such as ChatGPT had already exceeded the number of training epochs by a substantial margin. This shift highlights the growing demand for inference capabilities in real-world applications, as businesses and consumers increasingly rely on AI-driven solutions for a range of tasks. The maturation of AI models is a key driver of this trend. Once a multimodal foundation model is trained, it enables the development of thousands of customer-facing applications across various industries, ranging from healthcare and finance to retail and entertainment.
These applications require low-latency inference to deliver seamless, efficient user experiences. In response to this growing demand, hardware vendors have introduced accelerator SKUs specifically optimized for INT8 and FP8 arithmetic, which deliver 2-3× the throughput per watt compared to FP16 training cards. These advancements in hardware technology are enabling more efficient and cost-effective inference operations. As a result, the GPU server market segment associated with inference is expected to surpass training revenue before the end of the decade, marking a significant shift in market dynamics and highlighting the evolving priorities within the AI ecosystem.
By Configuration:
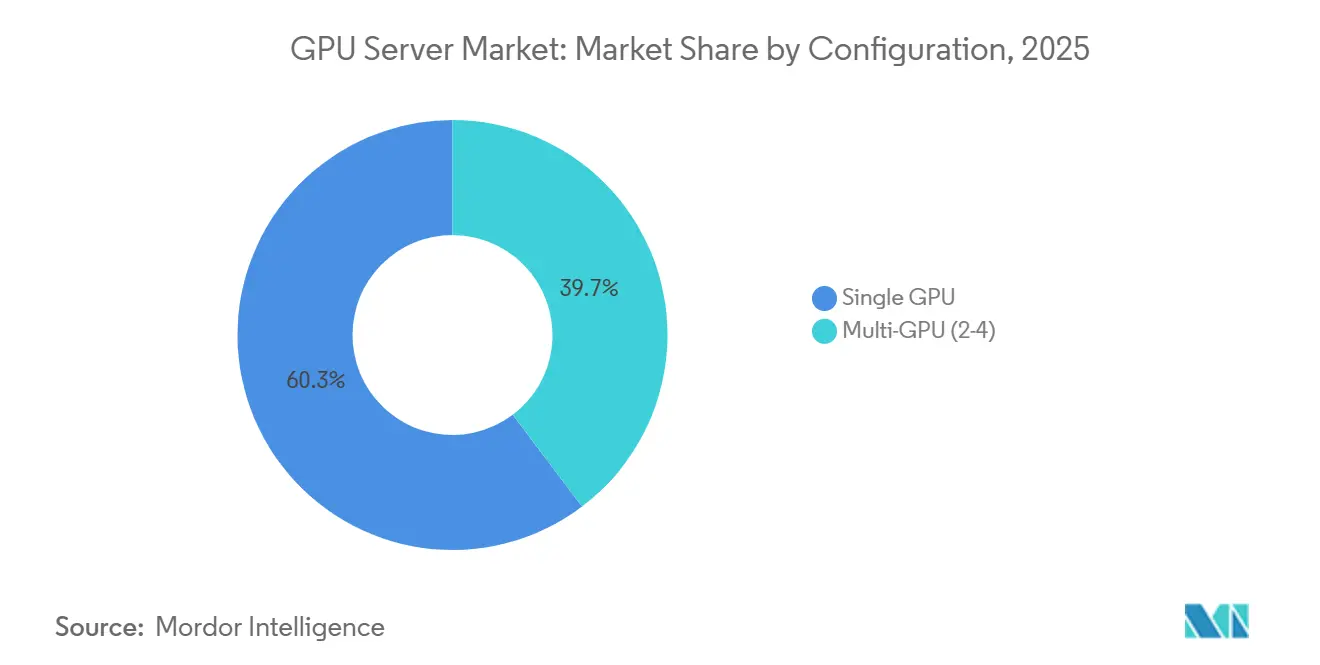
Single-GPU Servers Capture Enterprise BudgetsSingle-GPU systems are projected to grow at a 23.42% CAGR, slightly outpacing multi-GPU configurations, which held a 39.71% market share in 2025. According to Dell, single-GPU PowerEdge units accounted for 40% of GPU server shipments to small and midsize enterprises, highlighting their increasing adoption in this segment. This trend reflects the growing demand for cost-efficient and scalable solutions, particularly among smaller organizations that may not require the high computational power of multi-GPU setups. The shift toward single-GPU systems can be attributed to capital discipline and evolving enterprise needs.
For instance, a single NVIDIA L40S board costs approximately USD 9,000, whereas an 8-GPU H100 chassis can cost over USD 90,000. Enterprises are increasingly opting to parallelize inference workloads across multiple cost-effective nodes rather than relying on tightly coupled NVLink clusters. This approach allows businesses to maintain performance levels while significantly reducing capital expenditures. Additionally, single-GPU systems offer greater flexibility and ease of deployment, making them an attractive option for organizations with limited budgets or space constraints. As a result, the GPU server market share is expected to gradually shift toward lighter configurations, particularly for large-scale inference workloads, as enterprises continue to prioritize cost-effectiveness and scalability.
By Form Factor:
Modular Designs Address Scalability and Retrofit DemandRack-mounted systems accounted for 46.93% of revenue in 2025, yet modular pods are projected to grow at a 23.79% CAGR as operators increasingly prioritize faster time-to-capacity. This shift is exemplified by Meta’s Hyperion campus, which has adopted liquid-cooled prefabricated racks that can be deployed within weeks, significantly reducing installation timelines compared to traditional methods that take months. The adoption of modular pods is driven by their ability to streamline deployment processes, making them an attractive option for operators looking to scale quickly and efficiently.
Modular designs also address challenges associated with retrofitting older facilities. These self-contained GPU pods enable colocation providers to integrate them into existing data halls without requiring extensive upgrades to legacy chillers or power distribution systems. This capability makes modular pods a cost-effective and practical solution for modernizing older infrastructure. While blade servers remain a popular choice for enterprises with dense footprints, they face thermal limitations as GPU cards now consume over 400 watts. This has led to a growing preference for modular architectures, which offer better thermal management and scalability. As a result, modular architectures are increasingly favored for both greenfield developments and brownfield upgrades, positioning them to capture a larger share of the GPU server market in the coming years.
By GPU Integration:
SXM and NVLink Gain Share in Training ClustersPCIe solutions continue to dominate the market, accounting for 58.83% of installations. However, SXM and NVLink are rapidly gaining traction, with growth projected at a 23.59% CAGR. This growth is driven by the superior performance of fourth-generation NVLink, which delivers an impressive 1.8 terabytes per second of bidirectional bandwidth. In comparison, PCIe 6.0 offers significantly lower bandwidth at 128 GB/s. The increasing demand for high-speed data transfer and efficient interconnectivity in GPU servers is propelling the adoption of SXM and NVLink technologies, positioning them as strong contenders in the evolving market landscape.[3]
Hyperscalers installing 10,000-plus GPUs prize the latency and bandwidth advantages during gradient exchange across accelerators. Conversely, enterprises favor PCIe for its ease of swapping and lower cost. OAM modules emerging from the Open Compute Project promise vendor-agnostic pathways, potentially chipping away at the adoption of proprietary SXM. The integration race will remain fluid, but SXM’s role in training clusters will secure a growing slice of the GPU server market share through 2031.

By End-User:
Enterprises Accelerate On-Premises Inference DeploymentsCloud providers accounted for 62.73% of the GPU server market revenue in 2025, maintaining their dominance in the segment. However, enterprise demand is projected to grow at a significant CAGR of 23.88% during the forecast period. This growth is driven by enterprises, such as banks and healthcare systems, seeking to reduce cloud egress fees by shifting inference workloads to in-house infrastructure. Financial institutions are increasingly deploying sub-millisecond fraud detection systems, while hospitals are leveraging local imaging analysis to comply with stringent HIPAA regulations. These trends highlight the growing importance of enterprise adoption in the GPU server market.
In addition to banks and healthcare systems, other sectors such as government research labs, telecom firms, and edge operators are contributing to the diversification of the enterprise end-user mix. These organizations are adopting GPU servers to address specific operational needs, such as advanced research computations, enhanced telecommunications infrastructure, and efficient edge processing. As a result, the enterprise segment is emerging as the fastest-growing contributor to the GPU server market size during the forecast period, reflecting a shift in market dynamics and the increasing role of enterprises in driving demand for GPU server solutions.
Geography Analysis
APAC GPU Server Market
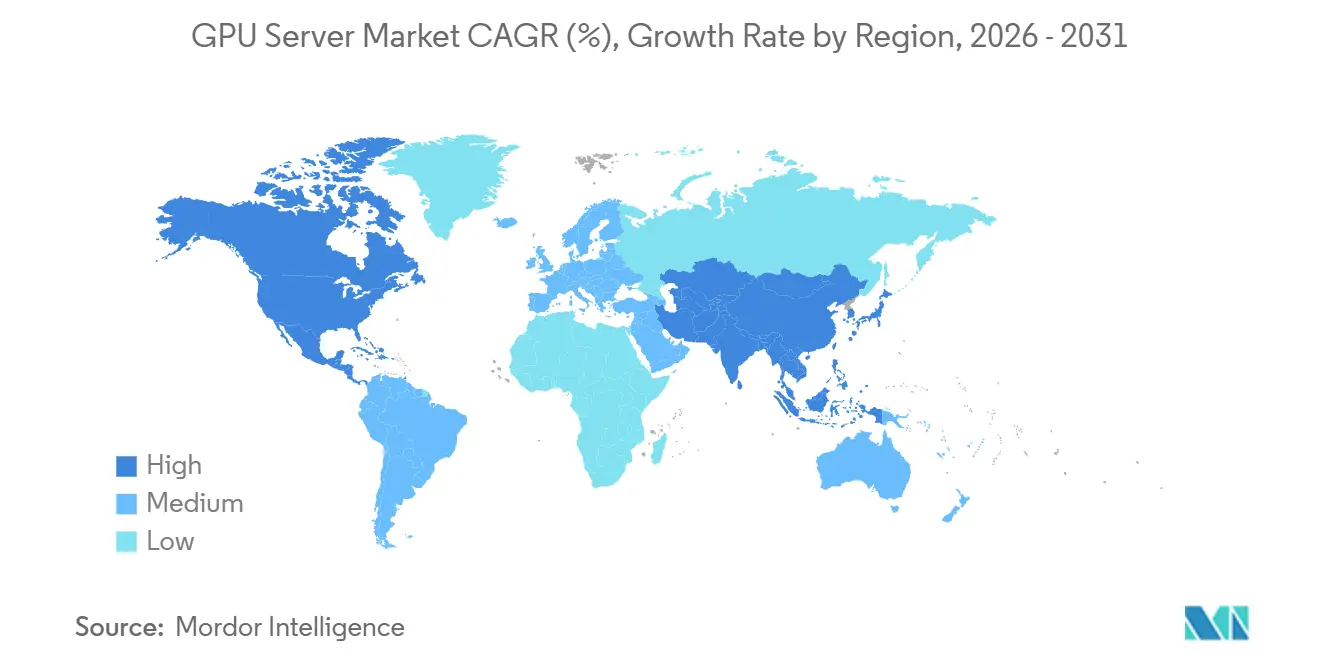
Asia-Pacific dominated the GPU server market share at 67.63% in 2025 and is projected to record a 24.19% CAGR to 2031. China’s pivot to domestic GPUs, illustrated by Huawei’s Ascend 910C shipments, partially offsets curtailed H200 imports. India’s data-center pipeline broke the 1 gigawatt mark, with Yotta committing USD 2 billion to triple GPU hall capacity by 2027. Japan earmarked JPY 100 billion (USD 690 million) for an exascale successor to Fugaku, emphasizing GPU acceleration for AI and climate research. South Korea budgeted KRW 500 billion (USD 375 million) to build a national AI compute backbone, pairing domestic HBM3 with imported GPUs.
North America GPU Server Market
North America accounted for roughly 20% of 2025 revenue, underpinned by Meta, Microsoft, and Google pledging over USD 200 billion in AI infrastructure funding through 2026. Grid constraints in Northern Virginia lengthen interconnect queues, steering new construction into the Midwest and Mountain regions where renewable capacity is available. The U.S. also incubates edge deployments, though regional uptake lags Asia-Pacific on a per-subscriber basis.
EMEA and South America GPU Server Market
Europe captured about 10% of revenue in 2025. High power tariffs averaging EUR 0.30 (USD 0.32) per kilowatt-hour and stringent carbon rules temper expansion, yet they also catalyze the adoption of liquid cooling.[4] Operators pivot to Scandinavian markets for cheaper hydro power, while sovereign AI requirements inside the EU keep a baseline of in-region GPU demand. South America, the Middle East, and Africa remained sub-5% combined; however, Saudi Arabia and the United Arab Emirates are funding sovereign AI clusters that could lift regional share in the late forecast years.
Competitive Landscape
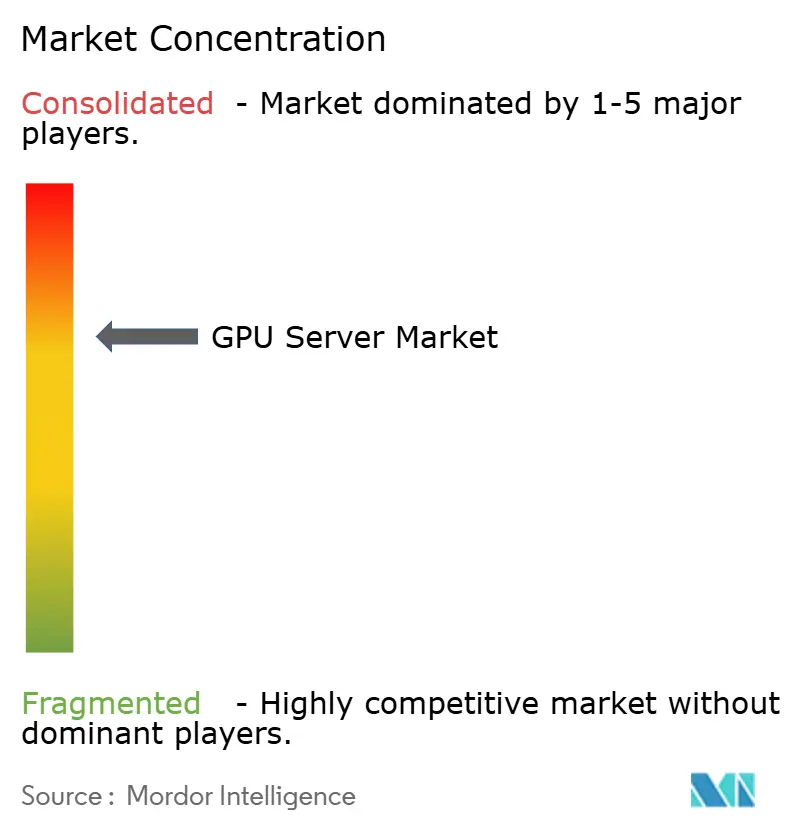
The top five OEMs, Dell Technologies, Hewlett Packard Enterprise, Supermicro, Lenovo, and Inspur, controlled about 60% of 2025 shipments, cementing a moderately consolidated field. Yet direct-sourcing hyperscalers are designing proprietary chassis, eroding branded share by 3-4 points. Liquid cooling differentiates incumbents: Supermicro and Lenovo sell integrated direct-to-chip loops at a 10-15% premium, justified by power usage effectiveness gains and footprint savings.
White-box integrators and regional specialists exploit gaps in lead-time and customization, especially for rugged edge hardware. Lambda Labs released a passive-cooled edge GPU server for telecom use, while BOXX and Quanta Cloud Technology target niche creative and hyperscale submarkets. NVIDIA’s DGX line blurs the boundaries between component vendor and system supplier, providing turnkey racks that bundle GPUs, networking, and AI software stacks, sidelining OEM value to integration and support.
Interconnect and memory architectures are the next battlegrounds. Patent data in 2024-2025 shows AMD and Intel advancing chiplet and optical interconnect designs that promise massive bandwidth lifts. Customers are receptive because a bottleneck has shifted from raw compute to memory throughput and GPU-to-GPU messaging. Market narratives suggest the GPU server market will remain moderately concentrated but fluid as component suppliers push further into full systems.
GPU Server Industry Leaders
-
Dell Technologies Inc.
-
Hewlett Packard Enterprise Company
-
Lenovo Group Limited
-
Super Micro Computer Inc.
-
Inspur Group Co., Ltd.
- *Disclaimer: Major Players sorted in no particular order
GPU Server Market Companies Covered in this Report
- Dell Technologies Inc.
- Hewlett Packard Enterprise Company
- Lenovo Group Limited
- Super Micro Computer Inc.
- Inspur Group Co. Ltd.
- Huawei Technologies Co. Ltd.
- GIGABYTE Technology Co. Ltd.
- ASUSTeK Computer Inc.
- NVIDIA Corporation
- Advanced Micro Devices Inc.
- International Business Machines Corporation
- Fujitsu Limited
- Atos SE
- Penguin Computing Inc.
- TYAN Computer Corporation
- H3C Technologies Co. Ltd.
- BOXX Technologies LLC
- Lambda Labs Inc.
- NEC Corporation
- Sugon Information Industry Co. Ltd.
Recent Industry Developments in GPU Server Market
- April 2026: NVIDIA Corporation announced general availability of the GB300 architecture, promising 50% faster training throughput versus the previous generation.
- March 2026: Supermicro unveiled a liquid-cooled 2U chassis supporting ten Blackwell GPUs, with production ramp in Q3 2026.
- February 2026: Dell Technologies won a USD 1.2 billion European supercomputing contract for climate and genomics research.
- January 2026: AMD MI325X reached general availability on Microsoft Azure and Oracle Cloud, delivering 192 GB HBM3E memory.
Global GPU Server Market Report Scope
The GPU Server Market encompasses computing server systems equipped with one or more Graphics Processing Units (GPUs) to accelerate high-performance workloads, including artificial intelligence (AI), machine learning (ML), high-performance computing (HPC), and advanced visualization applications. These servers are optimized for massively parallel processing, enabling faster computation than traditional CPU-based infrastructure.
The GPU Server Market Report is Segmented by Deployment (Data Center, Edge), Workload (AI Training, AI Inference, HPC, and Visualization), Configuration (Single GPU, and Multi-GPU), Form Factor (Rack, Blade, and Modular), GPU Integration (PCIe-based, SXM/NVLink-based, and OAM-based), End-User (Cloud Service Providers, Enterprise, Government and Research Institutions, and Telecom/Edge Operators), and Geography (North America, Europe, Asia-Pacific, South America, and Middle East and Africa). The Market Forecasts are Provided in Terms of Value (USD).
Segmentation Overview
| Data Center |
| Edge |
| AI Training |
| AI Inference |
| HPC |
| Visualization |
| Single GPU |
| Multi-GPU (2-4) |
| Rack |
| Blade |
| Modular |
| PCIe-based |
| SXM / NVLink-based |
| OAM-based |
| Cloud Service Providers (Hyperscalers) |
| Enterprise |
| Government and Research Institutions |
| Telecom / Edge Operators |
| North America | United States |
| Canada | |
| Mexico | |
| Europe | United Kingdom |
| Germany | |
| France | |
| Rest of Europe | |
| Asia-Pacific | China |
| Japan | |
| India | |
| South Korea | |
| Rest of Asia-Pacific | |
| South America | |
| Middle East and Africa |
| By Deployment | Data Center | |
| Edge | ||
| By Workload | AI Training | |
| AI Inference | ||
| HPC | ||
| Visualization | ||
| By Configuration | Single GPU | |
| Multi-GPU (2-4) | ||
| By Form Factor | Rack | |
| Blade | ||
| Modular | ||
| By GPU Integration | PCIe-based | |
| SXM / NVLink-based | ||
| OAM-based | ||
| By End-User | Cloud Service Providers (Hyperscalers) | |
| Enterprise | ||
| Government and Research Institutions | ||
| Telecom / Edge Operators | ||
| By Geography | North America | United States |
| Canada | ||
| Mexico | ||
| Europe | United Kingdom | |
| Germany | ||
| France | ||
| Rest of Europe | ||
| Asia-Pacific | China | |
| Japan | ||
| India | ||
| South Korea | ||
| Rest of Asia-Pacific | ||
| South America | ||
| Middle East and Africa | ||
Key Questions Answered in the Report
What is the current GPU server market size and projected growth to 2031?
The GPU server market size reached USD 65.72 billion in 2026 and is forecast to hit USD 186.43 billion by 2031, advancing at a 23.19% CAGR (2026-2031).
Which region is expanding fastest in GPU server deployments?
Asia-Pacific leads growth with a forecast 24.19% CAGR as China, India, and Japan boost sovereign AI and hyperscale data-center investments.
How are edge installations influencing GPU server demand?
Telecom operators embedding GPUs in 5G edge nodes are driving a 23.59% CAGR for edge installations, enabling sub-10 millisecond inference latency for real-time applications.
Why are enterprises favoring single-GPU servers?
Single-GPU nodes offer lower capital outlay and adequate performance for inference, supporting departmental AI workloads without the higher costs of multi-GPU training rigs.
What cooling technologies dominate new GPU server deployments?
Direct liquid and immersion cooling are gaining share because GPUs now exceed 700 watts, and liquid solutions can cut power usage effectiveness by up to 20%.
Which interconnect is growing fastest for large-scale training clusters?
SXM modules paired with NVIDIA NVLink are advancing at a 23.59% CAGR, driven by 1.8 terabytes per second GPU-to-GPU bandwidth that slashes training communication overhead.