Disaggregated GPU Market Size and Share
Market Overview
| Study Period | 2020 - 2031 |
|---|---|
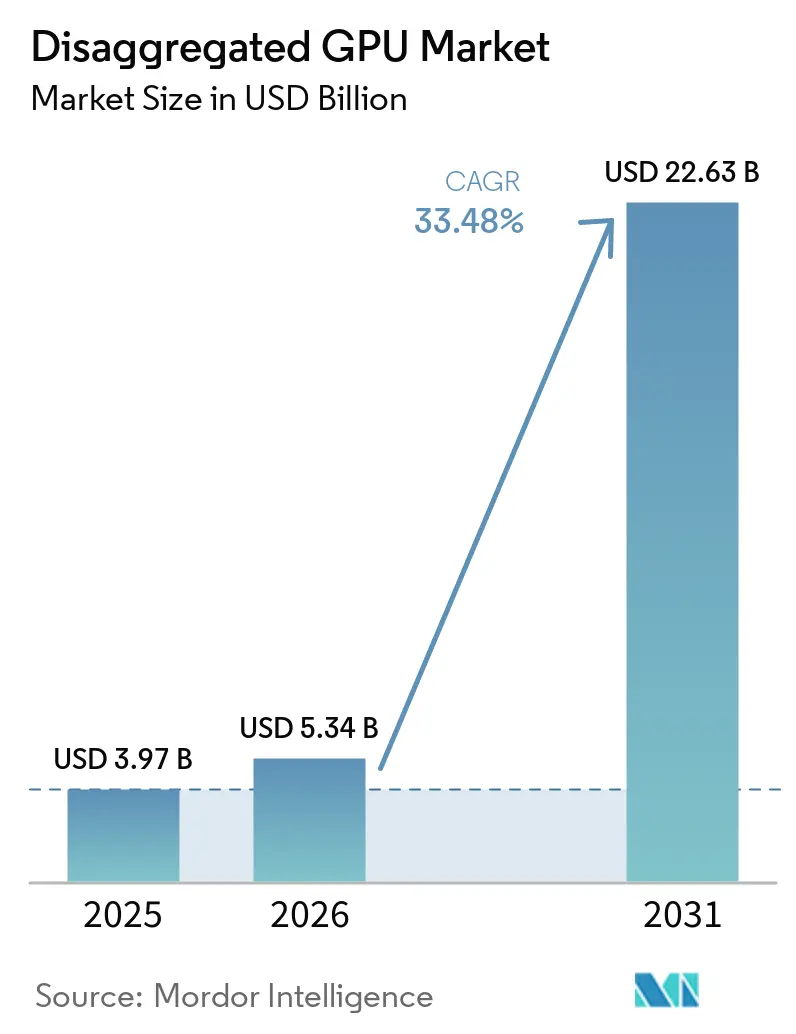
| Market Size (2026) | USD 5.34 Billion |
| Market Size (2031) | USD 22.63 Billion |
| Growth Rate (2026 - 2031) | 33.48% CAGR |
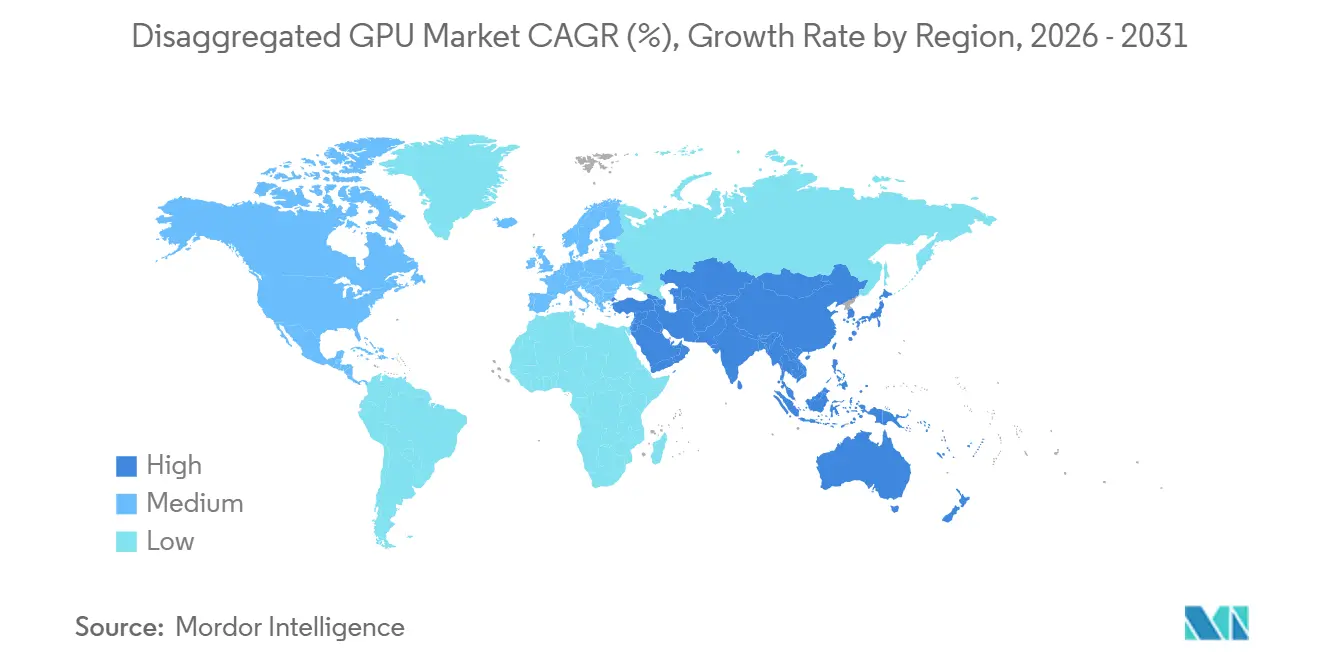
| Fastest Growing Market | Asia-Pacific |
| Largest Market | North America |
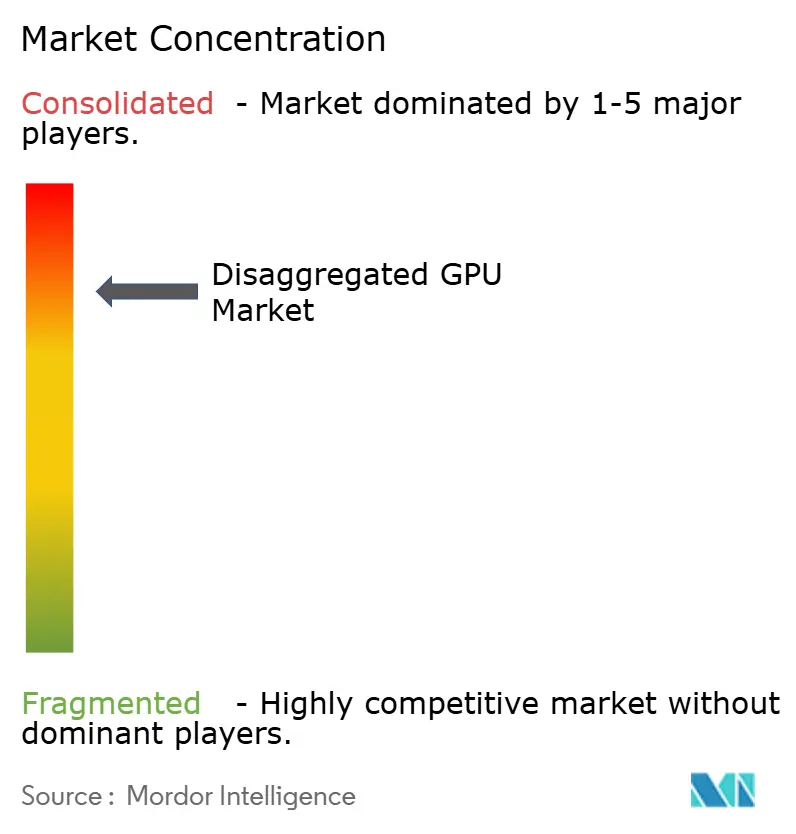
| Market Concentration | High |
Major Players *Disclaimer: Major Players sorted in no particular order Image © Mordor Intelligence. Reuse requires attribution under CC BY 4.0. | |
Disaggregated GPU Market Analysis by Mordor Intelligence
The disaggregated GPU market size is projected to be USD 3.97 billion in 2025, USD 5.34 billion in 2026, and reach USD 22.63 billion by 2031, growing at a CAGR of 33.48% from 2026 to 2031. The disaggregated GPU market is expanding as AI compute stacks move away from fixed-server designs and toward fabric-connected architectures that let operators separate GPU resources from host servers and allocate them to where demand is highest. Large capital programs by AMD and NVIDIA, along with confirmed deployments by major cloud platforms, show that the disaggregated GPU market is now tied to broad data center redesign rather than isolated hardware refresh cycles. Competitive behavior is also changing because operators are placing greater emphasis on utilization, orchestration, and rack-scale efficiency than on simply adding more accelerators. The disaggregated GPU market also benefits from the rise of agentic AI workloads, which place heavier pressure on token throughput, KV cache movement, and low-latency coordination between prefill and decode stages. At the same time, export controls, interoperability gaps, and the power density of modern AI racks are keeping growth uneven, favoring operators with purpose-built infrastructure and strong engineering depth.
Key Report Takeaways
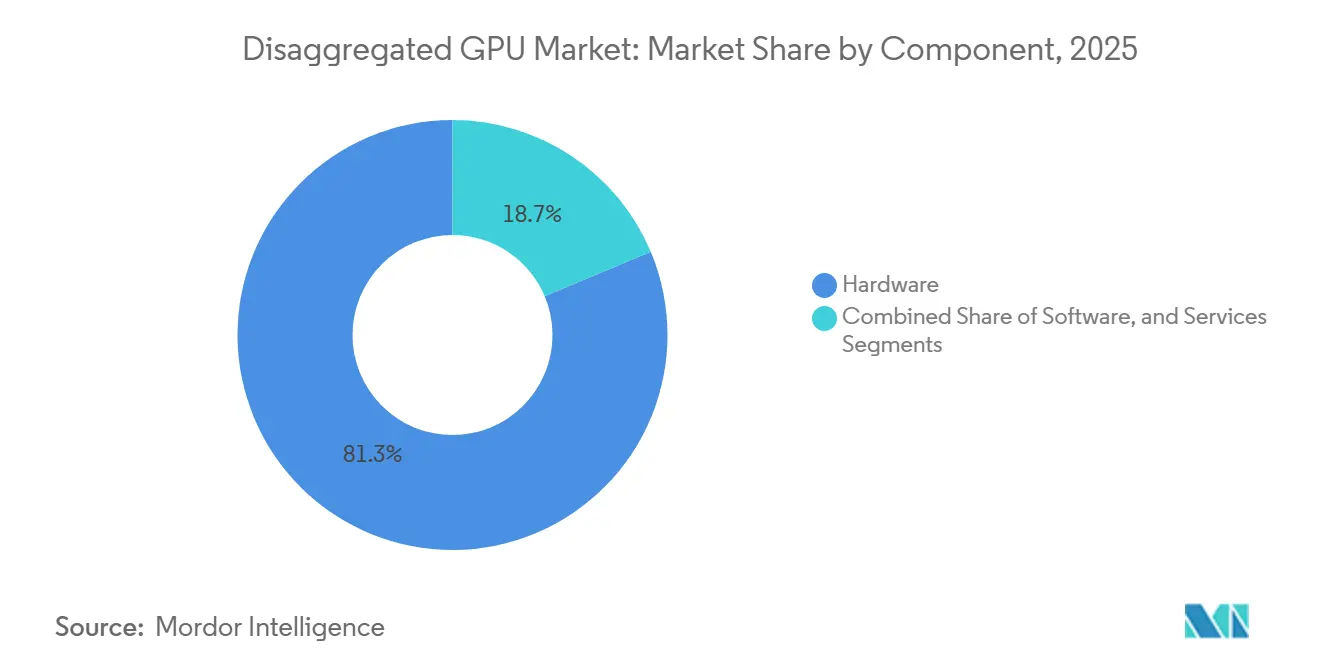
- By component, hardware led with 81.32% revenue share in 2025, while software is projected to expand at 34.08% CAGR through 2031 for the disaggregated GPU market.
- By accelerator type, NVLink/NVSwitch-based disaggregation held 44.21% share in 2025, while CXL-based disaggregation is projected to expand at 34.46% CAGR through 2031.
- By deployment mode, cloud-based deployment accounted for 61.77% of the disaggregated graphics processing unit (GPU) market in 2025 and is projected to grow at 33.87% CAGR through 2031.
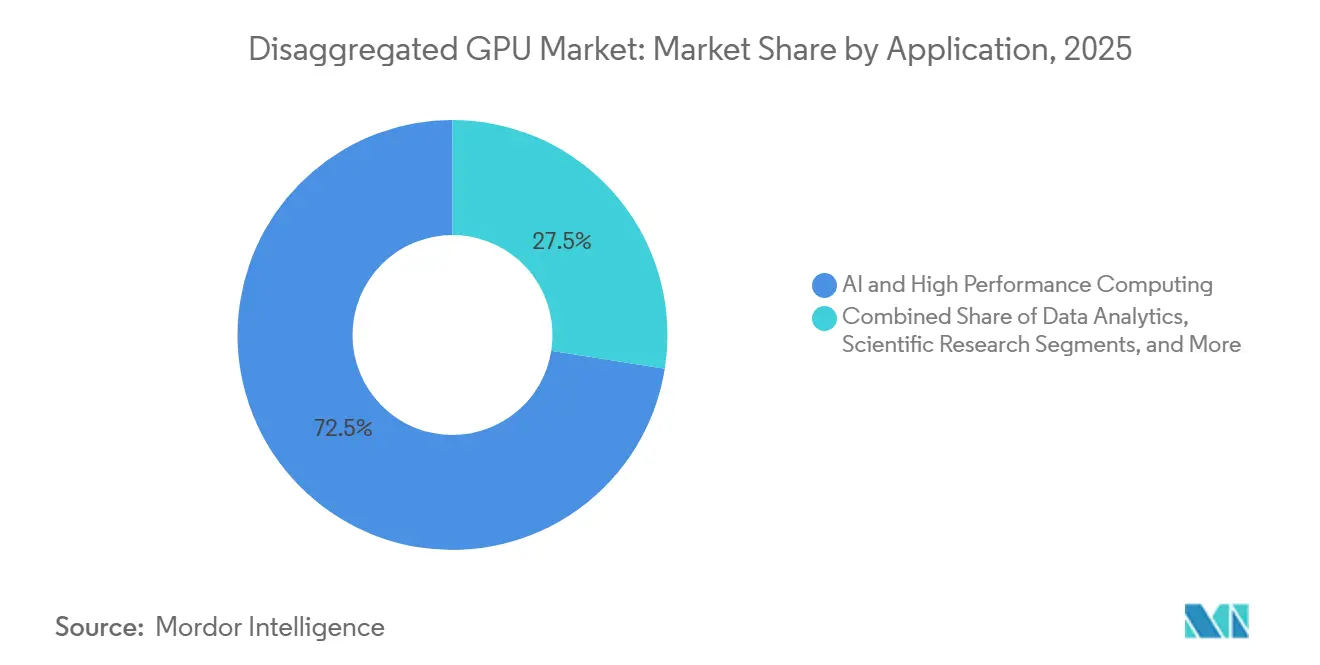
- By application, AI and high-performance computing captured 72.49% of the market in 2025, while digital twin and simulation are projected to expand at a 34.42% CAGR through 2031.
- By end user, hyperscale cloud providers held 47.63% share in 2025, while cloud service providers are projected to record the highest CAGR at 34.63% through 2031.
- By geography, North America held 52.71% of the disaggregated GPU market share in 2025, while Asia-Pacific is projected to expand at 34.39% CAGR through 2031.
Note: Market size and forecast figures in this report are generated using Mordor Intelligence’s proprietary estimation framework, updated with the latest available data and insights as of January 2026.
Global Disaggregated GPU Market Trends and Insights
Driver Impact Analysis*
| Driver | (~) % Impact on CAGR Forecast | Geographic Relevance | Impact Timeline |
|---|---|---|---|
| Rising Demand for GPU Pooling in AI Training Clusters | +10.2% | Global, concentrated in North America and Asia-Pacific hyperscale hubs | Short term (≤ 2 years) |
| Shift Toward Separated Compute and Memory Architectures | +8.5% | Global, with CXL adoption anchored in North America and East Asia | Medium term (2-4 years) |
| Expansion of Hyperscale and Cloud-Native AI Infrastructure | +7.3% | Global, with North America and Asia-Pacific leading capital deployment | Short term (≤ 2 years) |
| Power and Thermal Efficiency Gains Through Resource Disaggregation | +4.8% | Global, accelerated by EU energy regulations and Asia-Pacific power constraints | Medium term (2-4 years) |
| Faster Fleet Utilization Through Multi-Tenant GPU Allocation | +3.6% | North America, Europe, and Southeast Asia cloud corridors | Medium term (2-4 years) |
| Shorter Upgrade Cycles in Modular Data Center Architectures | +2.9% | Global, fastest in North America greenfield AI factory builds | Long term (≥ 4 years) |
| Source: Mordor Intelligence | |||
Rising Demand for GPU Pooling in AI Training Clusters
The disaggregated GPU market is gaining direct support from GPU pooling, as large AI training runs now depend on treating many physical GPUs as a single shared logical resource. NVIDIA’s sixth-generation NVLink delivered 1.8 TB/s of bidirectional bandwidth per GPU, and NVLink Switch systems supported 72 GPUs in a single NVL72 rack, delivering 130 TB/s of aggregate in-domain bandwidth, reducing the communication limits that used to separate adjacent racks into isolated compute islands.[1]NVIDIA Developer Blog, “Scaling AI Inference Performance and Flexibility With NVIDIA NVLink and NVLink Fusion,” NVIDIA Developer Blog, developer.nvidia.com That shift matters for trillion-parameter models because memory and bandwidth pressure now extend across full training clusters rather than within a single node, and the disaggregated GPU market is responding with architectures that let idle capacity join active workloads much more quickly. Agentic AI is adding another layer of demand, since prefill stages are compute-heavy while decode stages are memory-bandwidth-heavy, and this pattern requires pools to be reassigned in seconds rather than through slower manual scheduling cycles. AWS demonstrated this operating model in production using llm-d and the NVIDIA Inference Xfer Library on Blackwell nodes, where disaggregated inference improved throughput by 70% at high concurrency.
Shift Toward Separated Compute and Memory Architectures
The disaggregated GPU market is also moving forward as operators separate compute from local memory and treat memory capacity as a pooled infrastructure layer. Research published in Tsinghua Science and Technology described CXL-based memory disaggregation as a major architectural step for intelligent computing centers, because shared memory pools can be reached by multiple compute nodes through standard load and store operations. ByteDance researchers extended this direction by demonstrating a 768 GB shared memory pool built from Micron CXL Type-3 cards and a TITAN-II CXL switch, enabling collective GPU communication across 3 nodes with NVIDIA H100 GPUs and no application code changes. This matters because long-context inference exceeds 1 million tokens and KV cache demand exceeds the HBM available on each accelerator, making adding pooled memory more practical than replacing whole GPU fleets. The disaggregated GPU market, therefore, gains from CXL not only as a technical option but also as an economic path for operators that need more memory capacity without forcing a full silicon refresh.
Expansion of Hyperscale and Cloud-Native AI Infrastructure
The disaggregated GPU market is being pushed higher by the scale of hyperscale and cloud-native AI infrastructure spending, which has broadened from isolated pilot projects into rack-scale and multi-site rollouts. AMD announced more than USD 10 billion in investments in the Taiwan ecosystem in May 2026 to scale its Helios rack-scale platform through ODM partners, including Sanmina, Wiwynn, Wistron, and Inventec, with multi-gigawatt deployments targeted for the second half of 2026. Google Cloud also stated that its Virgo network fabric was designed to connect up to 80,000 NVIDIA Vera Rubin NVL72 GPUs in a single data center and more than 960,000 GPUs across multiple sites, underscoring how the disaggregated GPU market is becoming a foundation for data center scale-out rather than a niche architecture. At the same time, custom silicon programs at AWS, Google, and Microsoft are not eliminating the need for disaggregated GPU systems, because multi-vendor infrastructure is emerging alongside them. Intel and SambaNova demonstrated the model in 2026 with a heterogeneous inference stack, where Intel Xeon 6 handled orchestration, SambaNova RDUs handled decode, and NVIDIA Blackwell GPUs handled prefill from a single production data center.
Power And Thermal Efficiency Gains Through Resource Disaggregation
The disaggregated GPU market is also being shaped by power-delivery and cooling constraints, which now influence architecture decisions as much as raw compute demand. The Open Compute Project’s Diablo specification, contributed by Google, Meta, and Microsoft in October 2025, defined disaggregated power rack designs that support IT racks from 100 kilowatts to 1 megawatt using 400 VDC or 800 VDC delivery. NVIDIA added another efficiency lever in December 2025 with Blackwell B200 power profiles, delivering up to 15% energy savings with no more than 3% performance impact, enabling up to 13% higher throughput in fixed-power facilities. Phase-aware disaggregated inference further improves the picture, because prefill stages draw peak power while decode stages have lower wattage needs and can be managed differently across separate resource pools. Research on the BiScale architecture showed that coordinated DVFS across disaggregated prefill and decode tiers reduced decode energy by up to 48% while meeting latency service targets, which strengthens the operating case for the disaggregated graphics processing unit (GPU) market, where energy limits and utilization targets now move together.
Restraint Impact Analysis*
| Restraint | (~) % Impact on CAGR Forecast | Geographic Relevance | Impact Timeline |
|---|---|---|---|
| High Interconnect and Fabric Integration Complexity | -1.8% | Global, most acute in multi-vendor deployments outside North America | Short term (≤ 2 years) |
| Software Orchestration Fragmentation Across GPU Stacks | -1.4% | Global, particularly limiting in enterprise and emerging market deployments | Medium term (2-4 years) |
| Capital Intensity of Retrofitting Legacy Data Centers | -1.1% | Europe and South America, where legacy colocation stock is substantial | Medium term (2-4 years) |
| Latency Tradeoffs in Remote Memory and Disaggregated Access | -0.8% | Global, most critical for latency-sensitive inference workloads | Short term (≤ 2 years) |
| Source: Mordor Intelligence | |||
High Interconnect And Fabric Integration Complexity
The disaggregated GPU market still faces a significant integration barrier because many deployments must coordinate NVLink, PCIe, InfiniBand, Ethernet, and CXL within a single cluster. Research presented at HotNets 2025 showed that effective path management across intra-host heterogeneous interconnects requires simultaneous coordination of PCIe switches, GPU fabric controllers, RDMA NICs, and Ethernet switches, and current software stacks do not fully abstract that complexity. NVIDIA’s NVLink Fusion reduced part of that problem by letting custom CPUs from MediaTek, Marvell, Qualcomm, and Fujitsu connect natively with NVIDIA GPUs, but that move expanded a proprietary path rather than creating a fully neutral multi-vendor fabric. The Ultra Accelerator Link standard is meant to offer a vendor-neutral alternative, yet the input indicates that production hardware was not expected until late 2026 and broad deployments were likely to stretch into 2027. The disaggregated GPU market also faces a regional interoperability ceiling in China, where domestic accelerator ecosystems use incompatible communication protocols, limiting the practical pooling benefits operators can achieve at scale.
Software Orchestration Fragmentation Across GPU Stacks
The lack of a unified orchestration layer across heterogeneous GPU environments also restrains the disaggregated GPU market. Research on fragmentation-aware scheduling showed that multi-tenant schedulers still need to reconcile different memory-isolation and partitioning approaches across vendor stacks, thereby increasing integration effort and extending deployment timelines. Work presented at USENIX ATC 2025 showed that spatio-temporal GPU orchestration at the kernel level depends on detailed control over vendor-specific command buffers and context management, with no standardized cross-vendor logic fabric or scheduling semantics in place today.[2]Shulai Zhang et al., “Efficient Performance-Aware GPU Sharing With Compatibility and Isolation Through Kernel Space Interception,” USENIX ATC 2025, usenix.org That makes fleet-wide disaggregation easier for hyperscalers with large platform engineering teams and much harder for enterprise buyers that manage mixed GPU estates and need a common operational layer. The disaggregated GPU market is therefore likely to continue favoring the largest operators in the medium term, because standards work is still in its early stages and proprietary ecosystems have little incentive to converge quickly.
*Our forecasts treat driver/restraint impacts as directional, not additive. The impact forecasts reflect baseline growth, mix effects, and variable interactions.
Segment Analysis
By Component: Hardware Leads Early Spending While Software Gains Recurring Weight
Hardware accounted for 81.32% of the disaggregated GPU market in 2025, reflecting the high upfront costs of interconnect fabrics, switch trays, memory modules, and rack-scale compute systems. Each Vera Rubin NVL72 rack combined 72 Blackwell GPUs, 36 Vera CPUs, NVLink switch chips, BlueField-4 DPUs, and Spectrum-X Ethernet networking into a single fabric-based capital unit, keeping early spending in the disaggregated GPU market concentrated in large hyperscale procurement cycles. That procurement model matters because buyers are not purchasing isolated cards or servers; they are committing to tightly integrated platforms that bundle compute, networking, and management capabilities within a single deployment event. The disaggregated GPU market, therefore, shows a hardware-heavy revenue mix in its current phase, especially as hyperscalers build new AI capacity in full racks rather than through gradual node-by-node additions. Services remained the smallest component layer, yet integration, managed operations, and GPU-as-a-service delivery still carried attractive margin potential for system integrators and specialist cloud operators.
Software is projected to record the fastest 34.08% CAGR from 2026 to 2031 in the disaggregated GPU market, as orchestration layers, isolation tools, and inference frameworks increasingly determine the value operators extract from each GPU. NVIDIA Dynamo separated prefill and decode assignments to lift factory-scale utilization, and that design set a reference point that open-source alternatives such as llm-d now need to match for enterprise deployments. This changes the revenue pattern of the disaggregated GPU industry, because software upgrades can continue even when hardware refresh cycles slow or when installed fabric remains in place. Operators that installed disaggregated hardware in 2024 and 2025 are likely to add new orchestration layers before replacing physical interconnect assets, creating a path for recurring software revenue that is less tied to rack replacement timing. Over time, that dynamic should give software a larger role in the disaggregated GPU market even if hardware continues to anchor absolute spending.


By Accelerator Type: NVLink Sets The Current Baseline While CXL Broadens The Architecture
NVLink/NVSwitch-based disaggregation held 44.21% of the disaggregated GPU market share in 2025, reflecting NVIDIA’s strong position in AI training fabrics and the installed preference for tightly coupled GPU communication. The sixth-generation NVLink delivered 1.8 TB/s per GPU in 2024, and newer NVLink Switch systems enabled all-to-all communication across 72 GPUs with 130 TB/s of aggregate bandwidth, giving the disaggregated GPU market a high-performance option for scale-up clusters that need dense local communication. PCIe-based disaggregation maintained a durable role as the baseline fabric in many multi-GPU systems, offering broad compatibility without the same level of proprietary dependence. InfiniBand and Ethernet-based approaches continued to matter in scale-out settings, and Ethernet in particular gained relevance where operators wanted to extend large AI clusters by building on existing networking investments. That split means the disaggregated GPU market is not moving toward one universal fabric, but toward a layered model in which performance, openness, and installed infrastructure each influence the final architecture.
CXL-based disaggregation is projected to expand at a 34.46% CAGR through 2031, supported by CXL 3.0 memory pooling and the CXL 4.0 specification, which doubled bandwidth to 128 GT/s via PCIe 7.0 physical layers and introduced bundled ports for much higher total throughput. Research in Tsinghua Science and Technology showed that CXL memory disaggregation and GPU compute disaggregation serve different layers of the stack, which suggests that future deployments in the disaggregated GPU market will combine them rather than force a choice between them. Samsung Electronics is developing its Pangea CXL memory platform with Marvell and Liquid AI to expand GPU memory, where HBM limits can restrict inference batch sizes and working context depth. In practice, NVLink is well-suited to tightly coupled GPU-to-GPU communication inside the rack, while CXL extends memory capacity and memory sharing across nodes and broader system domains. That complementary relationship should help the disaggregated GPU market mature into more composable architectures without reducing the role of high-bandwidth GPU fabrics already established in production clusters.
By Deployment Mode: Cloud Delivery Shapes Standards While On-Premise Holds Strategic Demand
Cloud-based deployment held 61.77% share of the disaggregated GPU market size in 2025, and the same segment is projected to post the fastest 33.87% CAGR through 2031. AWS introduced disaggregated inference on SageMaker HyperPod and Amazon EKS through llm-d and NVIDIA Inference Xfer Library, using Elastic Fabric Adapter to move KV cache data between disaggregated nodes and delivering up to 70% higher tokens per second on Blackwell-based instances than standard deployments. Google Cloud added another signal when it said Virgo can connect up to 80,000 Vera Rubin NVL72 GPUs in a single data center and extend past 960,000 GPUs across multiple sites, reinforcing the role of hyperscalers in setting the operating model for the disaggregated graphics processing unit (GPU) market. The advantage of cloud delivery is not only scale, but also the ability to hide cooling, fabric configuration, and orchestration complexity behind managed services. That is why the disaggregated GPU market continues to tilt toward cloud platforms, especially for buyers that need access to advanced AI capacity but do not want to build and operate specialized infrastructure on their own.
On-premises deployment still matters in the disaggregated GPU market for enterprises and public-sector organizations that cannot move sensitive workloads into shared public cloud environments. The input shows that enterprise buyers are more price-sensitive than hyperscalers and usually adopt disaggregated architectures after cloud operators have validated them at scale, which pushes on-premise demand onto a slower but still important path. Government and defense organizations form a separate on-premise cohort, because sovereign AI programs and national security rules often require air-gapped or jurisdiction-bound compute environments. Data localization requirements in the European Union and parts of Asia-Pacific also support a floor for dedicated infrastructure, even as cloud remains the larger and faster-growing mode. As a result, the disaggregated GPU market is likely to maintain a dual structure, with cloud platforms setting the pace of innovation while on-prem deployments remain important when compliance, control, or workload sensitivity limit shared access.
By Application: AI and HPC Drive Present Demand While Simulation Builds New Volume
AI and high-performance computing accounted for 72.49% of the disaggregated GPU market in 2025, making it the primary driver of current deployments. The largest language models and reasoning systems require memory capacity and interconnect performance that exceed the limits of isolated nodes, so the disaggregated GPU market has developed around pooling and fabric coordination as basic requirements for frontier training and inference. NVIDIA stated that Vera Rubin NVL72 can deliver 10x agent throughput compared with the prior Grace Blackwell generation, which helps explain why hyperscalers are deploying these platforms for both training clusters and reasoning-heavy inference environments. Scientific research also remains part of this segment, because genomics, climate modeling, and particle physics need burst-ready compute that can be provisioned at scale without leaving expensive GPU resources idle between jobs. This mix keeps the disaggregated GPU market closely tied to workloads where utilization, memory sharing, and interconnect efficiency directly affect scientific output or model performance.
Digital twin and simulation are projected to advance at a 34.42% CAGR from 2026 to 2031, reflecting the wider use of GPU-accelerated physics models in industrial operations, design validation, and autonomous system training. The disaggregated GPU market benefits here because many simulation workloads need short periods of very high compute density, which makes pooled resources more economical than static server allocations. NVIDIA said its DSX platform can cut AI factory deployment time from months to days and speed time to first revenue, and that commercial model is beginning to influence how industrial users think about scalable simulation infrastructure. Data analytics, rendering, and visualization remain established use cases with steadier growth, while rendering benefits from real-time GPU acceleration in immersive industrial interfaces that demand low frame latency. Together, these patterns broaden the disaggregated GPU market beyond frontier AI training and increase demand from buyers that value flexible capacity for operational digital workloads.
By End User: Hyperscalers Hold The Largest Base While Specialist Clouds Expand Faster
Hyperscale cloud providers held 47.63% share in 2025, giving them the largest position in the disaggregated GPU market and a strong influence over architecture standards, deployment timing, and software choices. AWS, Google Cloud, Microsoft Azure, and Oracle Cloud Infrastructure were identified as second-half 2026 deployers of NVIDIA Vera Rubin NVL72 systems, which reinforces the extent to which the disaggregated GPU market still depends on hyperscalers for early volume adoption. Their first-mover role goes beyond purchasing power, because they also shape how orchestration, resource pooling, and managed AI services are packaged for downstream customers. Enterprises are becoming a larger adopter group, yet they usually approach deployments with tighter budget controls, stronger sensitivity to integration risk, and a preference for dedicated cloud or on-premise configurations where data exposure can be limited. Government and defense buyers also remain relevant, as long procurement cycles can still yield large contract values when sovereign compute programs move forward.
Cloud service providers are projected to record the fastest 34.63% CAGR from 2026 to 2031 in the disaggregated GPU market, as mid-tier operators build GPU-as-a-service platforms around specialization and price flexibility. NVIDIA identified CoreWeave, Lambda, Nebius, and Nscale among the early adopters of Vera Rubin and Spectrum-X Ethernet Photonics, demonstrating how specialist clouds are expanding capacity to address training and inference demand beyond the largest hyperscaler platforms. Their position is promising but also exposed, because falling per-token costs at hyperscalers can compress rental margins and force smaller providers to differentiate through managed services and application-layer support. Telecommunications providers are also emerging as edge-focused users of disaggregated GPU systems, while research and academic institutions play a smaller revenue role but help lower software barriers through open-source orchestration work such as llm-d and related Kubernetes-native tooling. That combination of dominant hyperscalers, fast-moving specialist clouds, and targeted public and private buyers gives the disaggregated GPU market a broadening demand base without reducing its dependence on a few very large operators.
Geography Analysis
North America held a 52.71% share in 2025, giving it the largest regional share in the disaggregated GPU market and reflecting the depth of hyperscale buildouts across the US. AWS, Google Cloud, Microsoft Azure, and Oracle Cloud Infrastructure were all named as second-half 2026 deployers of NVIDIA Vera Rubin NVL72 systems, and that concentration of leading buyers continues to anchor the disaggregated GPU market in the region. North America also benefits from a dense hardware ecosystem, major AI research activity, and a mature GPU cloud layer, including providers such as CoreWeave, Lambda, and Nscale. NVIDIA’s September 2025 collaboration with Intel to develop custom AI data center CPUs based on NVLink and x86 deepened regional supply chains and enabled stronger integration between orchestration CPUs and GPU fabrics.[3]Intel Corporation, “Intel and NVIDIA to Jointly Develop AI Infrastructure and Personal Computing Products,” Intel Newsroom, newsroom.intel.com Canada adds support through proximity to US hyperscale demand and favorable power economics, while South America remains at an earlier stage and is tied more to hyperscale availability zones in Brazil and Colombia than to broad on-premise deployment.
Europe held a meaningful but smaller share of the disaggregated GPU market, with Germany, the United Kingdom, and France as the main deployment centers in user input. The European Union Energy Efficiency Directive requires power usage effectiveness reporting for data centers with an IT load above 500 kW, which supports more efficient, disaggregated designs and requires operators to demonstrate measurable facility performance. Germany’s automotive and precision manufacturing base supports demand for digital twin and physics simulation workloads, where burst compute is easier to justify through pooled infrastructure than through fixed server allocations. The United Kingdom contributes through an active GPU cloud segment, while France and Italy are extending sovereign AI compute programs that incorporate disaggregated GPU capacity.
Asia-Pacific is projected to expand at a 34.39% CAGR between 2026 and 2031, giving the region the fastest growth rate in the disaggregated GPU market during the forecast period. The region is being driven by China’s hyperscale AI spending, South Korea’s vertically integrated memory supply chain, Japan’s manufacturing and automation needs, and public AI infrastructure programs in India and Singapore. China is building domestic disaggregated architectures around proprietary interconnect approaches, creating a split regional structure in which Chinese stacks differ from those used elsewhere in the disaggregated GPU market. South Korea benefits from SK Hynix’s position in HBM3e output, which helps domestic operators secure earlier access to memory subsystems and supports faster data center capital deployment. India is also moving quickly as government-backed AI initiatives and hyperscale cloud zones expand, while the Middle East and Africa remain earlier in development but are gaining support from sovereign AI investment programs in the UAE and Saudi Arabia.

Competitive Landscape
The disaggregated GPU market remains highly concentrated in the hardware interconnect layer, while software and services are much more fragmented across orchestration vendors, GPU cloud providers, and integration specialists. NVIDIA continues to set the pace in the disaggregated GPU market because its NVLink ecosystem, rack-scale platforms, and production reach give it a strong advantage where buyers need proven scale-up fabrics and coordinated hardware stacks. Its May 2025 launch of NVLink Fusion was a notable strategic move because it allowed custom silicon from MediaTek, Marvell, Qualcomm, Fujitsu, and others to connect natively with NVIDIA GPUs and widened the addressable ecosystem for semi-custom AI infrastructure. That move did not reduce NVIDIA's dependence on proprietary technology, but it made NVIDIA’s fabric more central to system design across a wider set of partners. In practical terms, the disaggregated GPU market still gives NVIDIA the strongest position where hardware performance and ecosystem maturity matter most.
AMD is building its position in the disaggregated graphics processing unit (GPU) market through a different route that combines the Helios rack-scale platform with the open ROCm software stack and a broader supplier base. Its May 2026 decision to commit more than USD 10 billion to the Taiwan ecosystem was another major strategic move, because it signaled a multi-year effort to narrow the hardware production gap and strengthen rack-scale execution through regional manufacturing partners.[4]Advanced Micro Devices, Inc., “AMD Announces More Than USD 10 Billion in Taiwan Ecosystem Investments to Accelerate AI Infrastructure,” AMD Investor Relations, ir.amd.com Intel’s role is more asymmetric, since it is not leading the GPU fabric layer but is finding value in the orchestration CPU position inside heterogeneous systems. That approach was evident at Computex 2026, where Intel Xeon 6 enabled orchestration across a three-vendor disaggregated inference stack with SambaNova and NVIDIA in a single commercial deployment example. These moves show that the disaggregated GPU market is competitive at the platform level even though the core hardware fabric remains concentrated.
The largest open area in the disaggregated GPU market is multi-vendor orchestration, because there is still no widely adopted commercial platform that consistently schedules workloads across NVLink, CXL, InfiniBand, and Ethernet. Emerging players such as Exostellar, working with Vultr, are targeting that gap with workload-level orchestration across geographically distributed, heterogeneous GPU fleets, while server vendors such as Dell Technologies, Hewlett Packard Enterprise, Supermicro, and Lenovo compete through system integration, liquid cooling, and managed infrastructure services. Standards activity also matters because any path toward more open disaggregated fabrics would affect how enterprises and governments evaluate vendor lock-in and long-term procurement. For now, the disaggregated GPU market supports a layered competitive structure where a small number of hardware leaders influence the core architecture, while a much wider field competes to control deployment, orchestration, and service delivery.
Disaggregated GPU Industry Leaders
NVIDIA Corporation
Advanced Micro Devices, Inc.
Intel Corporation
Qualcomm Incorporated
Apple Inc.
- *Disclaimer: Major Players sorted in no particular order

Recent Industry Developments
- June 2026: Amazon Web Services announced the general availability of EC2 G7 instances powered by NVIDIA RTX PRO 4500 Blackwell Server Edition GPUs, delivering up to 4.6x the AI inference performance of the prior G6 generation. Instances feature up to 700 Gbps of Elastic Fabric Adapter networking bandwidth, supporting disaggregated AI inference, language translation, and large-scale image analysis workloads.
- May 2026: NVIDIA announced the Vera Rubin platform entered full production across 350 factories in 30 countries, with AWS, Google Cloud, Microsoft Azure, and Oracle Cloud Infrastructure as confirmed second-half 2026 deployers. The platform introduced Spectrum-X Ethernet Photonics, the industry's first co-packaged-optics Ethernet switches in production, delivering 5x power efficiency over traditional transceivers and enabling million-GPU AI factory deployments.
- May 2026: AMD announced USD 10 billion in Taiwan ecosystem investments to scale the Helios rack-scale platform featuring MI450X GPUs and 6th Gen EPYC Venice CPUs with industry-first 2.5D elevated fanout bridge packaging. ODM partners Sanmina, Wiwynn, Wistron, and Inventec are scaling production for multi-gigawatt deployments targeted in second-half 2026.
- May 2026: Vector Core Compute, backed by Vista Equity Partners and Cambium Capital, commercially launched the first disaggregated inference system at Computex 2026, deploying Intel Xeon 6 for orchestration, SambaNova SN40 RDUs for decode, and NVIDIA Blackwell GPUs for prefill from a Los Angeles data center. Together.ai was announced as the first commercial customer.


Global Disaggregated GPU Market Report Scope
The Disaggregated GPU Market comprises hardware, software, and services that enable graphics processing units (GPUs) to be decoupled from traditional server architectures and dynamically allocated across multiple compute resources through high-speed interconnects and network fabrics. Disaggregated GPU architectures allow organizations to pool, share, virtualize, and orchestrate GPU resources independently of physical server boundaries, improving resource utilization, scalability, operational flexibility, and infrastructure efficiency across data center, cloud, and high-performance computing environments.
The Disaggregated GPU Market Report is Segmented by Component (Hardware, Software, and Services), Accelerator Type (PCIe-Based Disaggregation, NVLink/NVSwitch-Based Disaggregation, Ethernet Fabric-Based Disaggregation, InfiniBand Fabric-Based Disaggregation, and CXL-Based Disaggregation), Deployment Mode (On-Premise, and Cloud), Application (AI and High Performance Computing, Data Analytics, Digital Twin and Simulation, Rendering and Visualization, and Scientific Research), End User (Hyperscale Cloud Providers, Cloud Service Providers, Enterprises, Government and Defense Organizations, Research and Academic Institutions, Telecommunications Providers) and Geography (North America, Europe, Asia-Pacific, South America, and Middle East and Africa). The Market Forecasts are Provided in Terms of Value (USD).
| Hardware |
| Software |
| Services |
| PCIe-Based Disaggregation |
| NVLink/NVSwitch-Based Disaggregation |
| Ethernet Fabric-Based Disaggregation |
| InfiniBand Fabric-Based Disaggregation |
| CXL-Based Disaggregation |
| On-Premise |
| Cloud-Based |
| AI and High Performance Computing |
| Data Analytics |
| Digital Twin and Simulation |
| Rendering and Visualization |
| Scientific Research |
| Hyperscale Cloud Providers |
| Cloud Service Providers |
| Enterprises |
| Government and Defense Organizations |
| Research and Academic Institutions |
| Telecommunications Providers |
| North America | United States |
| Canada | |
| Mexico | |
| Europe | Germany |
| United Kingdom | |
| France | |
| Italy | |
| Rest of Europe | |
| Asia-Pacific | China |
| Japan | |
| South Korea | |
| India | |
| Southeast Asia | |
| Rest of Asia-Pacific | |
| South America | |
| Middle East and Africa |
| By Component | Hardware | |
| Software | ||
| Services | ||
| By Accelerator Type | PCIe-Based Disaggregation | |
| NVLink/NVSwitch-Based Disaggregation | ||
| Ethernet Fabric-Based Disaggregation | ||
| InfiniBand Fabric-Based Disaggregation | ||
| CXL-Based Disaggregation | ||
| By Deployment Model | On-Premise | |
| Cloud-Based | ||
| By Application | AI and High Performance Computing | |
| Data Analytics | ||
| Digital Twin and Simulation | ||
| Rendering and Visualization | ||
| Scientific Research | ||
| By End-User | Hyperscale Cloud Providers | |
| Cloud Service Providers | ||
| Enterprises | ||
| Government and Defense Organizations | ||
| Research and Academic Institutions | ||
| Telecommunications Providers | ||
| By Geography | North America | United States |
| Canada | ||
| Mexico | ||
| Europe | Germany | |
| United Kingdom | ||
| France | ||
| Italy | ||
| Rest of Europe | ||
| Asia-Pacific | China | |
| Japan | ||
| South Korea | ||
| India | ||
| Southeast Asia | ||
| Rest of Asia-Pacific | ||
| South America | ||
| Middle East and Africa | ||


Key Questions Answered in the Report
What is the current size of the disaggregated GPU market?
The disaggregated GPU market was valued at USD 3.97 billion in 2025, stands at USD 5.34 billion in 2026, and is forecast to reach USD 22.63 billion by 2031 at a 33.48% CAGR.
Why is disaggregated GPU adoption rising in AI infrastructure?
Adoption is rising because GPU pooling improves utilization, agentic AI increases token throughput needs, and memory and bandwidth constraints are pushing operators toward pooled compute and memory architectures.
Which component contributes the most revenue today?
Hardware led with 81.32% of revenue in 2025, as early deployments required large spending on racks, fabrics, switches, memory modules, and tightly integrated compute systems.
Which accelerator approach is growing the fastest?
CXL-based disaggregation is projected to grow at 34.46% CAGR through 2031, supported by shared memory pooling and more flexible composable system design.
Which region is expanding the fastest?
Asia-Pacific is projected to grow at 34.39% CAGR through 2031, supported by hyperscale AI spending in China, HBM supply strength in South Korea, and public AI infrastructure programs in India and Singapore.
What is the main barrier holding wider deployment back?
The biggest constraints are interconnect complexity, fragmented orchestration across GPU stacks, and the cost of adapting facilities to the power and cooling needs of dense AI racks.
Page last updated on:


