Integrated GPU Market Size and Share
Market Overview
| Study Period | 2020 - 2031 |
|---|---|
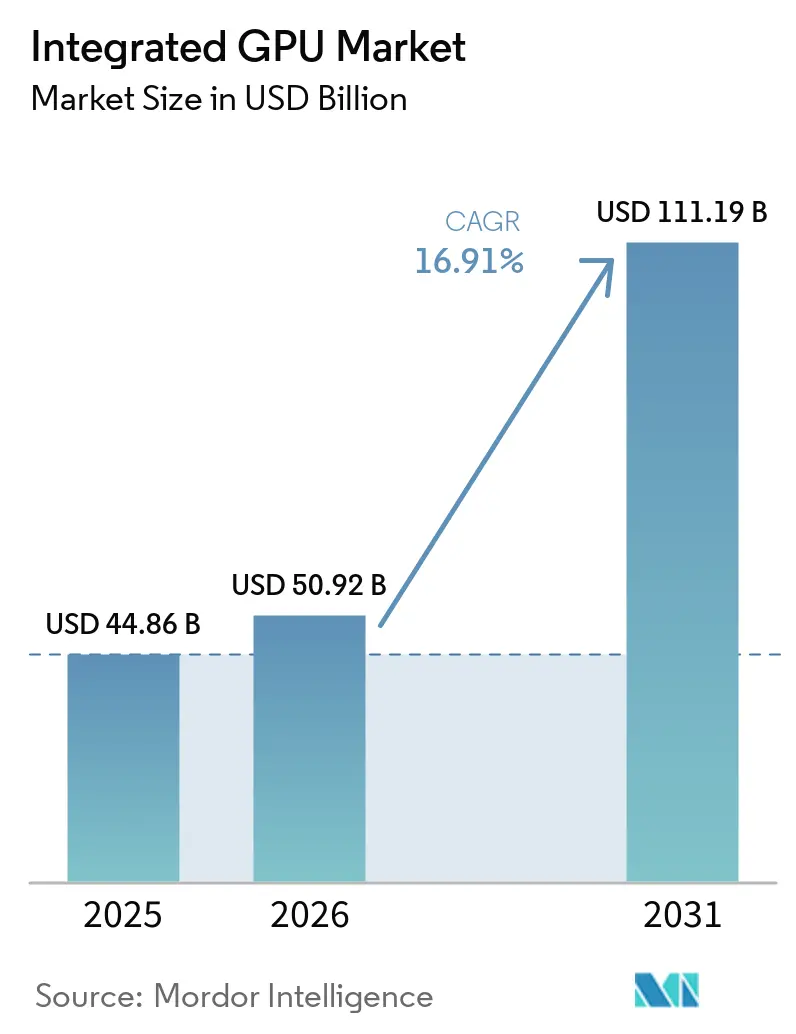
| Market Size (2026) | USD 50.92 Billion |
| Market Size (2031) | USD 111.19 Billion |
| Growth Rate (2026 - 2031) | 16.91% CAGR |
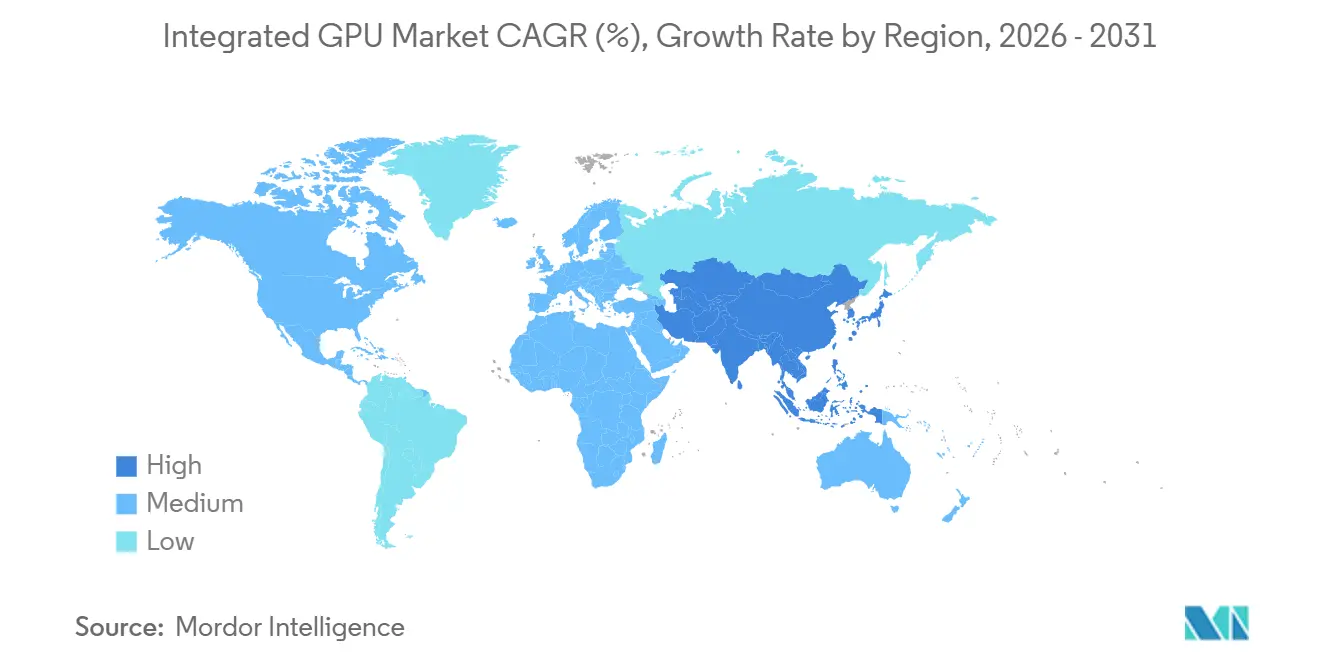
| Fastest Growing Market | Asia-Pacific |
| Largest Market | Asia-Pacific |
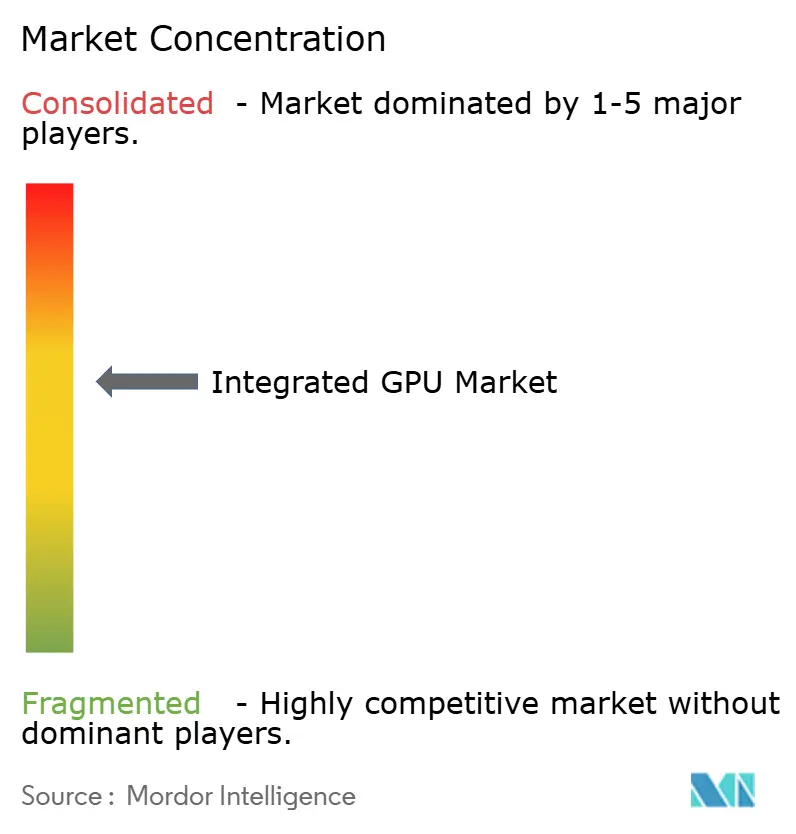
| Market Concentration | Medium |
Major Players *Disclaimer: Major Players sorted in no particular order Image © Mordor Intelligence. Reuse requires attribution under CC BY 4.0. | |
Integrated GPU Market Analysis by Mordor Intelligence
The integrated GPU market size is expected to increase from USD 44.86 billion in 2025 to USD 50.92 billion in 2026 and reach USD 111.19 billion by 2031, growing at a CAGR of 16.91% over 2026-2031. Growth is being shaped by the broader adoption of AI-ready processors in everyday devices, where integrated graphics now support inference, media enhancement, and visual workloads beyond basic display output. The replacement cycle for AI-capable PCs is also boosting demand as enterprise buyers move toward newer systems that combine CPU, GPU, and NPU resources in a single package. Mobile processors continue to anchor scale, while premium PCs and edge systems are widening the revenue mix for more capable integrated designs. Competition remains active across x86, Arm-based, and custom silicon platforms, with power efficiency, memory architecture, and packaging design becoming more important than raw graphics output alone. The main pressure points remain the performance gap with discrete GPUs in sustained, heavy workloads, the limits on shared memory bandwidth, and competition for advanced manufacturing capacity.
Key Report Takeaways
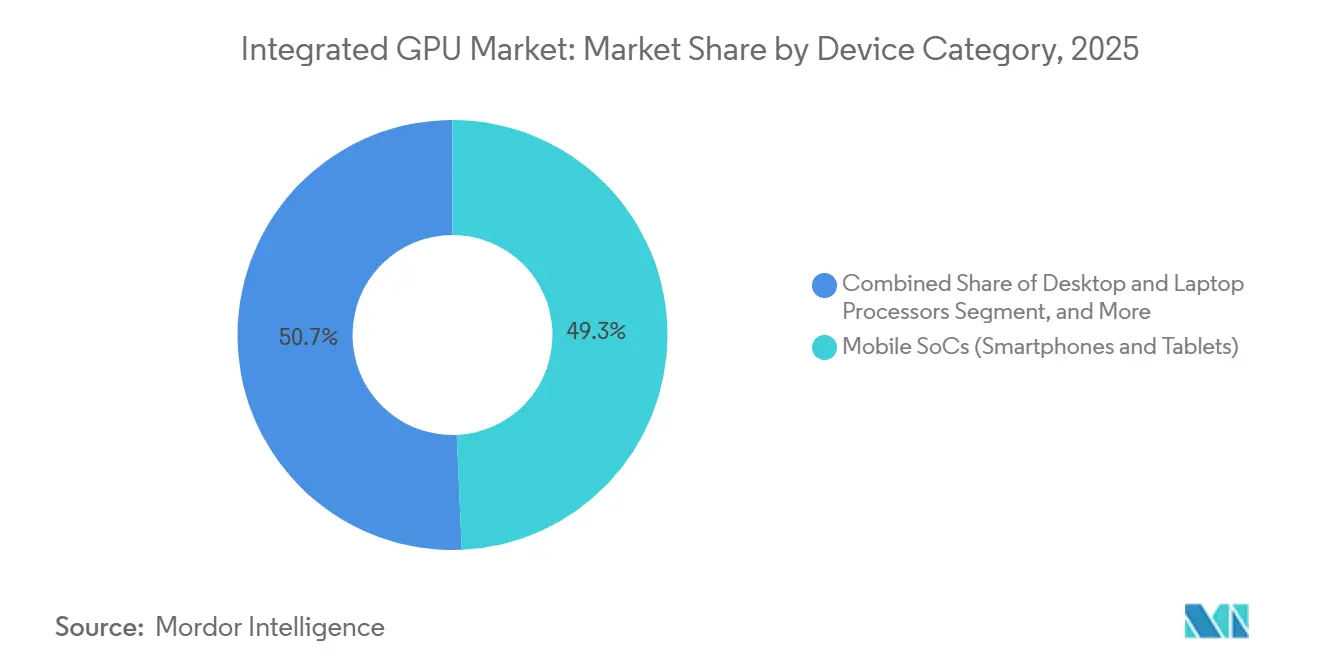
- By device category, Mobile SoCs held 49.32% share of the integrated GPU market in 2025, while Server and Data Center Processors with Integrated Graphics are projected to expand at a 17.62% CAGR through 2031.
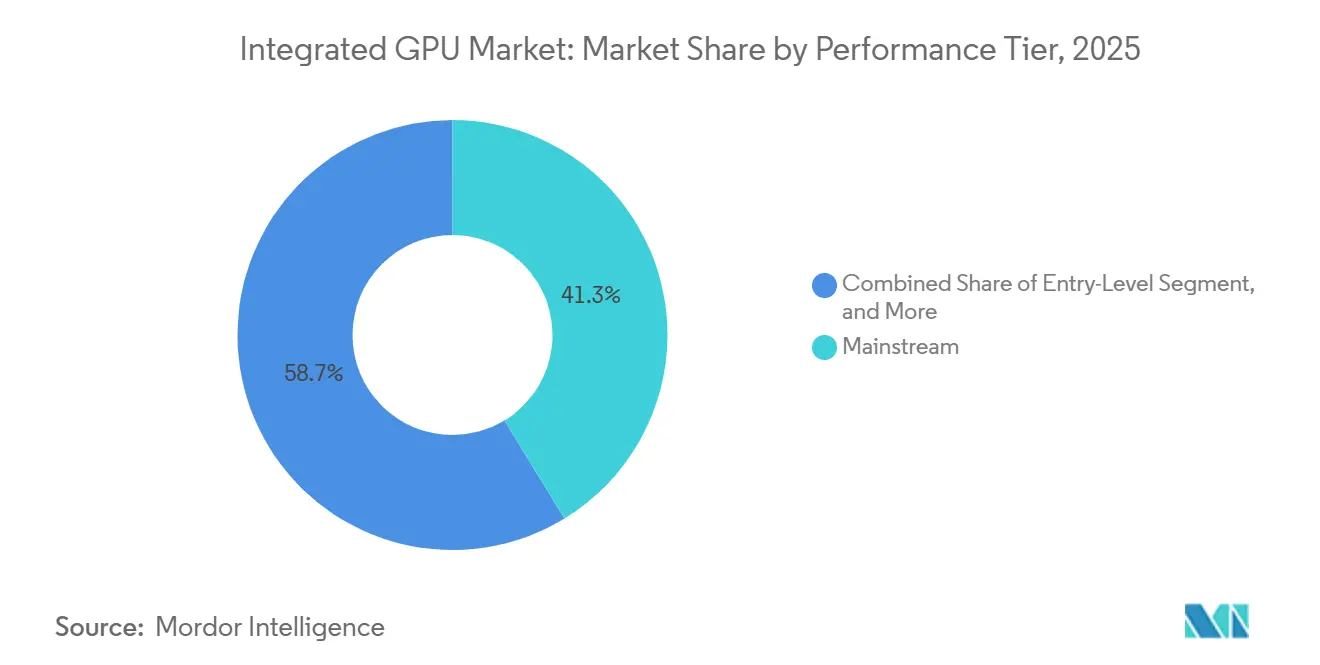
- By performance tier, the Mainstream segment accounted for 41.29% of the market size in 2025, while the Performance tier is projected to advance at a 17.71% CAGR through 2031.
- By geography, Asia-Pacific held 43.93% share of the integrated graphics processing unit (GPU) market in 2025 and is expected to record the fastest regional CAGR of 17.89% through 2031.
Note: Market size and forecast figures in this report are generated using Mordor Intelligence’s proprietary estimation framework, updated with the latest available data and insights as of January 2026.
Global Integrated GPU Market Trends and Insights
Driver Impact Analysis*
| Driver | (~) % Impact on CAGR Forecast | Geographic Relevance | Impact Timeline |
|---|---|---|---|
| AI PC Refresh Cycle and On-Device AI Adoption | +4.2% | Global | Short term (≤ 2 years) |
| Rising Graphics Integration Across Mobile SoCs | +3.8% | Asia-Pacific core, spill-over to Middle East and Africa and South America | Short term (≤ 2 years) |
| Unified-Memory Designs Enabling Local AI Inference | +2.9% | North America and Europe | Medium term (2-4 years) |
| Demand for Power-Efficient Thin-and-Light Computing | +2.1% | Global | Medium term (2-4 years) |
| Architectural Gains in Mainstream Integrated Graphics | +1.5% | Global | Medium term (2-4 years) |
| Tariff- and Memory-Driven Substitution Away From Entry Discrete GPUs | +1.1% | North America, with early gains in Europe, and Japan | Short term (≤ 2 years) |
| Source: Mordor Intelligence | |||
AI PC Refresh Cycle and On-Device AI Adoption
The integrated GPU market is benefiting from the broader move toward AI-capable personal computing, where graphics blocks now support image enhancement, local model execution, and media processing in mainstream systems. Platform vendors are no longer treating the integrated GPU as a secondary feature, because it now works alongside the CPU and NPU in shared workloads that matter to enterprise and consumer buyers. Intel clearly positioned this shift with the Core Ultra Series 3, which combines up to 12 Xe3 GPU cores and a 50 TOPS NPU in a single package on Intel 18A. That design choice supports the integrated GPU market by raising the baseline graphics capability in AI PCs without adding a separate graphics card. The same approach also improves system balance, as lighter AI tasks can be offloaded to the NPU while the integrated GPU continues to handle visual pipelines and sustained graphics activity. This is helping the integrated GPU market gain a stronger role in commercial refresh cycles and premium notebook positioning.
Rising Graphics Integration Across Mobile SoCs
The integrated graphics processing unit (GPU) market continues to draw its largest unit base from mobile SoCs, where graphics blocks are moving beyond frame rendering and into broader compute and AI-assisted imaging functions. MediaTek expanded that performance range with the Dimensity 9500, which integrates the Arm G1-Ultra GPU, adds a new GPU Dynamic Cache Architecture, delivers 33% higher peak performance, and improves power efficiency by 42% from the prior generation.[1]MediaTek Inc., “MediaTek Dimensity 9500 Unleashes Best-in-Class Performance, AI Experiences, and Power Efficiency for the Next Generation of Mobile Devices,” MediaTek Press Room, mediatek.com Samsung also raised expectations in premium smartphones with the Exynos 2600, a 2nm GAA chip that pairs the Xclipse 960 GPU with in-house thermal management and higher ray-tracing capability than the prior model. Qualcomm reinforced the same direction in PC-class mobile silicon with the Snapdragon X2 Elite family, where the Adreno X2-90 integrated GPU supports DirectX 12.2 Ultimate, Vulkan 1.4, and higher performance at the same power level. These changes matter to the integrated GPU market because they widen the performance ceiling of SoCs that already ship at very high volume across phones, tablets, and always-connected PCs. They also show that memory handling, cache design, and graphics efficiency have become core product differentiators in the integrated GPU market rather than supporting features.
Unified-Memory Designs Enabling Local AI Inference
The integrated GPU market is also being pushed forward by unified-memory system designs that let the CPU, GPU, and NPU work from the same memory pool. AMD’s Ryzen AI Max+ 395 shows how this model is moving into compact AI systems, with up to 128 GB of unified LPDDR5X memory on a 256-bit bus and memory bandwidth of 256 GB/s.[2]AMD, “AMD Ryzen AI MAX+ 395, A Leap Forward in Generative AI Performance with Consumer PC,” AMD Developer Resources, amd.com That architecture gives the integrated GPU market a practical path into local AI inference use cases that previously needed discrete accelerators or cloud dependence. Arm is applying a similar design direction to mobile platforms with the Mali G1-Ultra, which combines FP16 matrix-multiply acceleration with second-generation hardware ray tracing for concurrent graphics and AI-assisted workloads. As unified-memory systems become more common, the integrated GPU market gains relevance in enterprise environments that want local processing, simpler device design, and tighter control over data movement. This also supports higher-value processor tiers, because memory architecture is becoming part of the buying decision rather than a hidden specification.
Demand for Power-Efficient Thin-and-Light Computing
The integrated GPU market is benefiting from strong demand for thin-and-light devices that still require strong graphics, video, and AI capabilities. Intel demonstrated the commercial value of this direction with Lunar Lake and then extended it with Panther Lake, where graphics resources sit within a heterogeneous package, allowing the GPU tile to scale more independently. Intel also brought that design logic into value systems with Core Series 3, aimed at everyday laptops and edge systems that still need stronger integrated graphics than prior entry systems offered. This matters because battery life, thermals, and graphics responsiveness now shape buyer decisions together, especially in consumer notebooks and commercial fleets. The integrated GPU market benefits when OEMs can offer acceptable gaming, media, and AI performance without moving to thicker systems or adding a separate graphics card. Over time, this efficiency-driven buying pattern should keep the integrated GPU market tied closely to premium notebook design and broader device refresh demand.
Restraint Impact Analysis*
| Restraint | (~) % Impact on CAGR Forecast | Geographic Relevance | Impact Timeline |
|---|---|---|---|
| Performance Gap Versus Discrete GPUs in AAA and Professional Workloads | -2.1% | Global | Long term (≥ 4 years) |
| Thermal and Shared-Memory Constraints in Sustained Loads | -1.4% | North America and Europe | Medium term (2-4 years) |
| Advanced-Node and LPDDR Supply Allocation Constraints | -0.9% | Asia-Pacific core, spill-over to Global | Medium term (2-4 years) |
| AI PC Spec Inflation Versus Real Memory-Bandwidth Needs | -0.7% | North America and Europe | Short term (≤ 2 years) |
| Source: Mordor Intelligence | |||
Performance Gap Versus Discrete GPUs in AAA and Professional Workloads
The integrated GPU market still faces a clear ceiling in workloads that need long-duration rendering, professional content creation, or advanced gaming at high settings. Even with architectural gains, integrated designs still share system memory and thermal limits, while discrete GPUs keep dedicated memory pools and separate power budgets. Intel’s current roadmap shows how far integrated graphics have advanced, but even its newest client platforms position strong integrated graphics within broader package designs rather than as full substitutes for professional discrete hardware. This keeps the integrated GPU market from capturing the entire opportunity in creator workstations, high-end desktops, and heavy 3D production environments. Software certification patterns also slow substitution, because professional buyers often continue to specify hardware that has a longer history in specialist rendering and visualization workflows. As a result, the integrated GPU market will continue to expand, but it is likely to remain limited in the most demanding graphics segments over the forecast period.
Thermal and Shared-Memory Constraints in Sustained Loads
The integrated GPU market also remains constrained by the fundamental design trade-off of shared thermal and memory resources in compact devices. When CPU, GPU, and NPU blocks run together, a single workload can reduce the headroom available to the others, making sustained output harder to maintain than short-burst performance. AMD’s Ryzen AI Max+ 395 demonstrates how far unified-memory systems have come, but its value still depends on careful management of shared LPDDR5X resources across compute blocks. Mobile SoCs face the same issue in an even tighter form, because GPU power draw competes with modem, camera, and display subsystems inside fixed battery limits. Samsung’s Exynos 2600 and MediaTek’s Dimensity 9500 both demonstrate that vendors are addressing this issue with better process technology, thermal design, and cache strategies. Even so, the integrated GPU market remains exposed to performance variability in thin systems and mobile devices when sustained loads push shared resources to the limit.
*Our forecasts treat driver/restraint impacts as directional, not additive. The impact forecasts reflect baseline growth, mix effects, and variable interactions.
Segment Analysis
By Device Category: Mobile SoCs Drive Volume, Servers Accelerate Revenue Mix
Mobile SoCs held a 49.32% share of the integrated GPU market in 2025, keeping the category at the center of global shipment volume. The integrated GPU market draws much of its scale from smartphones and tablets because graphics IP is embedded directly into application processors that ship in very large numbers across consumer price bands. In this part of the integrated GPU industry, vendors compete on gaming response, imaging quality, AI-assisted media features, and power efficiency rather than on raw compute power alone. MediaTek strengthened this category with the Dimensity 9500, which added the Arm G1-Ultra GPU, higher peak graphics performance, better power efficiency, and 120 fps hardware ray tracing in a mainstream commercial SoC. Samsung also reinforced premium mobile graphics with the Exynos 2600, which features the Xclipse 960 GPU and a 2nm GAA process, supporting stronger visual performance in flagship devices.[3]Samsung Semiconductor, “Exynos 2600, Mobile Processor,” Samsung Semiconductor Global, semiconductor.samsung.com
Server and Data Center Processors with Integrated Graphics are projected to expand at a 17.62% CAGR through 2031, making them the fastest-growing device category in the integrated GPU market. This growth reflects demand for edge AI and compact server platforms where lightweight inference and orchestration can run without a separate add-in card. Desktop and Laptop Processors remain the second-largest device category by value, as client computing continues to absorb large volumes of x86 and Arm-based processors, with improving integrated graphics capabilities. Intel’s Core Ultra Series 3 and Core Series 3 show how the integrated GPU market is moving across both premium and value notebook lines with stronger graphics blocks and higher AI readiness. Embedded and Industrial SoCs remain the smallest revenue segment, but they continue to widen the addressable base of the integrated GPU market as visual interfaces, edge vision, and connected control systems adopt more capable SoC designs.


By Performance Tier: Mainstream Dominance Coexists With Rapid Ascent of Performance Tier
The Mainstream segment accounted for 41.29% of the integrated GPU market in 2025, reflecting a large shipment base of mid-range processors in laptops, smartphones, and commercial devices. This tier matters to the integrated GPU market because it combines scale with improved functionality, providing buyers with enough graphics and AI support for everyday work, media, and casual gaming. Mainstream products from Intel, AMD, MediaTek, Qualcomm, and Samsung now integrate stronger graphics cores, better media engines, and more capable AI blocks than earlier mid-range generations. That has narrowed the need for entry discrete graphics in many consumer and business systems, especially when thermal limits and battery life matter more than peak frame rates. The Mainstream tier, therefore, continues to anchor the integrated GPU market in terms of volume while serving as the default choice for mass-market device makers.
The Performance tier is projected to advance at a 17.71% CAGR through 2031, making it the fastest-growing performance band in the integrated GPU market. Growth in this band reflects rising demand for AI PCs, premium thin-and-light notebooks, and higher-value mobile processors with more graphics cores, faster memory paths, and stronger AI support. Qualcomm’s Snapdragon X2 Elite family supports this trend by pairing the Adreno X2-90 integrated GPU with advanced graphics standards and higher performance at the same power level. AMD is also pushing the upper tier of the integrated graphics processing unit (GPU) market with Ryzen AI Max+ 395, where unified LPDDR5X memory and strong integrated graphics make local AI workloads more practical in compact systems. Entry-Level products remain important in budget smartphones and low-cost computing, while High-Performance designs from Apple, AMD, and Qualcomm show that the integrated GPU industry is steadily moving into workloads that used to require a dedicated accelerator.
Geography Analysis
Asia-Pacific held 43.93% of the integrated GPU market share in 2025 and is expected to post the fastest regional CAGR of 17.89% through 2031. The region leads the integrated GPU market because it combines SoC manufacturing depth, high-volume electronics assembly, and very great end-device demand across smartphones, notebooks, and consumer electronics. China remains the largest regional demand center due to its scale in device assembly and its push to strengthen domestic semiconductor capabilities. Regional vendors continue to invest in premium integrated graphics capabilities. South Korea adds value through advanced mobile chip development, and Samsung’s Exynos 2600 shows how leading vendors in the region continue to invest in premium integrated graphics capability. India and Southeast Asia are also expanding the integrated GPU market through wider 5G adoption, rising smartphone use, and device access programs that bring more GPU-equipped products into everyday computing.
North America represents the second-largest regional revenue base in the integrated GPU market, supported by enterprise PC replacement, premium consumer demand, and wider adoption of AI-ready devices. The January 2026 Section 232 semiconductor tariffs changed procurement economics for imported chips, increasing the appeal of domestic or tariff-exempt supply for some buyers.[4]The White House, “Adjusting Imports of Semiconductors, Semiconductor Manufacturing Equipment, and Their Derivative Products Into the United States,” Presidential Actions, whitehouse.gov That policy backdrop favors US-based design and manufacturing strategies, especially when integrated platforms can help reduce bill-of-material complexity. Canada and Mexico contribute mainly through assembly, logistics, and distribution roles within the broader North American supply chain.
Europe continues to develop as both a demand center and a strategic manufacturing investment location for the integrated graphics processing unit (GPU) market. Regional demand is supported by commercial PCs, industrial systems, and automotive electronics that rely on embedded graphics capability. South America remains a smaller but growing part of the integrated GPU market, with demand tied closely to mid-range smartphones and broader mobile data adoption. The Middle East and Africa are also expanding from a smaller base as digital transformation programs, smart city deployments, and connected surveillance systems increase demand for embedded and industrial SoCs with graphics capability. Across both regions, the integrated GPU market is still shaped more by the availability and pricing of imported devices than by local chip production. This leaves demand sensitive to currency movements, trade policy, and pricing effects stemming from supply tightness in major semiconductor manufacturing hubs.

Competitive Landscape
The integrated GPU market is moderately consolidated at the platform level. Intel and AMD remain central in x86 client processors, while Qualcomm, MediaTek, Samsung, Apple, and UNISOC shape much of the Arm-based integrated GPU market. Arm Limited and Imagination Technologies also matter because their GPU IP reaches a large share of unit volumes through licensing into third-party SoCs. Intel’s January 2026 launch of Panther Lake was a direct strategic move to raise its position in AI-capable client systems, with up to 12 Xe3 GPU cores and a 50 TOPS NPU built into the package. Intel followed that with Core Series 3 in April 2026, extending stronger integrated graphics into value laptops and edge systems, which widened its coverage across price points in the integrated GPU market.
AMD’s competitive position in the integrated GPU market is supported by unified-memory design, especially in systems built around Ryzen AI Max+ 395, where graphics and AI capability are combined with large shared LPDDR5X memory pools. Qualcomm is broadening its role by bringing stronger Adreno graphics to PC-class Snapdragon devices, giving it a path beyond phones into premium mobile computing. Samsung remains important in premium mobile silicon, and the Exynos 2600 launch showed a continued commitment to internal graphics differentiation through the Xclipse 960 GPU. Apple maintains a distinct position because it controls silicon, software, and device integration, which lets it compete on efficiency and user experience rather than solely on standalone component comparisons. Chinese vendors such as Loongson Technology and Shanghai Zhaoxin are gaining policy support, but they still trail the leading suppliers on process scale and commercial reach.
At the licensing layer, the integrated GPU market remains broad because many SoC vendors still rely on third-party graphics IP rather than fully custom designs. Arm’s Mali G1-Ultra and related GPU offerings continue to support mobile and AI-assisted graphics use cases across several device classes. Imagination Technologies is also strengthening its position through support for its software ecosystem, including progress on open-source graphics drivers for IMG BXS GPUs and on Vulkan conformance work. This leaves the integrated GPU market with a mixed structure, where a handful of major platform companies shape performance expectations, but a wider field of licensers and regional chip vendors still influences unit volume and downstream design choices. The result is a competitive environment that is active, innovative, and only partly concentrated across the full value chain.
Integrated GPU Industry Leaders
Intel Corporation
Advanced Micro Devices, Inc.
Apple, Inc.
Qualcomm Incorporated
MediaTek Inc.
- *Disclaimer: Major Players sorted in no particular order

Recent Industry Developments
- April 2026: Intel launched the Intel Core Series 3 (Wildcat Lake) for value laptops and edge systems, built on Intel 18A with integrated Xe3 GPU cores, up to 2.8x better GPU AI performance versus prior generation, and targeting everyday computing and small business workloads. Systems powered by these processors became commercially available from OEM partners starting April 16, 2026.
- March 2026: Intel Core Ultra Series 3 with vPro became commercially available on March 31, 2026, specifically targeting enterprise commercial PC buyers with up to 80% better integrated graphics over the prior generation. The Intel Arc Pro B70 and B65 discrete GPUs were simultaneously announced to extend the professional graphics portfolio.
- January 2026: Intel unveiled the Core Ultra Series 3 (Panther Lake) at CES 2026 as the first compute platform built on Intel 18A process technology, featuring up to 12 Xe3 GPU cores, 50 NPU TOPS, and up to 77% faster gaming performance versus Lunar Lake. Over 200 PC designs from global OEM partners were announced.
- January 2026: Samsung launched the Exynos 2600, the world's first 2nm GAA smartphone chip, featuring the Xclipse 960 GPU based on AMD's RDNA4 architecture, delivering twice the compute performance and 50% higher ray-tracing performance versus the Exynos 2500. The chip-powered Galaxy S26 models launched in February 2026.


Global Integrated GPU Market Report Scope
The Integrated GPU Market encompasses the global industry involved in the design, development, and deployment of graphics processing units integrated into a system-on-chip (SoC) or processor architecture rather than as standalone discrete components. These integrated GPUs share system memory and are widely used to deliver efficient graphics processing across cost-sensitive, power-efficient computing devices.
The Integrated GPU Market Report is Segmented by Device Category (Desktop and Laptop Processors, Mobile SoCs, Embedded and Industrial SoCs, and Server and Data Center Processors with Integrated Graphics), Performance Tier (Entry-Level, Mainstream, Performance, and High-Performance), and Geography (North America, Europe, Asia-Pacific, South America, and Middle East and Africa). The Market Forecasts are Provided in Terms of Value (USD).
| Desktop and Laptop Processors |
| Mobile SoCs (Smartphones and Tablets) |
| Embedded and Industrial SoCs |
| Server and Data Center Processors with Integrated Graphics |
| Entry-Level (< USD 50) |
| Mainstream (USD 50 - USD 150) |
| Performance (USD 150 - USD 300) |
| High-Performance (> USD 300) |
| North America | United States |
| Canada | |
| Mexico | |
| Europe | Germany |
| United Kingdom | |
| France | |
| Italy | |
| Rest of Europe | |
| Asia-Pacific | China |
| Japan | |
| South Korea | |
| India | |
| Southeast Asia | |
| Rest of Asia-Pacific | |
| South America | |
| Middle East and Africa |
| By Device Category | Desktop and Laptop Processors | |
| Mobile SoCs (Smartphones and Tablets) | ||
| Embedded and Industrial SoCs | ||
| Server and Data Center Processors with Integrated Graphics | ||
| By Performance Tier | Entry-Level (< USD 50) | |
| Mainstream (USD 50 - USD 150) | ||
| Performance (USD 150 - USD 300) | ||
| High-Performance (> USD 300) | ||
| By Geography | North America | United States |
| Canada | ||
| Mexico | ||
| Europe | Germany | |
| United Kingdom | ||
| France | ||
| Italy | ||
| Rest of Europe | ||
| Asia-Pacific | China | |
| Japan | ||
| South Korea | ||
| India | ||
| Southeast Asia | ||
| Rest of Asia-Pacific | ||
| South America | ||
| Middle East and Africa | ||


Key Questions Answered in the Report
What is the size of the integrated GPU market in 2026 and how large will it be by 2031?
The integrated GPU market is valued at USD 50.92 billion in 2026 and is projected to reach USD 111.19 billion by 2031, growing at a 16.91% CAGR over 2026-2031.
Which device category leads revenue generation for integrated graphics?
Mobile SoCs are the largest device category, with 49.32% share in 2025, supported by very high shipment volumes in smartphones and tablets.
Which segment is expanding the fastest through 2031?
Server and Data Center Processors with Integrated Graphics are the fastest-growing device category, with a projected CAGR of 17.62% through 2031.
Which performance tier is seeing the strongest momentum?
The Performance tier is growing the fastest at a 17.71% CAGR, as AI PCs and premium thin-and-light systems lift demand for higher-value processors.
Which region offers the strongest growth outlook?
Asia-Pacific leads both scale and growth, with 43.93% share in 2025 and a projected CAGR of 17.89% through 2031.
What are the main risks holding back wider adoption in high-end systems?
The main constraints are the performance gap with discrete GPUs in sustained heavy workloads, shared-memory and thermal limits, and supply allocation pressure on advanced manufacturing nodes.
Page last updated on:


