
Digital Transformation (DX) Market Size and Share
Digital Transformation (DX) Market Analysis by Mordor Intelligence
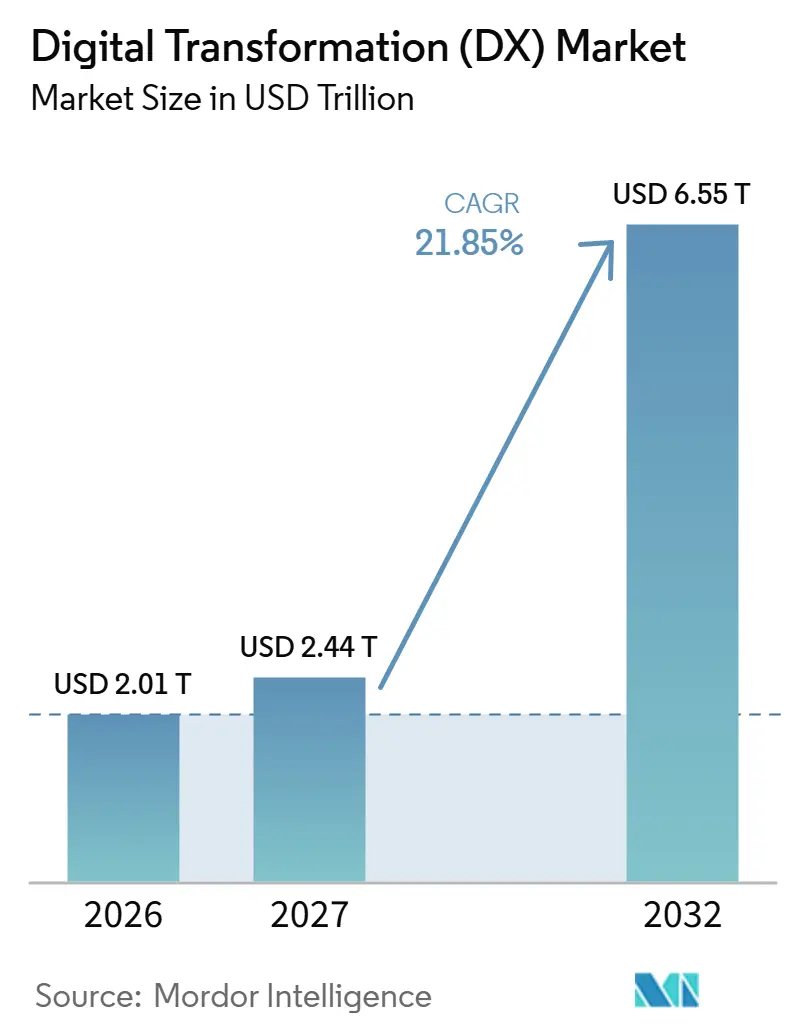
The digital transformation (DX) market size is estimated at USD 2.01 trillion in 2026 and is projected to be USD 2.44 trillion in 2027, reaching USD 6.55 trillion by 2032, growing at a CAGR of 21.85% from 2027 to 2032.
Enterprise cloud adoption and wider AI use expand demand for services that connect digital capabilities with business workflows. Germany's public-sector demand for sovereign cloud makes deployment control a commercial consideration alongside application functionality. Competitive responses combine implementation partnerships with industrial integration and infrastructure automation, widening the services attached to a technology purchase. Legacy applications and security skills shortages can slow deployment, making migration and protection continuing costs of turning technology into operating capacity.
Key Report Takeaways
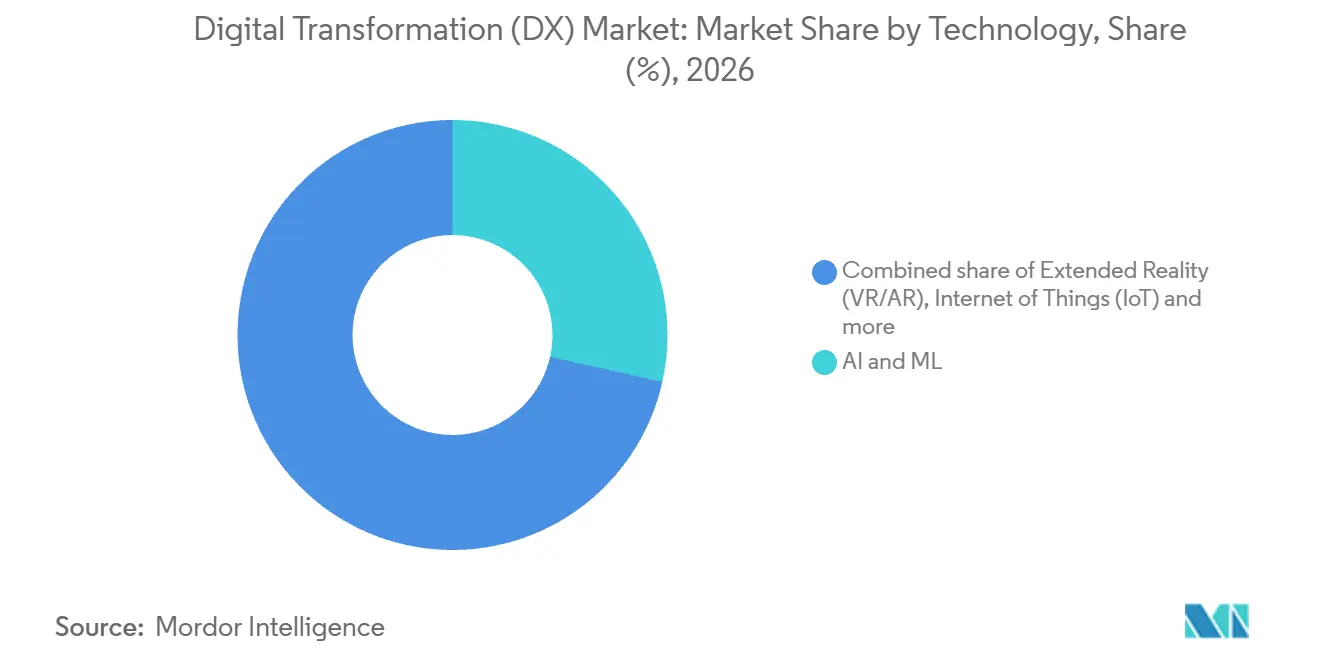
- By technology, AI and ML led with a 28.5% digital transformation (DX) market share in 2026 and also have the fastest forecast CAGR of 24.3% from 2027 to 2032.
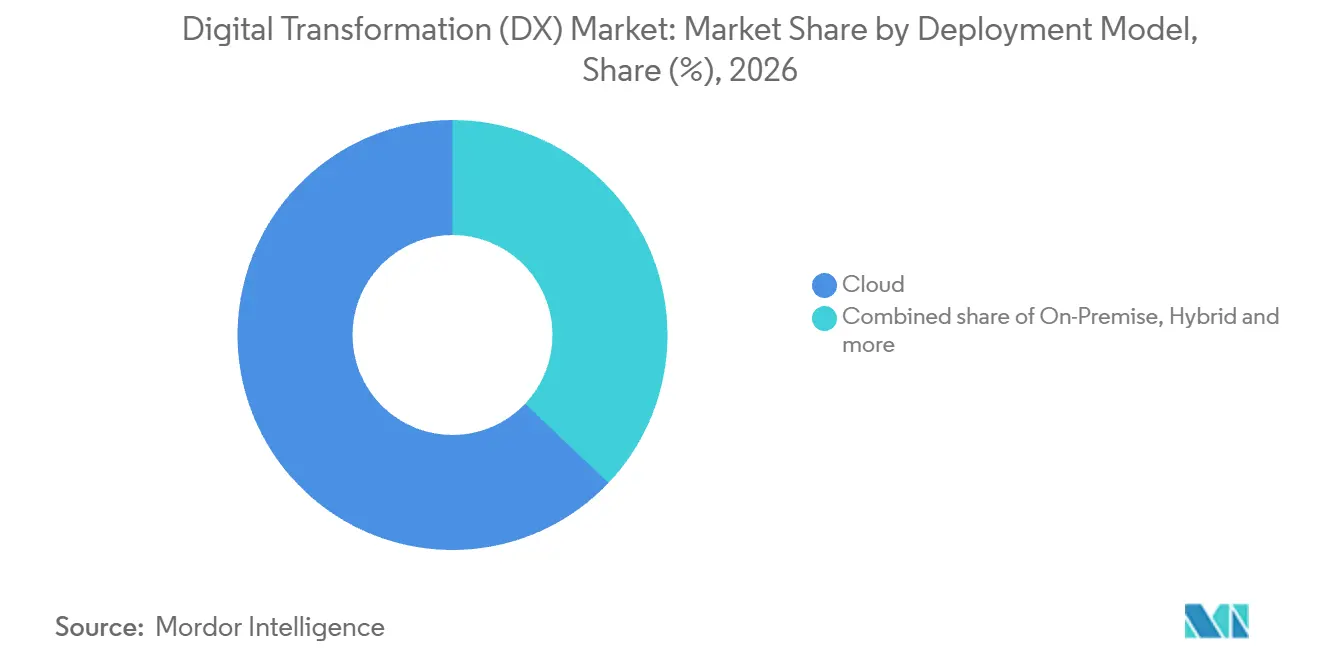
- Across deployment models, cloud held a 62.93% share of the digital transformation (DX) market size in 2026, while hybrid is forecast to grow fastest at a 23% CAGR from 2027 to 2032.
- In terms of organization size, large enterprises led with a 72.29% share in 2026 and are also forecast to grow fastest at a 22.9% CAGR from 2027 to 2032.
- Among industry verticals, BFSI led with a 23.42% share in 2026, and healthcare and life-sciences is forecast to grow fastest at a 22.2% CAGR from 2027 to 2032.
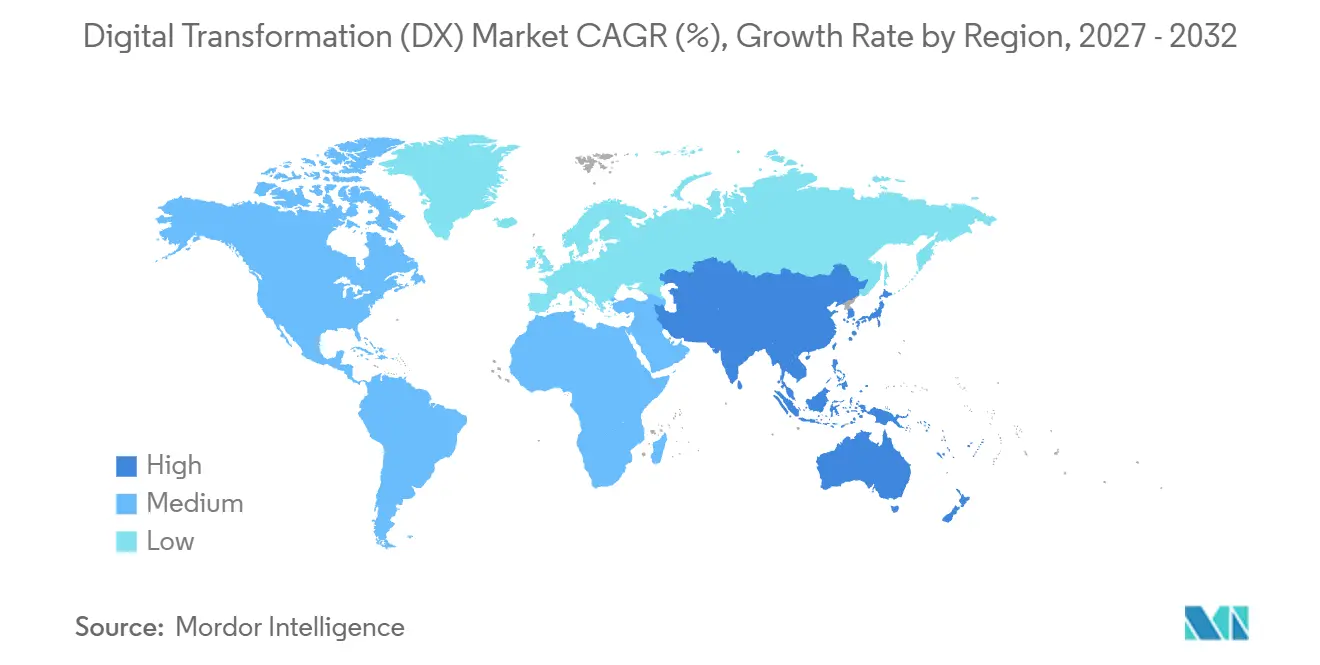
- Across geographies, North America held the largest share at 31.95% in 2026, while Asia-Pacific is forecast to grow fastest at a 22.5% CAGR from 2027 to 2032.
Note: Market numbers in this report are based on Mordor Intelligence's proprietary estimation framework, which combines nine months of actuals with Q4 projections for base year 2026.
Market Trends and Insights
Drivers Impact Analysis of Digital Transformation (DX) Market*
| Driver | (~) % Impact on CAGR Forecast | Geographic Relevance | Impact Timeline |
|---|---|---|---|
| Cloud-first enterprise IT spending boom | +10% | European Union member states | Short term (≤ 2 years) |
| Rising AI/ML integration across business functions | +11% | Indonesia, Malaysia, Philippines, Singapore, Thailand and Vietnam | Short term (≤ 2 years) |
| 5G-enabled real-time data use-cases | +4% | United States and Thailand | Medium term (2-4 years) |
| Mandatory ESG reporting digitization | +2.5% | European Union member states | Medium term (2-4 years) |
| "Digital-sovereignty" public-sector funding waves | +1.8% | European Union, especially Germany | Medium term (2-4 years) |
| Low-code / no-code platforms democratizing DX | +1.2% | Argentina and United Kingdom | Short term (≤ 2 years) |
| Source: Mordor Intelligence | |||
Cloud-first enterprise IT spending boom
Cloud-service expansion creates transformation work around the applications supported by a growing platform business. Microsoft reported Azure revenue above USD 100 billion in fiscal 2026, up 41% year over year.[1] For enterprise buyers, an expanding cloud service relationship can provide a delivery route for additional digital processes. The associated implementation opportunity lies in connecting those processes to existing operations and establishing responsibility for their continued operation. This gives integration suppliers a role alongside the platform provider, particularly when the buyer needs a working business process rather than computing capacity alone. That continuing responsibility can shift a supplier's earnings toward recurring operations fees, changing the economics of winning a migration project.
Rising AI/ML integration across business functions
AI adoption across several functions expands the transformation opportunity from individual tools to the connections between business processes. McKinsey’s 2026 survey reported that 44% of organizations had AI scaling across the enterprise, up from 38% in 2025. The share of companies using AI in 3 or more business areas rose from 51% to 56%. As functional coverage widens, suppliers can address the coordination needed when separate AI applications depend on shared information. This creates demand for integration and governance alongside the models themselves, with greater commercial scope than an isolated departmental installation. For an enterprise buyer, the resulting decision is who controls data reuse when several departments extend AI at once.
5G-enabled real-time data use-cases
By September 2025, Celanese had deployed NTT DATA’s fully managed private 5G network at 2 manufacturing facilities in Texas. NTT DATA reported that the network provided secure, reliable connectivity and real-time business-logistics insights for industrial transformation. For a chemical producer, timely logistics information can connect material movement with the decisions needed to keep manufacturing processes supplied. That creates an application opportunity around the network, since useful connectivity must feed an operational workflow to support business decisions. The managed-service arrangement also links network delivery with responsibility for its operation. A logistics application built on that connection can consequently expand without requiring the chemical producer to take on private-network operation as an additional internal function.
Mandatory ESG reporting digitization
Mandatory sustainability statements create demand for a repeatable connection between environmental information and corporate reporting. The EU Corporate Sustainability Reporting Directive requires specified undertakings to publish sustainability statements through phased application. XHTML preparation and digital tagging depend on adoption of the digital taxonomy. Wave-two and wave-three reporting were postponed, while the revised ESRS acts adopted in July 2026 awaited scrutiny before entering into force. For covered businesses, this combination favors data preparation that can serve reporting obligations while accommodating changes in the required output. The taxonomy condition makes collection and consolidation the earlier priority, allowing covered businesses to prepare reporting data before settling the final machine-readable filing design.
Restraints Impact Analysis of Digital Transformation (DX) Market*
| Restraint | (~) % Impact on CAGR Forecast | Geographic Relevance | Impact Timeline |
|---|---|---|---|
| Legacy technical-debt lock-ins | -4% | North America, United Kingdom, France, Germany and Australia | Long term (≥ 4 years) |
| Cyber-talent scarcity and wage inflation | -2.7% | North America, Europe, Asia-Pacific, Latin America, Middle East and Africa | Medium term (2-4 years) |
| Digital-identity regulatory fragmentation | -1% | Germany, Spain, Italy and the Netherlands | Medium term (2-4 years) |
| Scope-3 data-quality gaps for ESG audits | -1% | Europe, Middle East, Africa, Asia-Pacific and the Americas | Short term (≤ 2 years) |
| Source: Mordor Intelligence | |||
Legacy technical-debt lock-ins
Legacy applications can make the value of a new platform contingent on work outside the platform itself. In Pega’s 2025 survey, 68% of enterprise IT decision-makers across North America, the United Kingdom, France, Australia, and Germany said legacy systems and applications prevented their organization from fully embracing modern technologies. For these buyers, purchasing a replacement would not by itself remove the dependencies that connect existing applications to daily operations. A transformation proposal must therefore account for the transition between the old environment and its replacement. That requirement can favor staged work over a single deployment, spreading the commercial opportunity across migration milestones. The remaining constraint is the cost and time needed to release each dependent process safely.
Cyber-talent scarcity and wage inflation
Security staffing affordability can constrain transformation even when organizations can fund new digital tools. In ISC2’s 2025 global survey, 29% of respondents said their organizations could not afford to hire cybersecurity staff with the skills needed to secure them.[2] Among respondents whose security teams had at least one skills need, 36% cited cloud computing security. In the same survey, 24% of cybersecurity professionals said skills shortages left staff unable to take advantage of emerging cybersecurity technologies. For buyers facing the reported affordability barrier, securing an expanding cloud estate can make skilled staffing costs a limit on rollout.
*Our forecasts treat driver/restraint impacts as directional, not additive. The impact forecasts reflect baseline growth, mix effects, and variable interactions.
Digital Transformation (DX) Market Segment Analysis
By Technology:
AI Adoption Expands Implementation DemandAI and ML accounted for a 28.5% share of the digital transformation (DX) market size in 2026 and are forecast to be the fastest-growing segment, with a 24.3% CAGR from 2027 to 2032. In McKinsey’s 2026 survey, 89% of organizations reported using AI in at least one business function. Use in at least one function leaves room between organizational adoption and embedding AI throughout business decisions. The largest segment can therefore expand through broader functional coverage within adopting organizations, making the number of tasks served more consequential than another first-use sale.
Industrial robotics addresses physical production, with factories worldwide installing more than 600,000 robots in 2025, an 11% increase from 2024.[3] That equipment creates implementation work focused on the relationship between software decisions and production assets. Internet of things (IoT) adoption at Solvay included more than 5,000 connected sensors at 25 sites in 11 countries as reported in April 2026, with IMI as the preferred supplier. The devices measure vibration and temperature on critical equipment to support asset tracking and maintenance planning. For Solvay's maintenance teams, additional sensor readings matter when they change which equipment receives attention and when it is serviced.

By Deployment Model:
Cloud Scale Supports Hybrid ExpansionCloud represented a 62.93% digital transformation (DX) market share in 2026, making it the largest segment. In 2025, 52.74% of EU enterprises with at least 10 employees or self-employed persons used paid cloud computing services. That substantial buyer base supports cloud as an established route for delivering additional digital capabilities to enterprise users. The same reading leaves nearly half of surveyed EU enterprises with at least 10 employees or self-employed persons outside paid cloud use in 2025, marking an opening for first-time buyers within the largest segment.
Hybrid is forecast to be the fastest-growing segment, with a 23% CAGR from 2027 to 2032. Flexera’s winter 2025 survey of 753 technical professionals and executive leaders worldwide found that 73% of surveyed organizations used a hybrid cloud model, up 3 percentage points year over year. On-premise deployment has a distinct role, with Uptime Institute’s 2026 survey describing corporate data centers as central to enterprises’ hybrid IT strategies. Together, these findings support an implementation opportunity spanning more than one operating environment. Retaining corporate infrastructure consequently leaves the buyer operating that environment after adding cloud services, limiting how much internal operating work a cloud expansion can remove.
By Organization Size:
Enterprise Adoption Creates Expansion CapacityLarge enterprises were the largest segment with a 72.29% share in 2026 and are forecast to be the fastest-growing segment, with a 22.9% CAGR from 2027 to 2032. Among large EU enterprises, 84.67% reported purchasing paid cloud computing services in 2025, up 6.9 percentage points from 2023. In 2025, 89% of large EU enterprises with at least 250 employees or self-employed persons used enterprise resource planning applications and 69% used business-intelligence software. Lower participation in business intelligence leaves a more distinct first-use opening in analytics than in planning applications, sharpening where suppliers can seek additional enterprise users.
Small and medium enterprises (SMEs) with 10 to 249 persons employed recorded a 52% cloud-purchasing rate in Eurostat’s 2025 EU enterprise survey. In the same survey, 71% of SMEs reached at least basic digital intensity, defined as using at least 4 of 12 selected technologies. These measures describe a group with an established digital base and incomplete adoption of particular services. Packaged implementations can address that opening by extending one defined business process at a time, with a clear connection to the tools the buyer already uses. SME providers can consequently distinguish first-time cloud buyers from firms extending an existing service, giving those groups different entry points into a packaged offering.
By Industry Vertical:
Banking Scale Meets Healthcare InteroperabilityBFSI was the largest industry segment with a 23.42% share in 2026. Bank of America’s consumer banking platform recorded 4.3 billion digital logins in the first quarter of 2026. The measure counts desktop and mobile banking sessions on the consumer platform, illustrating the recurring service volume within the largest industry segment. Logins on that platform rose from 4 billion in the first quarter of 2025 to 4.3 billion in the first quarter of 2026, showing growth in session volume on the bank's consumer channel.
Healthcare and life-sciences is forecast to be the fastest-growing segment, with a 22.2% CAGR from 2027 to 2032. In 2025, 76% of U.S. nonfederal acute care hospitals engaged in all 4 measured health information exchange domains, up from 70% in 2023. These domains cover sending, receiving, finding, and integrating health information. Rates of sending, receiving, and finding increased from 2023 to 2025, while integrating remained stable. That uneven progress makes integrating received summary-of-care records into hospital systems a more specific expansion target than adding another transmission route.
Geography Analysis
North America Digital Transformation (DX) Market
North America held a 31.95% digital transformation (DX) market share in 2026, making it the largest geography. KPMG’s 2026 survey reported that U.S. organizations invested an average of USD 190 million annually in digital technology. Such annual investment can support substantial programs combining technology purchases, implementation, and coordinated delivery across a buyer's operating environment, creating a commercial role for providers able to assume clear delivery responsibilities. The same survey put the global annual average at USD 174 million, placing surveyed U.S. organizations above their global counterparts in investment per organization.
Asia-Pacific Digital Transformation (DX) Market
Asia-Pacific is forecast to be the fastest-growing geography, with a 22.5% CAGR from 2027 to 2032. In the Singapore Business Federation’s 2025 survey of 553 businesses, 4 in 5 respondents had engaged in some form of digital transformation. The sample covered key industries, largely reflected federation membership, and was weighted toward SMEs. Respondents identified AI, automation, and cybersecurity among their main concerns for the following 12 months. Further demand among this engaged Singapore business base can therefore come from extending existing digital work into those priorities, tying additional projects to specific operating needs.
In South America, Brazil's Piauí state government ran portals listing 577 Gov.pi Cidadão digital citizen services and 313 Gov.pi Empresas productive-sector services in June 2026, giving suppliers one public buyer. In Europe, ABRO 2026 sets assurance requirements for Dutch central-government and police cloud contracts involving national-security risk at TBB 4 / Departmental Confidential level. Cloud suppliers must provide NBIV full-scope SOC 2 Type 2 reports covering all trusted services criteria or NBIV-approved equivalent assurance reports, maintained throughout the contract. In the Middle East and Africa, Abu Dhabi reported 3.8 million TAMM users and more than 1.9 million cumulative cases completed through conversational AI in January 2026. Because TAMM counts cases completed through conversational AI rather than conversations, the results tie the technology to fulfilled service requests, placing supplier work in the back-office processes that finish each request.
Mordor Intelligence provides coverage of the digital transformation (dx) market across other key regional markets, including Asia, Europe, North America, Africa, Middle East, and Latin America, each with their regulatory frameworks and demand patterns. Detailed country-level analysis extends to Thailand, Spain, Canada, and Nigeria incorporating local coverage and market participation, as required.
Regulatory Framework and Outlook
This comparison of selected jurisdictions considers enterprise cloud and AI service suppliers handling personal data. The United States comparison focuses on California's requirements for covered businesses. The main commercial differences are which actor bears a duty, when compliance begins, and how cross-border processing is authorized. These differences shape how a supplier can connect technical controls with the customer's own compliance responsibilities.
Regulatory Table of Digital Transformation (DX) Market
| Decision factor | United States | Germany | India | Brazil |
|---|---|---|---|---|
| Primary authority | California Privacy Protection Agency | Federal and state privacy authorities; Bundesnetzagentur and other competent AI authorities | Data Protection Board of India, established November 13, 2025 | National Data Protection Authority (ANPD) |
| Key instruments or direction | California Consumer Privacy Act regulations effective January 1, 2026, with staged compliance | National AI Act implementing law effective July 29, 2026; federal/state privacy supervision | Digital Personal Data Protection Act, 2023 and Rules, 2025, with phased commencement | International personal-data transfer Resolution No. 19/2024 and EU adequacy Resolution No. 32/2026 |
| Commercial effect | Covered risk assessments from January 2026; automated decisionmaking technology requirements for significant decisions from January 2027 | Applicable transparency duties from August 2026; Annex III high-risk rules from December 2, 2027 and regulated-product high-risk rules from August 2, 2028 | Rule 6 safeguards for personal data held or controlled by Data Fiduciaries, including Data Processor work on their behalf, scheduled May 13, 2027 | EU adequacy except exclusive public safety, defense, state security and criminal-justice transfers; applicable contractual or corporate guarantees elsewhere |
| Current policy attractiveness | Medium | Medium | Medium | High |
| Future direction of policy attractiveness | Hardening | Hardening | Hardening | No change |
| Source: Mordor Intelligence | ||||
California's assessment work and January 2027 significant-decision rules increase the compliance support needed when suppliers serve covered businesses. Germany combines divided privacy supervision with staged AI enforcement, making supervisor identification and system classification important before the later high-risk duties apply. India's established Board and scheduled May 2027 fiduciary safeguards provide a preparation window before those controls apply to personal data processed on the fiduciary's behalf. Brazil's higher attractiveness reflects the January 2026 adequacy route for covered EU transfers, while its in-force mechanism, continuous monitoring, and reassessment within 4 years support continuity in those transfer conditions.
Value Chain Stages
The value chain compares how suppliers earn revenue from infrastructure provisioning through software, implementation, and continuing operation. AWS (Amazon) delivers on-demand computing resources on a pay-as-you-go basis, linking infrastructure earnings to service use. Implementation creates a separate commercial task because platform availability must be converted into a working business process. The resulting chain offers both initial delivery revenue and a continuing role for suppliers responsible for operating the finished environment.
Value Chain Analysis Table of Digital Transformation (DX) Market
| Primary activity | Key participants | Value capture | Bottleneck | Resilience response |
|---|---|---|---|---|
| Cloud resource provisioning | Cloud infrastructure providers such as AWS (Amazon) | Usage-based cloud service charges | Capacity allocation mismatched to workload demand | Measure utilization and adjust allocated resources |
| Industrial software and automation supply | Industrial software and automation suppliers such as Siemens | Software and automation sales | Fit between software models and plant processes | Validate operating requirements before configuration |
| Implementation and systems integration | Systems integrators such as Accenture; cloud migration partnerships such as AWS (Amazon) with DXC | Implementation and integration fees | Dependencies across platforms and business workflows | Test interfaces and sequence dependent migrations |
| Managed infrastructure and applications | Managed services providers such as Accenture | Infrastructure and application management fees | Loss of operating knowledge at project handover | Carry service ownership and documentation into operation |
| Source: Mordor Intelligence | ||||
Value capture can continue after implementation because operating the environment is a distinct service responsibility. Accenture manages infrastructure and applications through continuous monitoring, optimization, and issue resolution across public, private, and hybrid cloud environments. Retaining knowledge across the handover can reduce the need to reconstruct application dependencies when problems arise. This makes the handover itself part of the service proposition, because documenting dependencies preserves what the customer pays the operator to manage.
Competitive Landscape
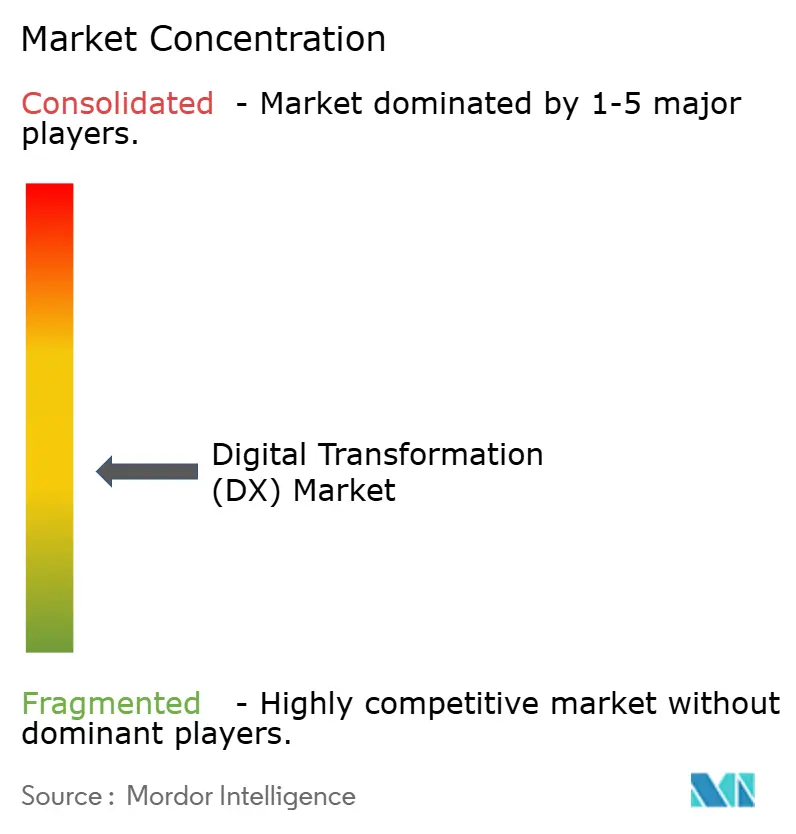
Competition is divided among service providers and technology platforms, with major participants including Accenture, Google (Alphabet), Siemens, IBM, and Microsoft. Consulting and implementation services compete alongside enterprise cloud and AI platforms and industrial software, creating several routes to the same transformation buyer. In December 2025, Accenture and OpenAI announced a collaboration to introduce agentic AI into enterprise workflows. The agreement included a client adoption program and plans to equip tens of thousands of Accenture professionals with ChatGPT Enterprise. That pairing can turn workforce familiarity with the technology into repeatable client delivery capacity, making professional readiness a competitive asset.
Manufacturing creates a distinct competitive test because enterprise transformation must connect production information with the business systems that act on it. In September 2025, Siemens and Snowflake announced a global collaboration linking shop-floor operational data through Siemens Industrial Edge with IT data in Snowflake AI Data Cloud. The announced architecture paired Siemens' edge connectivity and data preprocessing, including models working with production automation, with Snowflake's cloud data platform for analytics. Manufacturers can thus divide work between processing near production automation and analysis using cloud data, making the location of each decision part of the supplier choice.
IBM's portfolio expansion spans infrastructure controls and the data supplied to AI applications. Its February 2025 HashiCorp acquisition added Terraform and Vault for infrastructure automation and security, while its Confluent acquisition was completed in March 2026. IBM described immediate Confluent integrations with watsonx.data, IBM Z, IBM MQ, and IBM webMethods Hybrid Integration for real-time streaming, analytics, and automation. These links can help enterprises feed operational events into AI workflows while retaining transaction systems. Combining those paths with infrastructure automation gives buyers a broader alternative to assembling separate data and deployment suppliers.
Digital Transformation (DX) Industry Leaders
-
Accenture
-
Google (Alphabet)
-
Siemens
-
IBM
-
Microsoft
- *Disclaimer: Major Players sorted in no particular order
Digital Transformation (DX) Market Companies Covered in this Report
- Accenture
- Microsoft
- IBM
- Google (Alphabet)
- AWS (Amazon)
- SAP
- Oracle
- Adobe
- Salesforce
- Cisco Systems
- Dell Technologies
- Siemens
- Hewlett Packard Enterprise
- Cognex
- Apple
- ServiceNow
- Infosys
- Capgemini
- Wipro
- Schneider Electric
- Honeywell
- Hitachi
- Fujitsu
- Huawei
Key Opportunities for Market Participants
The opportunities compare routes into energy-platform development, governed infrastructure operations, and sovereign-cloud implementation. Brazil's IT resource administration system (SISP) and Portugal's sovereign-cloud plan connect public-sector modernization with governance or qualification requirements. These conditions make translating policy into implementable system and service requirements a commercially relevant task. The European energy-platform call offers a separate route through proposal development for a future pilot.
Market Opportunities Table of Digital Transformation (DX) Market
| Opportunity | Why now | Buyer / lead segment | Recommended play | Main barrier | Likely beneficiaries |
|---|---|---|---|---|---|
| AI-driven energy-platform development | EU pilot proposal call opened October 20, 2026; deadline February 16, 2027 | Energy-system platform developers and energy-sector participants | Develop a proposal linking AI capability to an energy-system operating need | Demonstrating technical and operational fit for a large-scale pilot | Cloud suppliers such as AWS (Amazon), subject to call eligibility |
| AI governance within infrastructure operations | Brazil's updated model took effect September 1, 2026 for 250 SISP organizations | SISP public-sector organizations and infrastructure-operations contractors | Embed AI-use controls specified in the terms of reference or cited agency policy | Converting agency rules into enforceable service controls | Integrators such as Accenture, subject to procurement requirements |
| Sovereign-cloud readiness and migration | Portugal's 2026-2027 plan provides for process qualification and planned cloud framework agreements | Portuguese public administration | Qualify processes and data before designing a compliant migration sequence | Meeting process-specific sovereignty, security and resilience requirements | Cloud providers meeting requirements; integrators such as Accenture, subject to qualification |
| Source: Mordor Intelligence | |||||
The central opening is implementation that makes public-sector governance requirements operational. A provider can create value by turning a public buyer's required controls into a deployable service design before undertaking broader migration. A governance-ready service design can become the basis of a supplier's proposal, linking the implementation offer to the buyer's stated contracting requirements.
Recent Industry Developments in Digital Transformation (DX) Market
- Sep 2026: Brazil's updated infrastructure-operations contracting model took effect for 250 SISP organizations, requiring AI-use rules in the terms of reference or an agency AI-governance policy identified in the solicitation.
- May 2026: EY and Microsoft announced an investment of more than USD 1 billion over 5 years in an initiative pairing EY practitioners with Microsoft Forward Deployed Engineers to help client businesses scale enterprise AI.
- May 2026: SAP introduced SAP Business AI Platform, a unified environment for building, deploying, and governing enterprise AI grounded in business context.
Digital Transformation (DX) Market Report Scope and Research Methodology
Market Definition and Coverage
The Digital transformation (DX) market measures annual enterprise and public-sector spending globally on technologies and related services that modernize processes, customer experiences, and IT operations through digital change. The value is the total annual buyer expenditure on those purchases.
Scope exclusions: Consumer-only gadgets purchased outside an enterprise digital transformation program and standalone telecom network buildouts purchased outside an enterprise digital transformation program are excluded.
Segments Covered in This Report
- By Technology
- AI and ML
- Extended Reality (VR/AR)
- Internet of Things (IoT)
- Industrial Robotics
- Blockchain
- Digital Twin
- Additive Manufacturing / Industrial 3-D Printing
- Edge Computing
- Others
- By Deployment Model
- Cloud
- On-Premise
- Hybrid
- By Organization Size
- Large Enterprises
- Small and Medium Enterprises (SMEs)
- By Industry Vertical
- BFSI
- Healthcare and Life-Sciences
- Manufacturing and Industrial
- Retail and E-commerce
- Energy and Utilities
- Automotive and Transportation
- Government and Public Sector
- Others (Media, Education, etc.)
- By Geography
- North America
- United States
- Canada
- Mexico
- South America
- Brazil
- Argentina
- Rest of South America
- Europe
- Germany
- United Kingdom
- France
- Italy
- Spain
- Rest of Europe
- Asia-Pacific
- China
- Japan
- India
- South Korea
- Southeast Asia
- Rest of Asia-Pacific
- Middle East and Africa
- Middle East
- Saudi Arabia
- United Arab Emirates
- Turkey
- Rest of Middle East
- Africa
- South Africa
- Nigeria
- Egypt
- Rest of Africa
- Middle East
- North America
Data Sources, Market Sizing, and Validation
Desk Research
Eurostat enterprise statistics, World Bank digital-progress reporting, UN Trade and Development's Digital Economy Report, and the International Telecommunication Union's connectivity indicators provide illustrative evidence on technology use, digital services, connectivity, and adoption conditions. These sources help analysts test whether reported spending patterns align with changes in cloud, AI, connected operations, and enterprise digitization across regions and industries.
Company filings, annual reports, investor materials, procurement notices, and reputable business press add context on supplier offerings, customer programs, contract structures, and changes in reported demand, with each item checked against the defined buyer-spending boundary. Because company filings may combine transformation sales with other business lines, analysts isolate relevant disclosures before using them as cross-checks. Where enterprise adoption statistics differ in definition or survey coverage, analysts compare question wording and population before using them as demand indicators. The named sources are not exhaustive and further sources inform collection, validation and clarification.
Primary Interviews and Surveys
Interviews and structured surveys would target enterprise technology buyers, public-sector digital leaders, technology and service providers, and functional leaders across major industries and regions. Their evidence would be used to check secondary-source interpretations of buyer expenditure, deployment patterns, segment shares, and forecast drivers, with conflicting definitions reconciled to the stated transaction boundary. Where source coverage is thin, analysts would document the gap, compare adjacent indicators, and triangulate the estimate using independent demand and supplier evidence before carrying an assumption into the model.
Distribution of primary research fieldwork respondents
| Company type | Respondent position | Region |
|---|---|---|
| Top tier: 30% | CXOs: 20% | APAC: 40% |
| Mid tier: 50% | Functional/Unit leaders: 35% | EMEA: 32% |
| Smaller Players: 20% | Managers: 45% | Americas: 28% |
Market-Sizing & Forecasting
The estimate is built top down from global annual buyer spending on transformation technologies and related services, then checked selectively against supplier revenue roll-ups, channel evidence, and sampled average selling prices multiplied by deployment volumes. Analysts use enterprise and public-sector IT budgets, cloud and AI adoption, technology and service revenue trends, and industry and regional investment patterns to size the total and build shares for technology, deployment, organization size, vertical, and geography from each group's contribution to in-scope spending. A multivariate regression relates these demand and supply indicators to spending over time, while scenario analysis adjusts the forward path for cloud-first investment, AI integration, 5G use cases, legacy constraints, and skills availability. Analysts compare forecasts for each variable with buyer and provider evidence, revisit assumptions when indicators disagree, and use the closest reliable regional, industry, or supplier proxy where direct observations are missing, recording the adjustment and its effect on the estimate.
Data Validation & Update Cycle
Analysts triangulate the estimate against independent company disclosures, public statistics, adoption indicators, and supplier or channel evidence, then investigate anomalies and material variance from prior periods or related indicators before sign-off. A second analyst reviews the boundary, calculations, segment shares, and forecast assumptions, with a further review resolving flagged differences. Re-contact is triggered when an interview source changes a material input or when new evidence conflicts with an earlier interpretation. The dataset is refreshed annually, updated between cycles when a material event changes spending or adoption, and checked again against current sources immediately before delivery.
Mordor Intelligence's Digital Transformation Market Size Compared With Other Published Estimates
Published estimates can differ in the transactions and products they count and the inputs used to model demand. The Digital transformation (DX) market measures annual enterprise and public-sector spending globally on technologies and related services that modernize processes, customer experiences, and IT operations through digital change.
Key Gap Drivers include the study's defined coverage and market-specific modeling choices. Analysts compare forecasts for each variable with buyer and provider evidence, revisit assumptions when indicators disagree, and use the closest reliable regional, industry, or supplier proxy where direct observations are missing, recording the adjustment and its effect on the estimate.
Benchmark comparison
| Source | Market Size | Gaps in Research Methodology |
|---|---|---|
| Mordor Intelligence | USD 2.44 T (2027) | |
| Global Consultancy A | USD 1.11 T (2025) | At its 2025 base, this estimate is 54.5% below this report's 2027 value of USD 2.44 T, 2 years later. Its published forecast uses a lower stated annual growth path than the report, keeping its earlier measured total on a lower trajectory. |
| Industry Analyst B | USD 640 B (2029) | At its 2029 base, this estimate is 73.8% below this report's 2027 value of USD 2.44 T, 2 years earlier. The published total covers DX software only, while the broader DX spending measure also includes hardware and services. |
Mordor Intelligence's analysts triangulate the estimate against independent company disclosures, public statistics, adoption indicators, and supplier or channel evidence, then investigate anomalies and material variance from prior periods or related indicators before sign-off.
Key Questions Answered in the Report
What is the Digital Transformation (DX) market size and growth outlook?
The size is projected at USD 2.44 trillion in 2027 and USD 6.55 trillion by 2032, with a 21.85% CAGR from 2027 to 2032.
Which forces are driving enterprise digital transformation?
Cloud expansion and broader AI integration support demand. McKinsey’s 2026 survey reported enterprise-wide AI scaling at 44% of organizations.
Which technology segment leads transformation spending?
AI and ML led with a 28.5% share in 2026 and are forecast to grow at a 24.3% CAGR from 2027 to 2032.
Which companies are major transformation providers?
Major providers include Accenture, Google (Alphabet), Siemens, IBM, and Microsoft.
What constraints can slow enterprise digital deployment?
Legacy systems and cybersecurity staffing affordability can constrain rollout. In ISC2’s 2025 survey, 29% of respondents said their organizations could not afford to hire cybersecurity staff with the skills they needed.
Which region is forecast to grow fastest in digital transformation?
Asia-Pacific is forecast to grow fastest, at a 22.5% CAGR from 2027 to 2032. North America led with a 31.95% share in 2026.