Europe Digital Transformation Market Size and Share
Market Overview
| Study Period | 2020 - 2031 |
|---|---|
| Forecast Data Period | 2026 - 2031 |
| Historical Data Period | 2020 - 2024 |
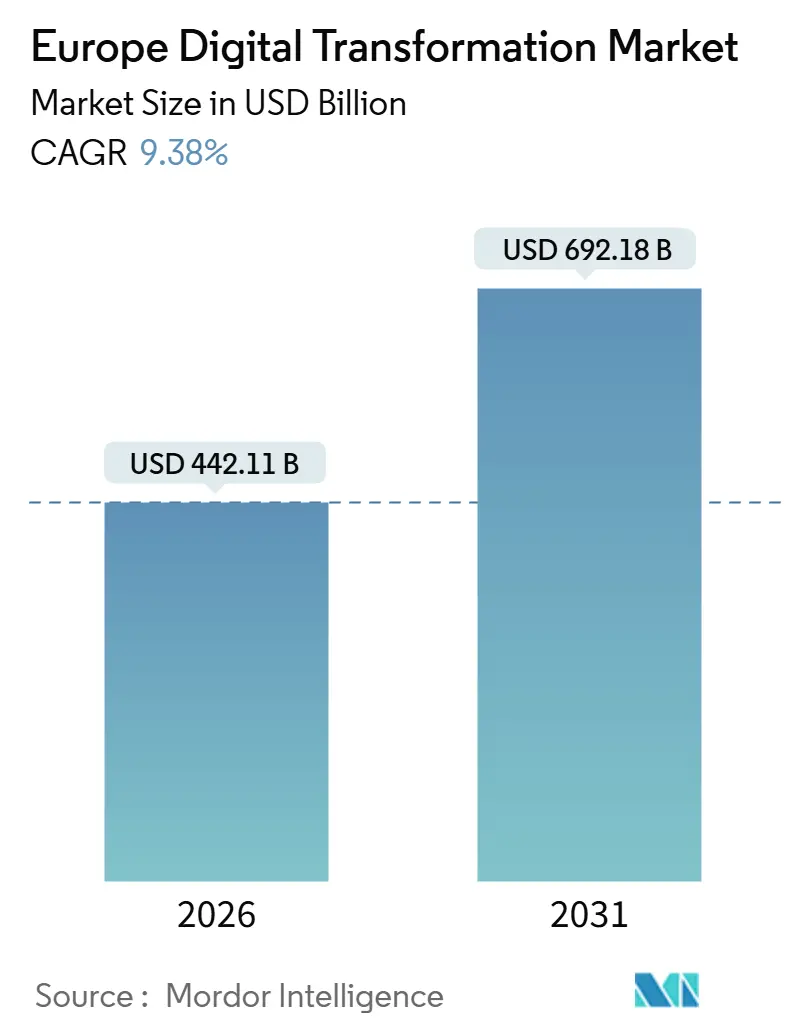
| Market Size (2026) | USD 442.11 Billion |
| Market Size (2031) | USD 692.18 Billion |
| Growth Rate (2026 - 2031) | 9.38% CAGR |
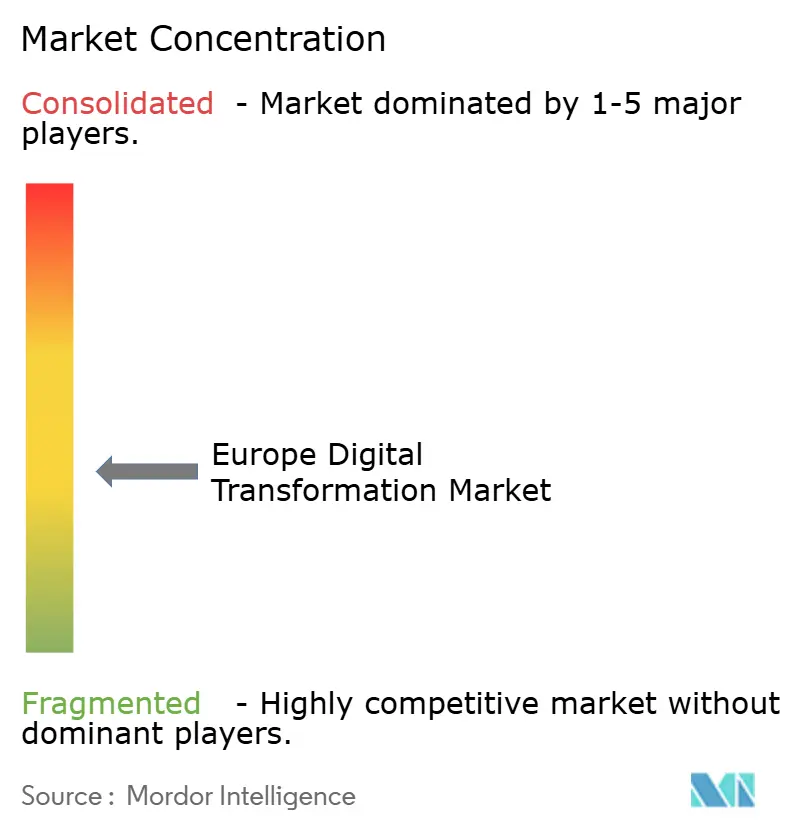
| Market Concentration | Medium |
Major Players *Disclaimer: Major Players sorted in no particular order Image © Mordor Intelligence. Reuse requires attribution under CC BY 4.0. | |
Europe Digital Transformation Market Analysis by Mordor Intelligence
The Europe digital transformation market size stands at USD 442.11 billion in 2026 and is projected to reach USD 692.18 billion by 2031, reflecting a CAGR of 9.38% through the forecast period. Growth is fueled by the European Commission’s Digital Decade targets that require 75% of enterprises to adopt cloud, artificial intelligence and big data by 2030, the EUR 200 billion (USD 234.23 billion) InvestAI vehicle that accelerates sovereign compute build-outs, and 5G coverage that reached 81% of the EU-27 population by late 2025. Mid-market firms that postponed investment during the pandemic are now modernizing with grants from the Recovery and Resilience Facility, while hyperscalers deploy EUR 15 billion (USD 17.57 billion) in sovereign-cloud regions to meet Gaia-X rules. Quantum computing moves from laboratory to pilot phase after EU Quantum Flagship funding, and healthcare demand rises as the European Health Data Space mandates interoperable electronic health records.
Key Report Takeaways
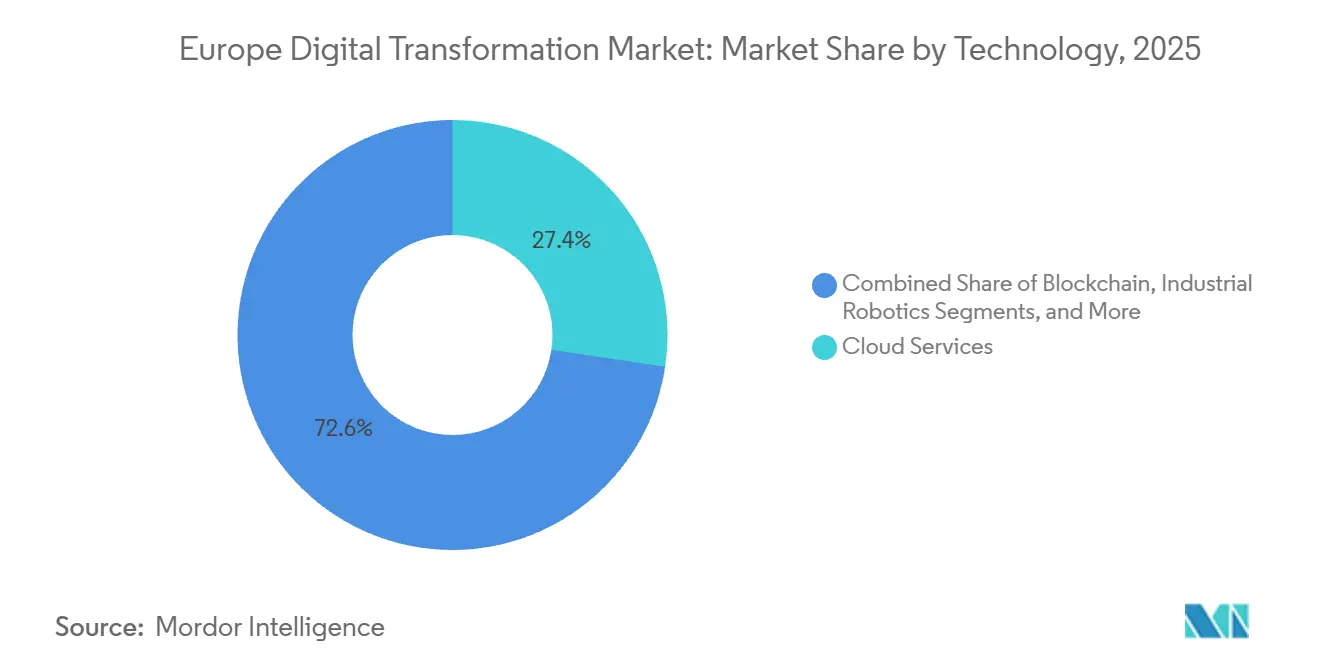
- By technology, Cloud services led the technology stack with 27.36% of Europe digital transformation market share in 2025, whereas quantum computing is forecast to register the fastest 11.32% CAGR through 2031.
- By end-user industry, Manufacturing held 19.83% spending in 2025, while healthcare and life sciences are poised for a 10.72% CAGR to 2031.
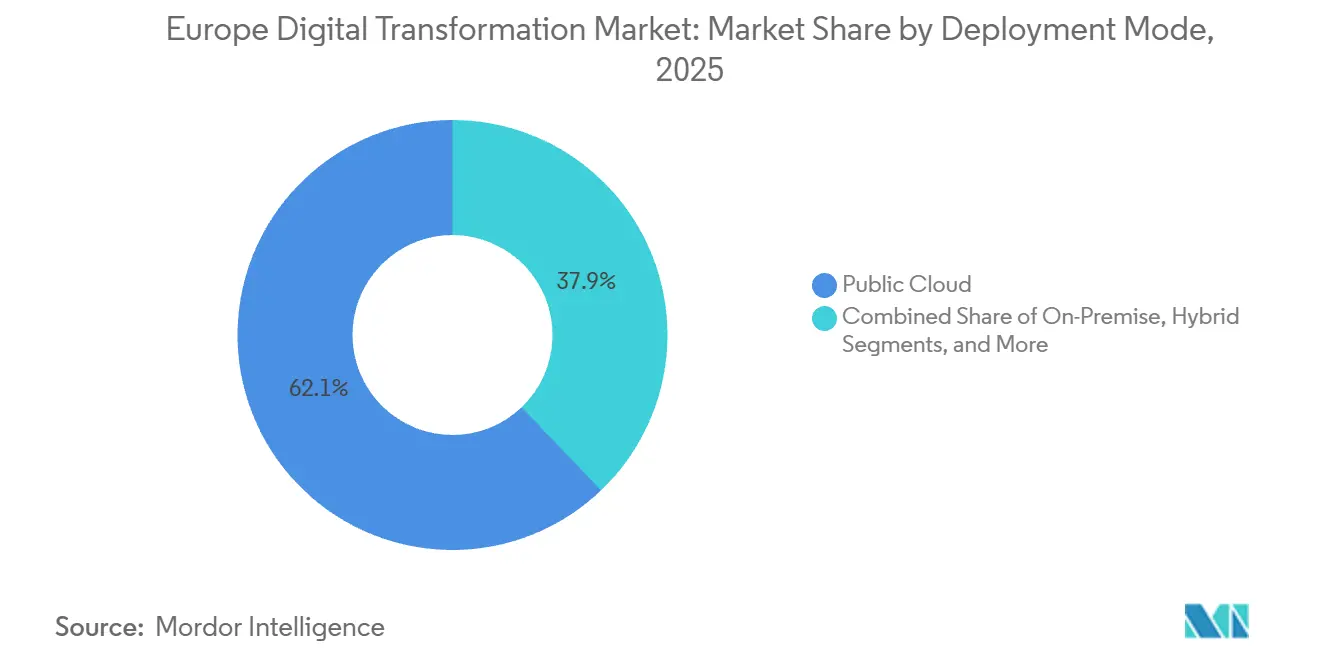
- By deployment mode, Public cloud deployments captured 62.14% of the Europe digital transformation market size in 2025, but hybrid architectures are advancing at a 12.87% CAGR through 2031.
- By enterprise size, Large enterprises commanded 55.62% outlay in 2025, yet small and medium enterprises will expand at a 10.34% CAGR during 2026-2031.
- By geography, Germany accounted for 24.51% of the region’s 2025 revenue, whereas Spain is projected to grow at a 12.52% CAGR to 2031.
Note: Market size and forecast figures in this report are generated using Mordor Intelligence’s proprietary estimation framework, updated with the latest available data and insights as of January 2026.
Proportional positioning is established by comparing regional contributions against the global total, including that of Europe. The digital transformation (dx) market share in our global report expresses these relative weights.
Europe Digital Transformation Market Trends and Insights
Drivers Impact Analysis*
| Driver | (~) % Impact on CAGR Forecast | Geographic Relevance | Impact Timeline |
|---|---|---|---|
| Surge in AI and ML Spend Under EU Digital Decade Funds | +2.1% | EU-27 with focus on Germany, France, Spain | Medium term (2-4 years) |
| Rising Demand for Sovereign-Cloud and Privacy-Preserving Tech | +1.9% | Germany, France, Netherlands, wider EU-27 | Medium term (2-4 years) |
| Expansion of 5G and Edge Connectivity Across Europe | +1.8% | Nordics, Germany, UK with spillover to Central and Eastern Europe | Short term (≤2 years) |
| Post-COVID Cloud-Migration Wave Among Mid-Market Enterprises | +1.5% | Western Europe, emerging Poland and Czech Republic | Short term (≤2 years) |
| EU Chips Act Incentives for On-Shore Semiconductor Digitalisation | +1.2% | Germany, France, Italy | Long term (≥4 years) |
| Green Digital-Twin Projects Driven by EU Taxonomy Compliance | +0.9% | Germany, Netherlands, Nordics | Medium term (2-4 years) |
| Source: Mordor Intelligence | |||
Surge in AI and ML Spend Under EU Digital Decade Funds
InvestAI and the Digital Europe Programme together mobilized EUR 208.1 billion (USD 243.71 billion) for AI compute, data spaces and workforce skilling during 2024-2026, prompting supercomputing procurements in Germany and France and certifying foundation models through the European AI Office. Enterprise adoption accelerated as 38% of manufacturers embedded predictive maintenance and 29% of banks deployed generative models in 2025, double the 2023 penetration. Compliance clauses that keep data in the EU drive hyperscalers to partition workloads, inflating per-transaction costs yet also opening market share for regional AI specialists. The result is a virtuous cycle of demand for sovereign AI stacks, specialist chips and advanced training clusters.
Rising Demand for Sovereign-Cloud and Privacy-Preserving Tech
Gaia-X now links 387 providers across 18 countries, letting firms enforce data residency without vendor lock-in. Germany requires public workloads to migrate to Gaia-X-compliant platforms by 2027, while France’s Bleu venture already holds defense and central-bank contracts. Privacy-preserving computation gained traction as encrypted analysis of 2.3 million patient records proved viable during the 2025 European Health Data Space pilot. Although sovereignty safeguards build trust, they raise infrastructure cost baselines and risk splintering the single market, especially for smaller vendors that struggle to scale across divergent local compliance templates.
Expansion of 5G and Edge Connectivity Across Europe
EU-27 5G coverage hit 81% in 2025, with Germany at 89% and Spain at 86%.[1]European 5G Observatory, “5G Deployment Status,” 5gobservatory.eu Standalone cores combined with 10,000 planned edge nodes enable sub-10-millisecond latency services. Vodafone-AWS, Orange-Google and Telia-Telenor partnerships opened almost 80 multi-access edge zones in 2025, cutting backhaul costs by 40% for video analytics workloads. As network slicing matures, logistics and healthcare clients buy dedicated slices, spurring fresh connectivity revenue models but accentuating interoperability headaches when roaming across operators.
Post-COVID Cloud-Migration Wave Among Mid-Market Enterprises
Recovery grants and voucher schemes released EUR 8.1 billion (USD 9.49 billion) for SMEs, triggering a 34% year-over-year rise in SaaS uptake in Spain alone. Hybrid adoption dominates as 61% of firms keep legacy ERP on-premise and shift customer-facing apps to public cloud, cutting infrastructure costs by 22%. Low-code platforms help firms bypass the 42% shortage of cloud specialists, but vendor lock-in emerges when switching costs equal 40-60% of initial spends. Skills scarcity therefore simultaneously fuels managed-services demand and limits deeper customization.
Restraints Impact Analysis*
| Restraint | (~) % Impact on CAGR Forecast | Geographic Relevance | Impact Timeline |
|---|---|---|---|
| Persistent SME Digital-Skills Gap | -1.4% | EU-27, pronounced in Southern and Eastern Europe | Short term (≤2 years) |
| Data-Privacy and Cybersecurity Concerns | -1.1% | EU-wide under NIS2 and GDPR | Medium term (2-4 years) |
| Fragmented IoT Standards Hurt Interoperability | -0.8% | Germany, Italy, Czech Republic | Medium term (2-4 years) |
| Energy-Price Volatility Inflates Hyperscale-DC OPEX | -0.6% | Ireland, Netherlands, Nordics | Short term (≤2 years) |
| Source: Mordor Intelligence | |||
Persistent SME Digital-Skills Gap
The EU ended 2025 with 500,000 unfilled ICT vacancies, and more than 50% of Greek, Bulgarian and Romanian SMEs could not hire required cloud or cybersecurity talent. Training coalitions certify basic literacy rather than advanced Kubernetes or zero-trust skills, forcing SMEs toward managed services that dilute margins. Large firms launch in-house academies to attract talent, widening the productivity divide.
Data-Privacy and Cybersecurity Concerns
NIS2 fines of up to EUR 10 million (USD 11.71 million) have elevated cybersecurity to board level since October 2024. Ransomware losses hit EUR 12 billion (USD 14.05 billion) in 2025, and a EUR 1.2 billion (USD 1.41 billion) GDPR fine against a social media firm proved that trans-Atlantic data flows remain precarious. Compliance spends now reach 4-6% of IT budgets in health and finance, prompting many SMEs to default to hyperscaler reference architectures.
*Our forecasts treat driver/restraint impacts as directional, not additive. The impact forecasts reflect baseline growth, mix effects, and variable interactions.
Segment Analysis
By Technology: Quantum Computing Gains Enterprise Traction Amid Cloud Services Dominance
Cloud services retained 27.36% of Europe digital transformation market share in 2025, underscoring infrastructure-as-a-service ubiquity across enterprises of all sizes. The Europe digital transformation market size attached to cloud services continues to grow as hyperscalers add sovereign regions that satisfy Gaia-X criteria. Quantum computing accounted for less than 1% revenue in 2025 but enjoys an 11.32% CAGR, catalyzed by EU Quantum Flagship grants and the 54-qubit installation at the Leibniz Supercomputing Centre.
Artificial intelligence and machine learning already hold roughly 18% revenue, broadening through generative applications in customer service and fraud detection. Internet of Things sits near 14% yet wrestles with fragmented protocols, though the Matter standard is starting to normalize device communications.[2]Connectivity Standards Alliance, “Matter Protocol,” csa-iot.org Digital twin, blockchain, robotics and additive manufacturing collectively deepen deployment in aerospace, energy and supply-chain settings, reinforcing platform stickiness for incumbents that offer integrated toolchains.


By End-User Industry: Healthcare Digitalization Outpaces Manufacturing’s Established Lead
Manufacturing contributed 19.83% of Europe digital transformation market size in 2025, reflecting relentless Industry 4.0 upgrades among Germany’s Mittelstand and Italy’s engineering clusters. Healthcare and life sciences, while lower at roughly 12%, post a 10.72% CAGR as the European Health Data Space compels interoperable electronic health records across 27 member states.
Banking, financial services and insurance leverage open-banking APIs and real-time payments, sustaining a 16% slice. Retail and logistics digitize supply chains with computer vision and warehouse robotics, while utilities deploy digital twins to monitor pipelines and optimize renewable assets under EU Taxonomy rules. Public administration accelerates eIDAS 2.0 rollouts, and education uses blended-learning platforms, though growth has moderated as on-site classes resume.
By Deployment Mode: Hybrid Architectures Rise Amid Sovereignty Pressures
Public cloud held 62.14% Europe digital transformation market share in 2025, but hybrid models are expanding at a 12.87% CAGR because firms segment workloads to satisfy NIS2 and GDPR mandates. Europe digital transformation market size tied to hybrid setups benefits from Gaia-X federation protocols, yet inconsistent APIs inflate migration costs by 15-20%.
On-premise remains essential for defense, nuclear energy and other critical infrastructure. German automotive suppliers now retain sensitive CAD data locally while running analytics in public cloud, a compromise that lowers total cost of ownership by 22% while maintaining compliance. Complexity gaps spur demand for orchestration platforms from VMware, Red Hat and HashiCorp, carving white space for service providers that specialize in multi-cloud governance.
By Enterprise Size: SMEs Narrow the Digital Divide
Large enterprises represented 55.62% of 2025 spending because they can fund multi-year modernization roadmaps and negotiate hyperscaler discounts.[3]European Commission, “Digital Decade Policy Programme 2030,” digital-strategy.ec.europa.eu SMEs, however, are forecast to grow at a 10.34% CAGR, bolstered by EUR 3 billion (USD 3.51 billion) in Spain’s Kit Digital vouchers and EUR 1.9 billion (USD 2.23 billion) in Italy’s PNRR tranche.
Seventy-three percent of SMEs favor low-code tools that accelerate deployment without deep coding skills, but 58% outsource cloud management to close the talent gap. Vendor lock-in risk climbs as switching costs rise toward 50% of initial spend, yet Central and Eastern European firms leapfrog legacy systems by adopting cloud-native stacks from day one, positioning the sub-region as an experimentation hub for new digital business models.
Geography Analysis
Germany’s entrenched industrial base anchors Europe digital transformation market size leadership, yet its 8.9% 2026-2031 CAGR trails the regional average as Mittelstand firms prioritize incremental over disruptive upgrades. Spain’s tax incentives and streamlined permitting slash data-center build times from 36 to 18 months, redirecting hyperscaler capital away from saturated hubs in Frankfurt and Amsterdam. France’s mandatory migration of public workloads to sovereign platforms is reshaping procurement in defense and finance, creating addressable demand for Bleu and Delos Cloud solutions.
The United Kingdom balances regulatory independence with the need for cross-border data flows, leveraging the GBP 2.5 billion National AI Research Resource to court startups while maintaining adequacy decisions that keep fintech operations contiguous with EU clients. Italy channels PNRR funds into northern industrial regions, stimulating cloud adoption among historically conservative machinery exporters. The Netherlands remains a continental landing pad for subsea cables and Internet exchange points, but new zoning restrictions on hyperscale facilities are redirecting some projects to neighboring Belgium and Denmark.
Central and Eastern Europe emerge as cost-effective alternatives for managed services and edge data centers. Poland and Romania showcase university talent pipelines and renewable power availability, supporting workload spillover from Germany and the Nordics. The geography dynamic underscores a shift from labor-arbitrage models toward regulatory-arbitrage strategies that optimize tax credits, green-power quotas and data-sovereignty incentives.
Mordor Intelligence examines the digital transformation (dx) market across diverse other regional markets as well, including Middle East, Latin America, and Asia, while also offering granular country-level perspectives for United Kingdom, Netherlands, Poland, France, Italy, and Spain and more.
Competitive Landscape
The top five vendors (Microsoft, Amazon Web Services, SAP, Google Cloud and Accenture) captured an estimated 38% of 2025 revenue, indicating moderate concentration without a dominant incumbent. Hyperscalers differentiate through Gaia-X compliance, geofenced regions, and partnerships with telcos for 5G edge services, collectively investing EUR 15 billion (USD 17.57 billion) between 2024 and 2026 to secure sensitive workloads. Systems integrators pivot toward pre-configured industry clouds, collapsing deployment timelines from 18 to under six months and shifting margin pools from custom coding to platform subscription models.
European quantum startups IQM and Pasqal draw triple-digit funding rounds to challenge U.S. vendors in drug discovery and logistics optimization use cases. Sovereign-cloud ventures Bleu in France and Delos Cloud in Germany exploit regulatory mandates to win public-sector contracts, though the scale economics remain uncertain. Meanwhile, managed service providers and multi-cloud orchestration platforms fill skills gaps for 61% of enterprises that lack the internal competence to coordinate complex hybrid estates.
Vendor success increasingly depends on vertical specialization. Siemens integrates CAD, PLM and IoT in Xcelerator for discrete manufacturers, while Dassault Systèmes tailors 3DEXPERIENCE to aerospace and life sciences, creating deep switching costs. Hyperscalers respond with vertical-modular stacks, but regulatory scrutiny over data sovereignty continues to shape competitive moats.
Europe Digital Transformation Industry Leaders
Accenture plc
Microsoft Corporation
IBM Corporation
Google LLC (Alphabet)
SAP SE
- *Disclaimer: Major Players sorted in no particular order

Recent Industry Developments
- December 2025: Amazon Web Services earmarked EUR 7.8 billion (USD 9.13 billion) to expand Frankfurt and Berlin regions through 2030, adding 12 availability zones tailored for AI training workloads.
- November 2025: IQM delivered the EU’s first utility-scale 54-qubit quantum processor to the Leibniz Supercomputing Centre in Munich.
- October 2025: Siemens and NVIDIA announced a joint venture to merge Xcelerator and Omniverse for industrial metaverse applications.
- September 2025: SAP introduced Rise with SAP for Public Cloud on Deutsche Telekom and OVHcloud infrastructure, winning EUR 180 million (USD 210.80 million) in initial contracts.


Research Methodology Framework and Report Scope
Market Definitions and Key Coverage
Our study considers the European digital transformation market as all paid value generated when private and public organizations deploy, integrate, and sustain cloud platforms, advanced connectivity, AI and analytics tools, cybersecurity layers, IoT devices, and supporting services that together modernize business models and workflows across every vertical. Spending is tracked in USD and mapped to the country where the transformation project is delivered.
Scope exclusion: revenue from purely analog consulting or stand-alone hardware that never connects to a digital platform is left outside the counting frame.
Segmentation Overview
- By Technology
- Artificial Intelligence and Machine Learning
- Extended Reality (VR and AR)
- Internet of Things (IoT)
- Cloud Services
- Quantum Computing
- Blockchain
- Industrial Robotics
- Additive Manufacturing / 3D Printing
- Digital Twin, Mobility and Connectivity
- Other Technologies
- By End-User Industry
- Manufacturing
- Oil, Gas and Utilities
- Retail and E-Commerce
- Transportation and Logistics
- Healthcare and Life-Sciences
- BFSI
- Telecom and IT
- Government and Public Sector
- Other End-User Industries (Education, Media and Entertainment, Environment)
- By Deployment Mode
- Public Cloud
- On-Premise
- Hybrid
- By Enterprise Size
- Large Enterprises
- Small and Medium Enterprises (SMEs)
- By Country
- Germany
- France
- United Kingdom
- Italy
- Spain
- Netherlands
- Rest of Europe
Detailed Research Methodology and Data Validation
Primary Research
Multiple discussions with CIOs, hyperscale vendors, system integrators, and sector bodies across Germany, France, the UK, Spain, and the Nordics allowed us to validate cost structures, year-one versus recurring spend ratios, and near-term project pipelines that secondary data could not reveal.
Desk Research
We began with structured scans of open data sets from Eurostat, the European Commission's Digital Economy and Society Index, national ICT trade statistics, and filings lodged at the SEC and Euronext. Policy documents such as the EU Digital Europe Program, GDPR impact notes, and Horizon Europe work programs helped us gauge regulatory funding flows. Analyst teams then pulled firm-level revenue splits and contract disclosures through D&B Hoovers, Dow Jones Factiva, and select patent clusters via Questel to understand technology adoption velocity. These are illustrative sources; many additional feeds informed our baseline.
Market-Sizing and Forecasting
A top-down reconstruction starts with reported ICT investment and digital public funding per economy, which is then filtered through adoption ratios for cloud, AI, and IoT derived from Eurostat surveys. Supplier roll-ups of sampled average selling price times volume on key software modules offer a bottom-up cross-check, letting us tighten leakages. Core drivers in the model include 5G population coverage, EU Digital Decade grant disbursements, enterprise cloud penetration, and GDPR compliance outlays. Multivariate regression on these indicators underpins the 2025-2030 outlook, while scenario analysis tests shocks such as abrupt budget freezes.
Data Validation and Update Cycle
Outputs pass a multi-step variance scan where analysts compare totals with independent signals like quarterly vendor bookings before leadership sign-off. We refresh figures annually and trigger mid-cycle updates if material legislation or megadeals move the market.
Why Mordor's Europe Digital Transformation Baseline Resonates
Published estimates seldom align because firms slice technologies differently, apply unique currency conversions, and refresh at uneven intervals.
Key gap drivers here center on scope width (some omit cybersecurity services), treatment of on-premise license renewals, and cadence. Mordor analysts update every twelve months versus multi-year cycles elsewhere.
Benchmark comparison
| Market Size | Anonymized source | Primary gap driver |
|---|---|---|
| USD 403.84 B (2025) | Mordor Intelligence | |
| USD 249.9 B (2024) | Regional Consultancy A | Narrow tech basket, excludes post-deployment managed services |
| USD 203.9 B (2024) | Industry Journal B | Counts hardware only when bundled with SaaS, refreshes every three years |
These comparisons show that by aligning scope to real purchasing patterns, confirming inputs with on-ground experts, and revisiting models each year, Mordor Intelligence delivers a balanced, decision-ready baseline clients can trust.


Key Questions Answered in the Report
What is the current value of the Europe digital transformation market?
It is valued at USD 442.11 billion in 2026, with a forecast to reach USD 692.18 billion by 2031.
Which technology segment is expanding the fastest across Europe?
Quantum computing posts the quickest growth, advancing at an 11.32% CAGR through 2031.
Why are hybrid cloud architectures gaining traction in Europe?
Enterprises combine on-premise and public cloud to meet NIS2 and GDPR data-sovereignty rules while keeping costs under control.
How does Spain compare with Germany in adoption momentum?
Germany currently spends the most, yet Spain is the fastest-growing country with a 12.52% CAGR projected through 2031.
What is the main talent challenge for SMEs?
A shortage of cloud architects and cybersecurity professionals leaves 42% of SMEs unable to fill key roles, prompting reliance on managed services.
Which companies dominate sovereign-cloud solutions in Western Europe?
Bleu in France and Delos Cloud in Germany are leading ventures that win public-sector contracts requiring strict data residency.
Page last updated on:


