Australia And New Zealand Digital Transformation Market Size and Share
Market Overview
| Study Period | 2020 - 2031 |
|---|---|
| Forecast Data Period | 2026 - 2031 |
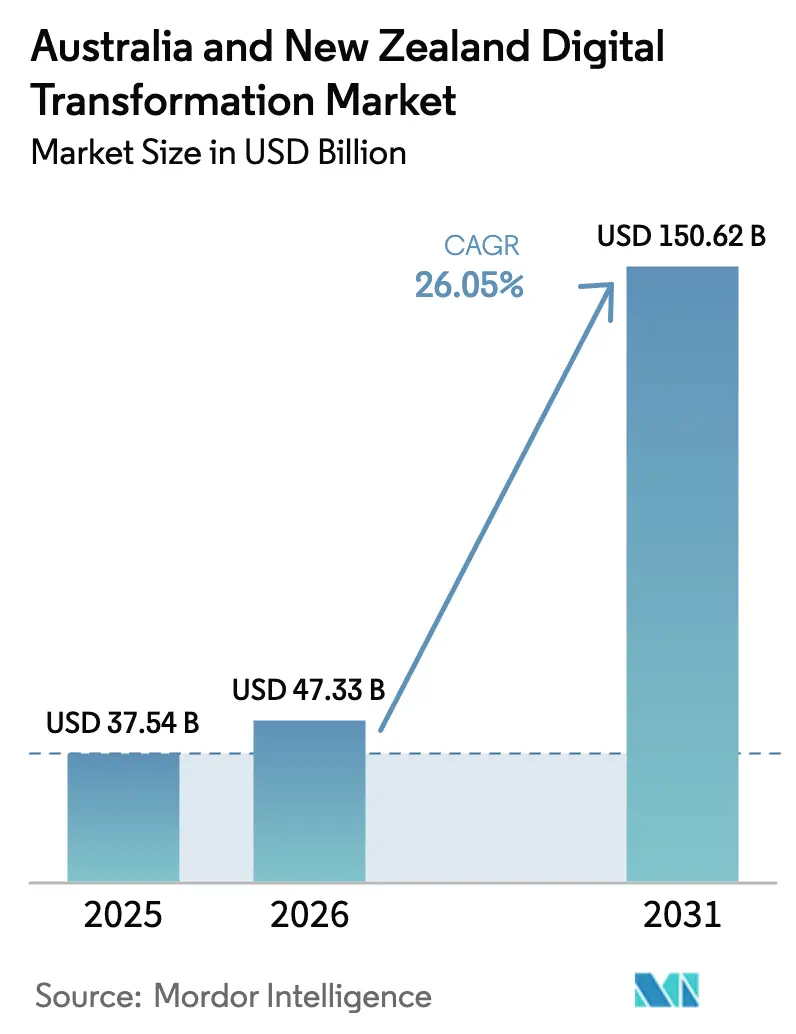
| Base Year Market Size (2025) | USD 37.54 Billion |
| Market Size (2026) | USD 47.33 Billion |
| Market Size (2031) | USD 150.62 Billion |
| Growth Rate (2026 - 2031) | 26.05% CAGR |
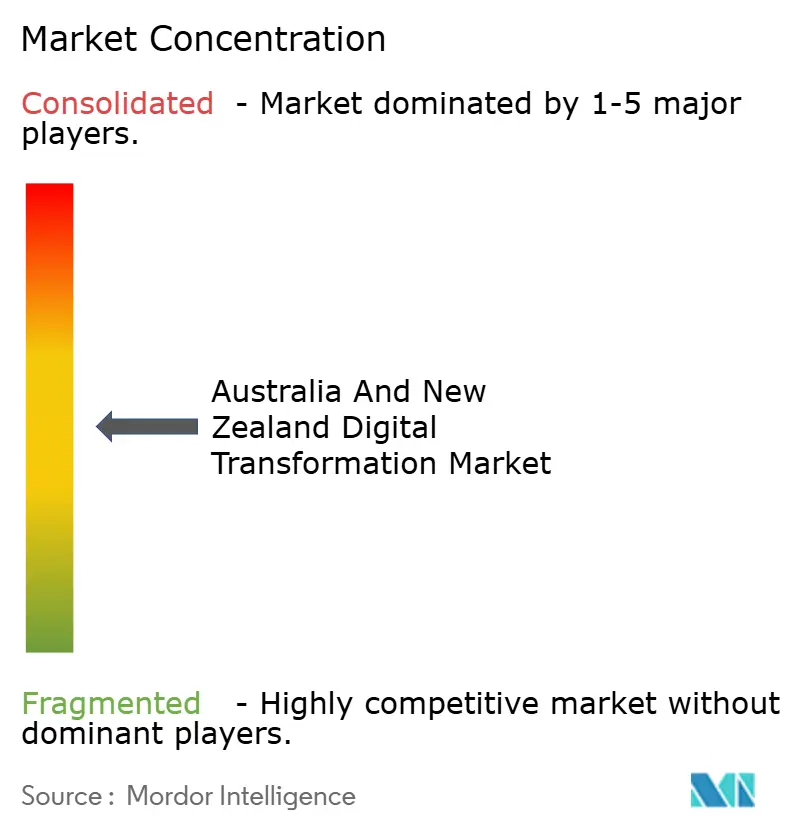
| Market Concentration | Medium |
Major Players *Disclaimer: Major Players sorted in no particular order Image © Mordor Intelligence. Reuse requires attribution under CC BY 4.0. | |
Australia And New Zealand Digital Transformation Market Analysis by Mordor Intelligence
The Australia and New Zealand digital transformation market size was valued at USD 37.54 billion in 2025 and estimated to grow from USD 47.33 billion in 2026 to reach USD 150.62 billion by 2031, at a CAGR of 26.05% during the forecast period (2026-2031). Heightened public-sector mandates, rapid enterprise cloud migration, and large-scale data-center capital expenditure are combining to create an ecosystem where sovereign-ready infrastructure and cross-border technology standards are commercially decisive. Queensland’s AUD 1 billion (USD 640 million) Digital Economy Strategy and New Zealand’s Digital Strategy for Aotearoa are funneling multi-year funding into cloud, AI, and cybersecurity rollouts, accelerating demand beyond ordinary budget cycles. Microsoft’s AUD 5 billion (USD 3.2 million) program for nine domestic data centers has allowed locally hosted cloud services to capture 71.97% deployment share in 2024 while underpinning the segment’s 28.70% CAGR outlook. Financial institutions remain the region’s largest investors, yet logistics operators are adopting digital platforms even faster as Asia-Pacific trade corridors push for predictive fulfilment and real-time visibility. Australia commands 78.22% of spending thanks to its larger enterprise base, whereas New Zealand’s 31.73% CAGR signals an increasingly balanced two-country growth narrative inside the wider Trans-Tasman technology corridor.
Key Report Takeaways
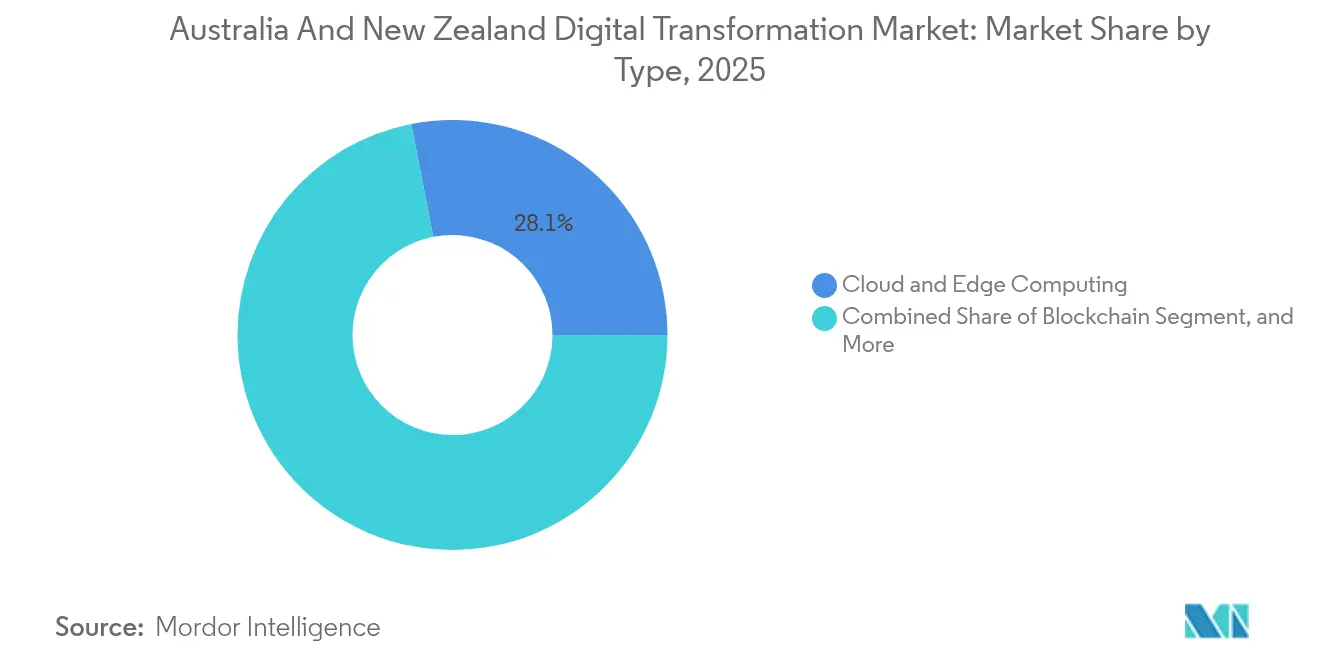
- By technology, Cloud and Edge Computing led with 28.08% revenue share in 2025; Blockchain is forecast to expand at a 29.01% CAGR through 2031.
- By end-user industry, banking, financial services and insurance accounted for 17.25% of 2025 revenue, while transportation and logistics is projected to register a 28.21% CAGR to 2031.
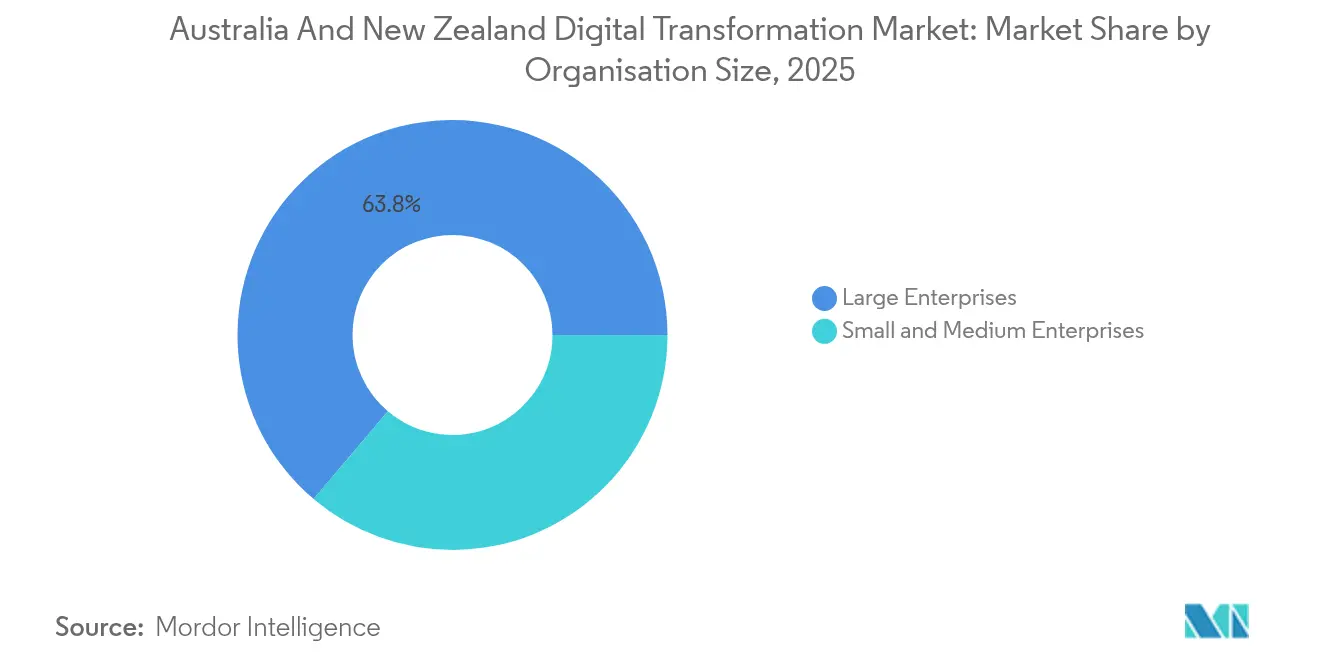
- By organisation size, large enterprises held 63.82% share in 2025; small and medium enterprises are expected to advance at a 27.6% CAGR over the same period.
- By deployment mode, cloud captured 71.20% share in 2025 and is positioned to grow at a 28.15% CAGR through 2031.
- By geography, Australia represented 77.65% revenue share in 2025, while New Zealand is set for the fastest growth at a 31.1% CAGR.
Note: Market size and forecast figures in this report are generated using Mordor Intelligence’s proprietary estimation framework, updated with the latest available data and insights as of 2026.
Australia And New Zealand Digital Transformation Market Trends and Insights
Drivers Impact Analysis*
| Driver | (~) % Impact on CAGR Forecast | Geographic Relevance | Impact Timeline |
|---|---|---|---|
| Government digital transformation funding programs | +4.50% | Australia and New Zealand, concentrated in Queensland, NSW, Wellington | Medium term (2-4 years) |
| Surge in cloud adoption among small and medium enterprises | +3.20% | Australia and New Zealand, stronger in metropolitan areas | Short term (≤ 2 years) |
| Proliferation of big data analytics and AI platforms | +2.80% | Australia and New Zealand, concentrated in financial services hubs | Medium term (2-4 years) |
| Rising demand for robust cybersecurity frameworks | +1.90% | Australia and New Zealand, heightened in critical infrastructure sectors | Short term (≤ 2 years) |
| Nationwide rollout of digital identity ecosystems | +1.50% | Australia leading, New Zealand following with interoperability focus | Long term (≥ 4 years) |
| Sustainability-driven digitalisation in mining and agriculture | +1.20% | Australia concentrated in WA and QLD, New Zealand in Canterbury and Waikato | Medium term (2-4 years) |
| Source: Mordor Intelligence | |||
Government Digital Transformation Funding Programs
Queensland’s AUD 1 billion (USD 640 million) Digital Economy Strategy obliges state agencies to adopt cloud-first architectures and AI-enabled service workflows, anchoring multi-year procurement cycles that favour scalable platforms and local data residency. New Zealand’s Digital Strategy for Aotearoa allocates NZD 200 million to cross-agency infrastructure, pairing the funds with mandatory interoperability standards that disincentivize siloed point solutions. The Australian Public Service’s 2025 workforce plan requires 40% of roles to incorporate AI tools, ensuring sustained enterprise-software demand that ripples through partner ecosystems. Federal procurement rules under the Digital ID Act 2024 award preference points to locally hosted solutions, effectively subsidizing private data-center investments. These mechanisms lengthen contract durations, oblige vendors to maintain in-country compliance resources, and establish predictable cash flows that underpin the Australia and New Zealand digital transformation market.
Surge in Cloud Adoption Among Small and Medium Enterprises
Cost-aware SMEs are migrating workloads at speed, helped by Microsoft’s new data-center footprint that delivers enterprise-grade services without up-front capital expense. The AWS whole-of-government agreement, worth AUD 13.2 billion (USD 8.45 billion) creates channel frameworks that smaller firms can ride via resellers, lowering entry barriers. OECD data shows that Trans-Tasman SMEs post cloud-usage rates 23% higher than European counterparts, a difference driven by geographic remoteness and the need for frictionless export connectivity. The embedded-finance segment, forecast to expand from USD 4.2 billion in 2023 to USD 17.7 billion by 2029, demonstrates how cloud-native payment rails remove reliance on traditional banking infrastructure. As subscription-based software replaces periodic hardware refresh cycles, SMEs are translating operating-expense flexibility into accelerated adoption of AI, automation, and analytics platforms inside the Australia and New Zealand digital transformation market.
Proliferation of Big Data Analytics and AI Platforms
Australian banks spent roughly AUD 3.5 billion (USD 2.24 billion) on AI systems in 2024, moving beyond pilots into production deployments for both customer interaction and risk analytics. Commonwealth Bank’s “Hey CommBank” virtual assistant and Westpac’s large-scale AI-agent rollout illustrate the pivot towards conversational and autonomous workflows. With the Australian Government issuing voluntary AI safety standards, enterprise buyers now reference these benchmarks in tenders, shaping vendor roadmaps even in the absence of binding regulation. Supply-chain operators are achieving double-digit efficiency gains through predictive analytics, prompting adjacent industries such as health and utilities to replicate the blueprint. These adoption patterns cement data engineering, model-ops, and real-time analytics as core capabilities that sustain double-digit expansion inside the Australia and New Zealand digital transformation market.
Rising Demand for Robust Cybersecurity Frameworks
Average breach costs climbed to AUD 4.26 million (USD 2.72 billion) in 2024, a 27% rise versus 2020, pushing cyber-risk from peripheral concern to board-level priority. The Cyber Security Act 2024 mandates critical-infrastructure operators to implement specific controls, converting previously elective spending into compliance-driven outlays. New Zealand’s Privacy Act revisions require demonstrable technical safeguards rather than policy documentation, compelling investments in encryption, privileged-access management, and threat-monitoring platforms. The Essential Eight framework, originally written for government entities, now appears in private-sector RFPs across finance, healthcare, and logistics. As boards link cyber-resilience to license-to-operate risk, premium demand shifts toward locally operated SOCs and managed-security services, widening addressable revenue inside the Australia and New Zealand digital transformation market.
Restraints Impact Analysis*
| Restraint | (~) % Impact on CAGR Forecast | Geographic Relevance | Impact Timeline |
|---|---|---|---|
| Data privacy and security concerns | -2.10% | Australia and New Zealand, heightened in healthcare and financial services | Short term (≤ 2 years) |
| Shortage of advanced digital talent | -1.80% | Australia and New Zealand, acute in Sydney, Melbourne, Auckland | Medium term (2-4 years) |
| Legacy technology debt in public sector agencies | -1.40% | Australia and New Zealand, concentrated in federal and state government departments | Long term (≥ 4 years) |
| Fragmented state-level procurement regulations | -0.90% | Australia primarily, with spillover effects in New Zealand cross-border operations | Medium term (2-4 years) |
| Source: Mordor Intelligence | |||
Data Privacy and Security Concerns
Complex, overlapping privacy statutes in Australia and New Zealand delay cloud migrations as enterprises reconcile divergent breach-notification triggers, cross-border data-flow restrictions, and sector-specific retention rules. For healthcare and financial institutions, fines tied to annual turnover intensify risk aversion, causing phased rollouts rather than wholesale moves to public cloud. Data-residency clauses further inflate infrastructure costs for New Zealand companies reliant on Australian-hosted services, compelling some to deploy redundant environments across both jurisdictions.
Shortage of Advanced Digital Talent
AI-related vacancies climbed 75% during 2024 while the qualified-candidate pool stagnated, creating project backlogs across banking, utilities, and government agencies. University programs are scaling cloud and data-science curricula, yet 18-24-month graduation cycles leave a near-term execution gap. Australian employers are recruiting in New Zealand and vice versa, increasing salary competition and prompting remote-work arrangements that strain organizational culture and security protocols. Limited headcount contributes to elongated implementation timelines, tempering the short-run expansion pace inside the Australia and New Zealand digital transformation market.
*Our forecasts treat driver/restraint impacts as directional, not additive. The impact forecasts reflect baseline growth, mix effects, and variable interactions.
Segment Analysis
By Type: Cloud Infrastructure Dominates While Blockchain Accelerates
The Cloud and Edge Computing segment commanded 28.08% of 2025 revenue within the Australia and New Zealand digital transformation market share, cementing its status as the foundational layer for enterprise modernization. Elevated data-center availability, paired with regulatory incentives for sovereign hosting, pushes mission-critical workloads onto hyperscale platforms at a 28.15% CAGR. Blockchain, buoyed by the National Blockchain Roadmap and cross-border trade trials, is on track for a 29.01% CAGR, the strongest trajectory across all technologies in the Australia and New Zealand digital transformation market. Pilot success in customs clearance and supply-chain transparency is translating into budgeted production projects, drawing in logistics providers and agri-exporters seeking immutable audit trails.
Extended Reality solutions are advancing through state-funded education and health pilots, where empirical evidence shows improved learning retention and surgical-simulation accuracy. Internet of Things deployments are proliferating in mining pits and smart cities, generating streaming data that necessitates edge inference and secure backhaul. Industrial Robotics is rebounding amid skilled-labour gaps, while additive manufacturing shifts from prototyping to limited-run production in aerospace and orthopaedic implants. Across these diverse stacks, cybersecurity remains a gating layer, its uptake tied directly to compliance readiness and the need to safeguard high-value digital assets inside the Australia and New Zealand digital transformation industry.


By End-User Industry: Financial Services Lead While Logistics Accelerates
Banking, financial services and insurance captured 17.25% of 2025 spending and continue to allocate above-market budgets to core-system renewal, customer-experience overhauls, and real-time fraud analytics, thereby underpinning the Australia and New Zealand digital transformation market size for enterprise applications. Transportation and logistics, projected at a 28.21% CAGR, is scaling IoT telematics, AI-powered route optimization, and warehouse automation as e-commerce and regional trade agreements intensify margin pressure. Manufacturing ranks third by value but is outpacing global peers on generative-AI pilot success rates, pivoting to hyper-automated quality-control lines and predictive maintenance routines.
Healthcare investments center on interoperable electronic records and digital-front-door initiatives, propelled by government grants that require vendor adherence to open-data exchange standards. Oil, gas and utilities prioritize digital-twin modelling for asset integrity and emissions tracking, aligning capital outlays with sustainability metrics. Retail and e-commerce deploy embedded-finance plugins and AI product-recommendation engines to compete against multinational marketplaces, reinforcing the breadth of demand stoking the Australia and New Zealand digital transformation market.
By Organisation Size: Large Enterprises Dominate While SMEs Show Superior Growth
Large enterprises governed 63.82% of 2025 revenue across the Australia and New Zealand digital transformation market, leveraging deep IT budgets to execute multi-domain modernization programs spanning cloud migration, advanced analytics, and cyber-resilience hardening. Their investment cycles now encompass multi-cloud governance and FinOps optimization, themes that lock in recurring service revenue for systems integrators. In contrast, SMEs are slated for a 27.6% CAGR as subscription-based pricing grants parity access to AI, robotic-process automation, and embedded-finance modules that once demanded seven-figure capex. The OECD notes Trans-Tasman SMEs exceed European cloud-adoption rates by 23%, an indicator of structural digitization urgency that feeds directly into the Australia and New Zealand digital transformation market size for SaaS offerings.
SME buying behaviour favours integrated suites over single-point tools, accelerating vendor proliferation of bundled ERP, CRM, and HRM packages designed for limited-staff environments. Manufacturing SMEs are adopting cloud-native supply-chain systems, aided by channel partners such as Atturra, which expanded Infor M3 coverage to mid-market factories. Access to fintech-driven working-capital solutions removes historical financing bottlenecks, allowing SMEs to synchronize technology investment with revenue realization.
By Deployment Mode: Cloud Dominance Accelerates Across All Segments
Cloud deployment captured 71.20% of current spending and is projected to rise in tandem with data-center capacity, localization mandates, and maturing multi-cloud management toolsets. Where sensitive workloads remain on-premises, hybrid blueprints coupling private-cloud islands with public-cloud elasticity serve as migration stepping stones while satisfying latency or regulatory constraints. Emerging edge patterns complement central clouds, enabling low-latency analytics near IoT data sources in mines, ports, and agricultural fields. The Digital ID Act 2024’s residency preferences motivate hyperscale’s to launch availability zones in secondary cities, expanding regional fault tolerance and lowering last-mile network costs inside the Australia and New Zealand digital transformation market.
On-premises solutions persist across defense and legacy manufacturing, but even those sectors are layering container orchestration atop bare-metal assets to ease future lift-and-shift. Vendor roadmaps increasingly package managed edge appliances bundled with zero-trust security, streamlining adoption for organizations that lack in-house DevOps expertise. Collectively, these deployment archetypes illustrate the converging trajectory of cloud, hybrid, and edge architectures within the Australia and New Zealand digital transformation industry.
Geography Analysis
Australia held 77.65% of 2025 revenue, anchoring the Australia and New Zealand digital transformation market with its diversified enterprise base, robust venture-capital flows, and multi-layer government policy stack that mandates cloud-first procurement and cybersecurity compliance. Canberra’s Digital ID framework and the Cyber Security Act 2024 require both public agencies and private contractors to certify against domestic hosting standards, driving direct demand for hyperscale and colocation facilities. New South Wales and Queensland spearhead state-level funding, creating concentrated innovation clusters in Sydney and Brisbane, where universities, start-ups, and multinational vendors co-locate to access grants and talent. Western Australia’s mining, resources, and agribusiness sectors are digitizing field operations with IoT telemetry and edge analytics, expanding regional demand beyond the dominant eastern seaboard. Victoria’s health-tech corridor in Melbourne leverages statewide interoperability mandates to trial AI diagnostics and telehealth, broadening use-case diversity across the Australia and New Zealand digital transformation market. Tasmania and the Northern Territory, though smaller in absolute spending, benefit from nationwide connectivity upgrades such as satellite backhaul partnerships that mitigate geographic isolation.
New Zealand, posting a 31.1% CAGR, channels NZD 200 million in cross-agency digital infrastructure toward interoperable platforms that align with Australian counterparts, ensuring seamless data exchange along the Trans-Tasman corridor. Wellington’s public-service reforms adopt citizen-centric service design, creating reference architectures that private firms emulate for customer-experience revamps. Auckland’s fintech and SaaS communities leverage Australian data-center proximity for low-latency hosting, enabling rapid scaling without domestic hyperscale build-out. Provincial regions such as Canterbury and Waikato seize sustainability-led projects in aggrotech, underpinning edge-analytics rollouts that feed climate-smart farming initiatives. Collectively, these patterns affirm the geographic integration that underpins a contiguous, two-node growth engine for the Australia and New Zealand digital transformation market.
Competitive Landscape
The Australia and New Zealand digital transformation market features moderate concentration as global hyperscalers establish sovereign-ready footprints while local specialists exploit regulatory complexity niches. Microsoft’s AUD 5 billion (USD 3.2 billion) investment vaulted its Infrastructure-as-a-Service share to 30.9%, narrowly ahead of Amazon Web Services at 30.1%, redefining competitive benchmarks for latency, compliance, and price bundling. Google Cloud, Oracle, and IBM pursue sector-specific footholds, aligning with regulated industries such as healthcare and energy to emphasize data-sovereignty accreditations.
Partnership-driven strategies dominate: Telstra added 21,000 Microsoft Copilot licenses, Coles inked a five-year transformation pact with Microsoft, and universities orchestrated wholesale cloud migrations that lock in multiyear annuity streams. Consulting integrators like Accenture, Deloitte, and Datacom orchestrate cross-vendor stacks, addressing skills deficits while embedding themselves in long-tail managed-service contracts. Local software vendors TechnologyOne, WiseTech Global, MYOB, and Xero capitalize on cultural proximity and domestic compliance familiarity to secure mid-market and public-sector workloads.
White-space contenders include compliance-automation start-ups that parse divergent Trans-Tasman privacy statutes into executable policy code, reducing onboarding friction for multinational entrants. Quantum-computing pioneer PsiQuantum and room-temperature-focused Quantum Brilliance represent frontier bets attracting public-sector grants and defense interest. As AI integration becomes table stakes, competitive differentiation hinges on transparent model governance, sovereign-cloud attestations, and the capacity to embed vertical-specific IP into cloud-native microservices consumed by an increasingly demanding customer base inside the Australia and New Zealand digital transformation market.
Australia And New Zealand Digital Transformation Industry Leaders
Accenture PLC
Google LLC (Alphabet Inc.)
Siemens AG
IBM Corporation
Microsoft Corporation
- *Disclaimer: Major Players sorted in no particular order

Recent Industry Developments
- September 2025: Advent International acquired Automic Group for more than USD 500 million, enhancing automation capabilities across ANZ enterprises.
- April 2025: FNZ raised USD 500 million to expand its wealth-management platform across Asia-Pacific markets.
- March 2025: Microsoft completed its first three Australian data centers under the AUD 5 billion infrastructure plan.
- January 2025: Quantum Brilliance secured USD 20 million in Series A funding to advance room-temperature quantum-computing technology.


Australia And New Zealand Digital Transformation Market Report Scope
Digital transformation is the process of incorporating digital technologies such as artificial intelligence and machine learning, extended reality (VR & AR) for industrial applications, IoT, industrial robotics, blockchain, digital twins, 3D printing/ additive manufacturing, industrial cyber security, wireless connectivity, edge computing, smart mobility, and others across various end-user industries.
Australia And New Zealand Digital Transformation market is segmented by type (analytics, artificial intelligence, and machine learning extended reality (XR), IoT, industrial robotics, blockchain, additive manufacturing/3D printing, cybersecurity, cloud and edge, computing, and others (digital twin, mobility, and connectivity), by end-users (manufacturing, oil, gas, and utilities, retail & e-commerce, transportation, and logistics, healthcare, BFSI, telecom, and IT, government and public sector, Others (education, media & entertainment, environment etc). The market sizes and forecasts are provided in terms of value in USD for all the above segments.
| Analytics, Artificial Intelligence and Machine Learning |
| Extended Reality (XR) |
| Internet of Things (IoT) |
| Industrial Robotics |
| Blockchain |
| Additive Manufacturing / 3D Printing |
| Cybersecurity |
| Cloud and Edge Computing |
| Others Types (Digital Twin, Mobility and Connectivity) |
| Manufacturing |
| Oil, Gas and Utilities |
| Retail and E-commerce |
| Transportation and Logistics |
| Healthcare |
| Banking, Financial Services and Insurance |
| Telecommunications and IT |
| Government and Public Sector |
| Others End-User Industry (Education, Media and Entertainment) |
| Large Enterprises |
| Small and Medium Enterprises |
| On-premises |
| Cloud |
| Australia |
| New Zealand |
| By Type | Analytics, Artificial Intelligence and Machine Learning |
| Extended Reality (XR) | |
| Internet of Things (IoT) | |
| Industrial Robotics | |
| Blockchain | |
| Additive Manufacturing / 3D Printing | |
| Cybersecurity | |
| Cloud and Edge Computing | |
| Others Types (Digital Twin, Mobility and Connectivity) | |
| By End-User Industry | Manufacturing |
| Oil, Gas and Utilities | |
| Retail and E-commerce | |
| Transportation and Logistics | |
| Healthcare | |
| Banking, Financial Services and Insurance | |
| Telecommunications and IT | |
| Government and Public Sector | |
| Others End-User Industry (Education, Media and Entertainment) | |
| By Organisation Size | Large Enterprises |
| Small and Medium Enterprises | |
| By Deployment Mode | On-premises |
| Cloud | |
| By Geography | Australia |
| New Zealand |


Key Questions Answered in the Report
What is the forecast revenue for the Australia and New Zealand digital transformation market by 2031?
The market is projected to generate USD 150.62 billion in 2031, up from USD 47.33 billion in 2026.
Which technology segment currently earns the largest share of spending?
Cloud and Edge Computing holds the top position with 28.08% of 2025 revenue.
How fast is blockchain technology expected to grow across the region?
Blockchain solutions are forecast to expand at a 29.01% CAGR between 2026 and 2031.
Which end-user industry is expanding at the fastest pace?
Transportation and logistics is set to grow at a 28.21% CAGR through 2031.
Why do SMEs represent an important growth engine?
Subscription-priced cloud and AI services allow SMEs to adopt advanced tools, producing a 27.6% forecast CAGR for the segment.
What share of spending does cloud deployment already command?
Cloud deployment accounted for 71.20% of total revenue in 2025 and continues to rise.
Page last updated on:


