Size and Share of Digital Transformation Market In Retail Industry
Market Overview
| Study Period | 2020 - 2031 |
|---|---|
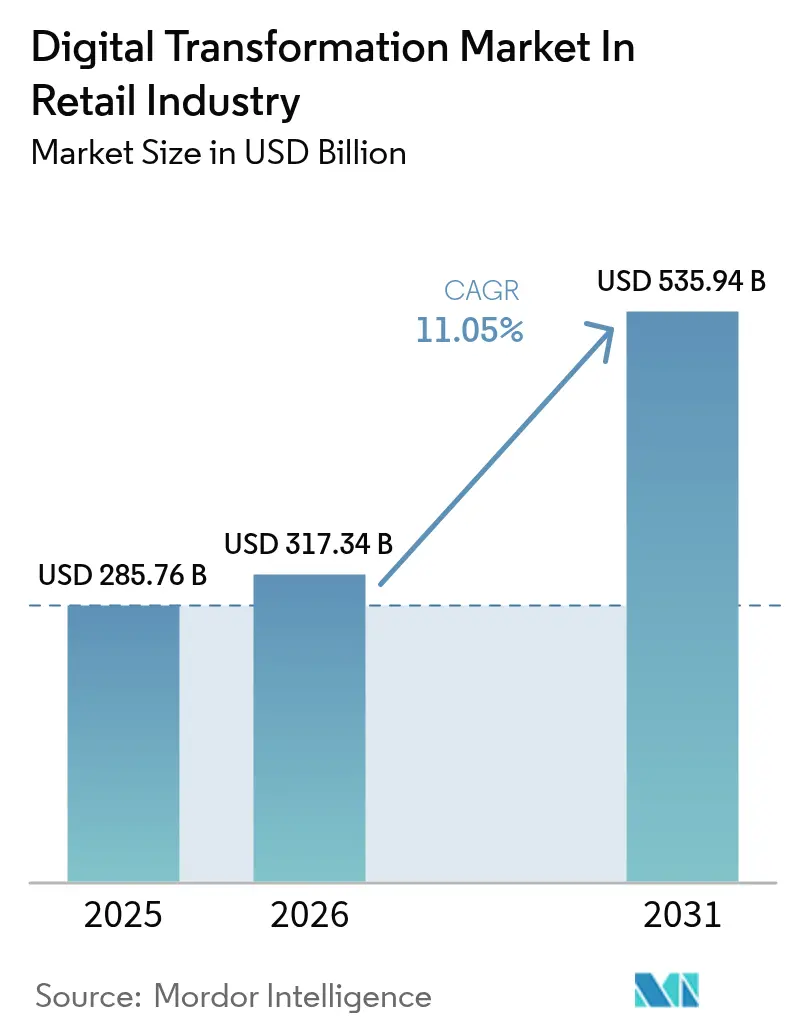
| Market Size (2026) | USD 317.34 Billion |
| Market Size (2031) | USD 535.94 Billion |
| Growth Rate (2026 - 2031) | 11.05% CAGR |
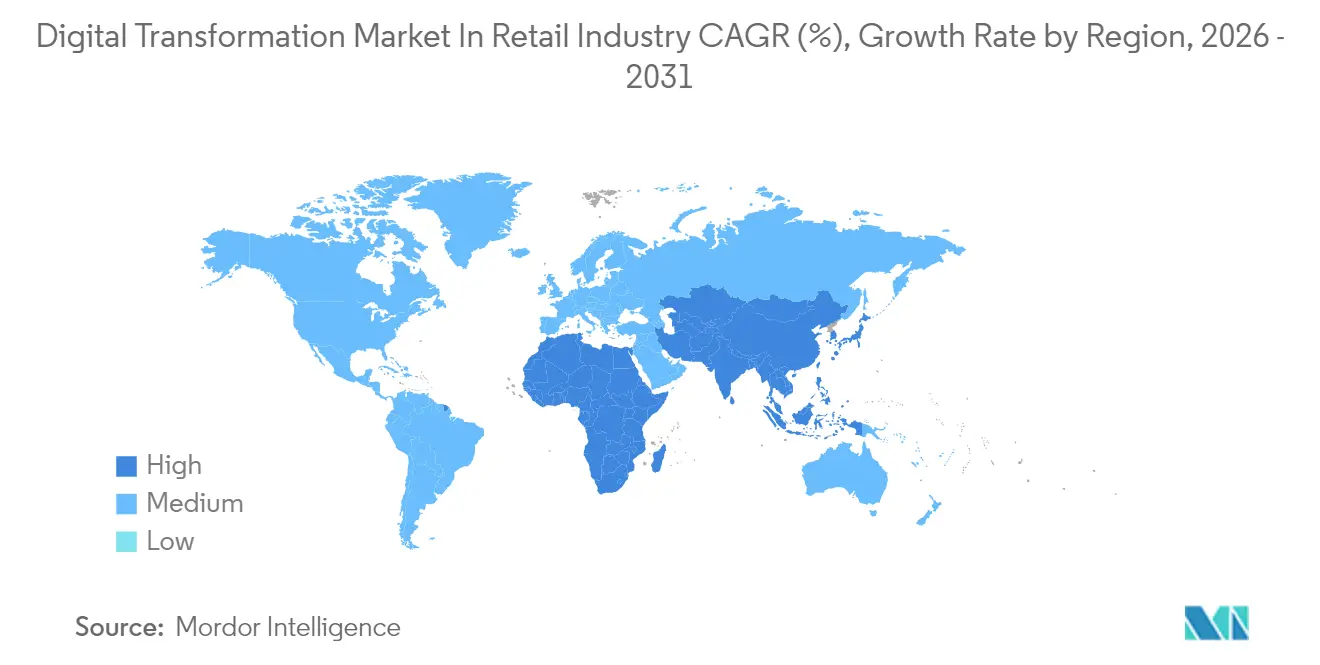
| Fastest Growing Market | Africa |
| Largest Market | Asia Pacific |
| Market Concentration | Medium |
Major Players *Disclaimer: Major Players sorted in no particular order Image © Mordor Intelligence. Reuse requires attribution under CC BY 4.0. | |
Analysis of Digital Transformation Market In Retail Industry by Mordor Intelligence
The digital transformation in retail market size is expected to grow from USD 285.76 billion in 2025 to USD 317.34 billion in 2026 and is forecast to reach USD 535.94 billion by 2031 at 11.05% CAGR over 2026-2031. The shift from transaction-centric to experience-driven models positions data-rich, edge-enabled experiences as the primary source of competitive advantage. Cloud platforms anchor most modernization programs, but retailers are turning to real-time analytics to eliminate latency in merchandising and customer engagement.[1]Sundar Pichai, “Google Cloud Next Retail Keynote 2025,” Google.com GenAI pilots in labor scheduling, inventory forecasting, and contextual search materially raise productivity while retail media networks add high-margin revenue streams. As robotics, IoT sensors, and computer vision mature, retailers lower operating costs and unlock new service blueprints-migrating the digital transformation market from optional efficiency plays to mandatory modernization paths that preserve market relevance.
Key Report Takeaways
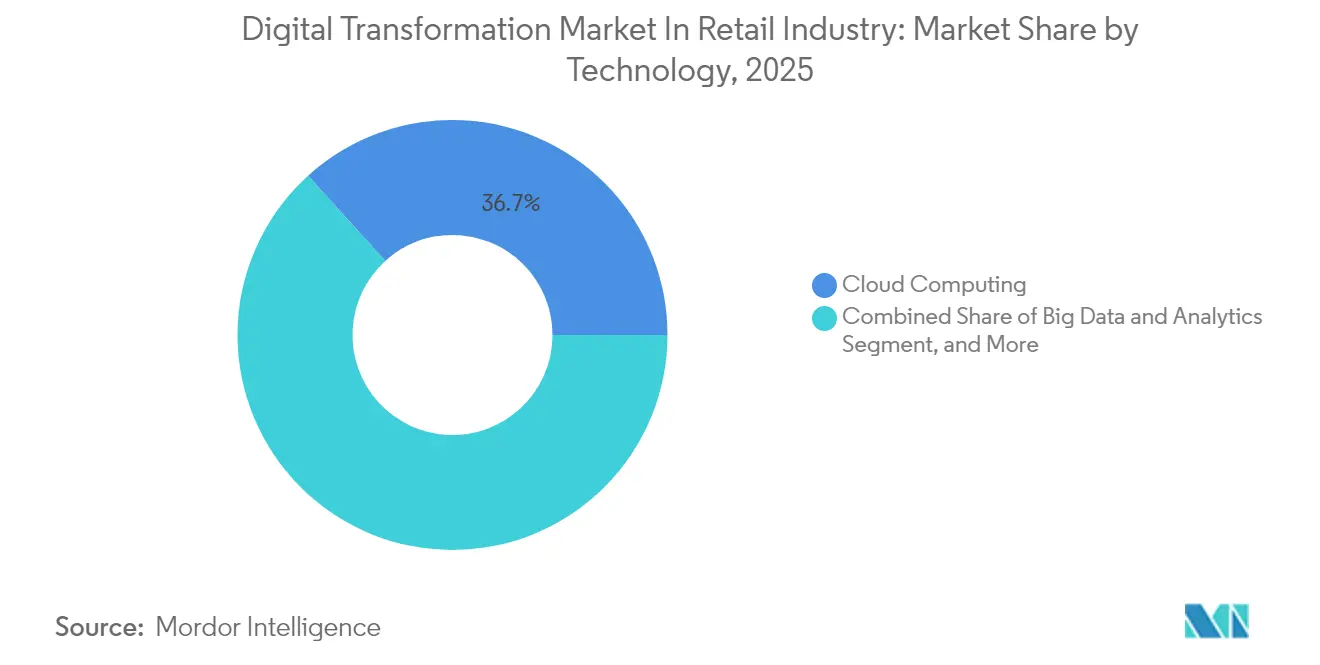
- By technology, cloud computing led with 36.72% of digital transformation market share in 2025; augmented and virtual reality is forecast to advance at a 13.52% CAGR to 2031.
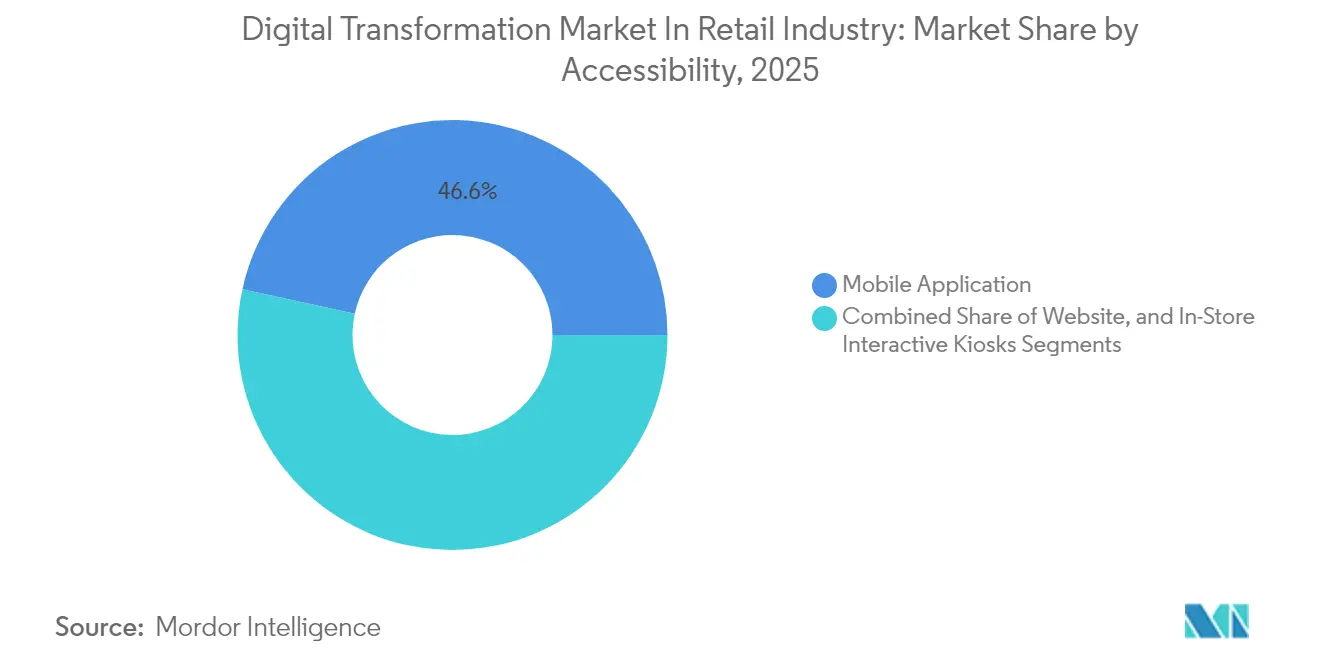
- By accessibility channel, mobile applications commanded 46.58% of the digital transformation market size in 2025, whereas in-store interactive kiosks are tracking a 11.86% CAGR through 2031.
- By product category, apparel accounted for a 24.05% share of the digital transformation market size in 2025, and beauty and personal care is set to grow at a 13.06% CAGR by 2031.
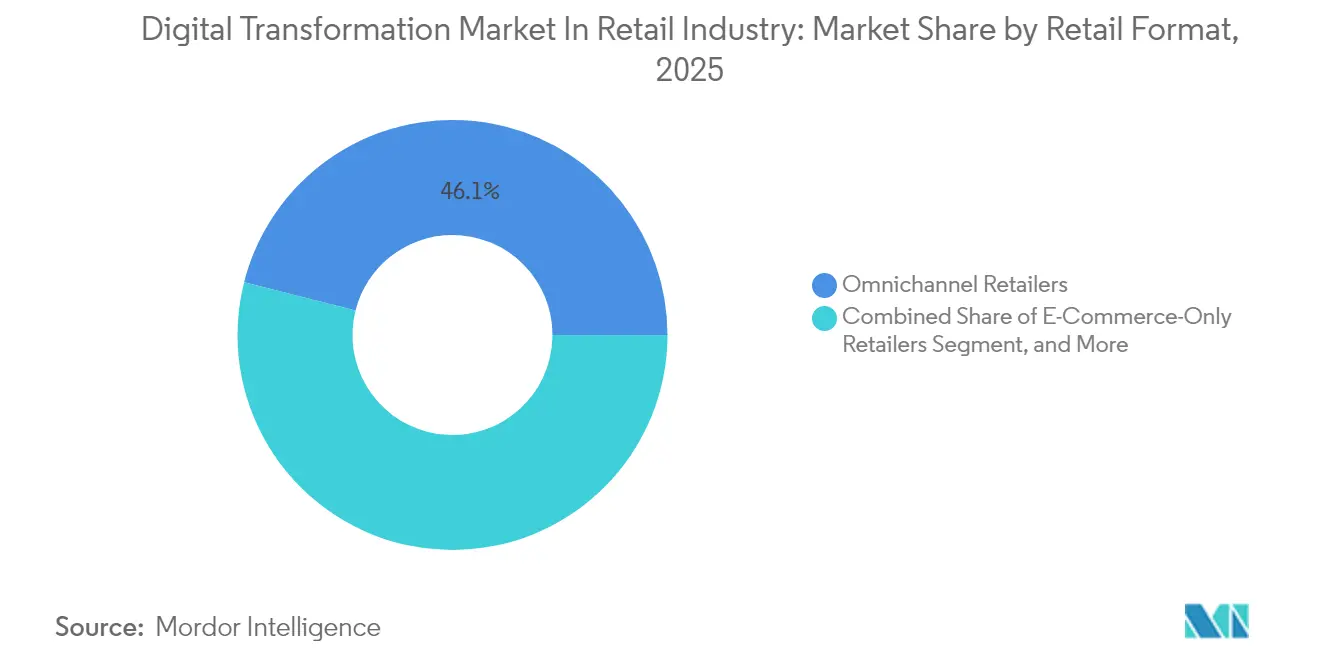
- By retail format, omnichannel retailers represented 46.05% of the digital transformation market share in 2025, and brick-and-mortar specialty stores are pacing a 12.34% CAGR through 2031.
- By Deployment Mode, cloud implementations accounted for 61.75% of the digital transformation market in 2025 and are projected to advance at a 12.2% CAGR by 2031.
- By organization size, large enterprises controlled 57.84% of the digital transformation market size in 2025; small and medium enterprises are poised to expand at an 11.72% CAGR to 2031.
- By geography, Asia Pacific held 34.72% of the digital transformation market share in 2025, while Africa is expected to post a 12.09% CAGR to 2031.
Note: Market size and forecast figures in this report are generated using Mordor Intelligence’s proprietary estimation framework, updated with the latest available data and insights as of 2026.
Insights and Trends of Digital Transformation Market In Retail Industry
Drivers Impact Analysis*
| Driver | (~) % Impact on CAGR Forecast | Geographic Relevance | Impact Timeline |
|---|---|---|---|
| Increased usage of smart devices | +2.1% | Global, led by Asia Pacific | Medium term (2-4 years) |
| Rapid uptake of cloud-native POS and OMS platforms | +1.8% | North America and Europe, expanding to Asia Pacific | Short term (≤2 years) |
| Proliferation of real-time inventory visibility through edge IoT sensors | +1.5% | Global, concentrated in developed markets | Medium term (2-4 years) |
| Retail workforce optimization via generative AI assistants | +1.7% | Global, early adoption in developed markets | Medium term (2-4 years) |
| Explosion of retail media networks monetizing first-party data | +1.3% | North America and Europe | Short term (≤2 years) |
| Mandatory e-receipt regulations in Europe driving paperless checkout | +0.9% | Europe core, spillover to other regions | Long term (≥4 years) |
| Source: Mordor Intelligence | |||
Increased Usage of Smart Devices
Smartphones and tablets now anchor daily shopping journeys, turning biometric sign-ins, location prompts, and camera-based search into table-stakes functionality. Target generated double-digit digital sales growth after embedding Store Companion AI to surface on-shelf availability and tailored offers inside its app. Walmart processes more than one-fifth of its online volume through a mobile platform that runs edge-hosted search and pricing logic to keep latency under 300 milliseconds. Retailers that harness sensors and AR overlays inside apps not only lower return rates but also expand average basket sizes, reinforcing network effects that feed smarter personalization engines and higher lifetime value.
Rapid Uptake of Cloud-Native POS and OMS Platforms
Cutting-edge POS and order management stacks run on microservices that sync inventory, pricing, and loyalty data in real time. EE’s deployment of Aptos cloud POS across 600 stores logged 99.9% uptime and trimmed checkout steps by two-fifths, unlocking cross-channel stock visibility at scale. The Vitamin Shoppe realized a 15% rise in fulfillment accuracy after moving to Jumpmind’s cloud OMS, with inventory carrying costs falling by one-quarter. Such API-first systems simplify the addition of curbside pickup, ship-from-store, and buy-online-return-in-store capabilities without code rewrites, accelerating the digital transformation market’s pivot toward unified commerce.
Proliferation of Real-Time Inventory Visibility Through Edge IoT Sensors
Sensor-equipped shelves, RFID tags, and battery-free Bluetooth pixels push item-level status updates to local edge nodes every few seconds. Wiliot now streams environmental and movement data from 120,000 endpoints, creating ambient intelligence without manual scans. Sam’s Club reduced exit wait times to three seconds with computer-vision checkout tied to in-store edge servers. Store teams receive automated replenishment alerts, shrinking stockouts by up to 30% and enabling predictive allocation that lowers working capital needs.
Explosion of Retail Media Networks Monetizing First-Party Data
First-party audience graphs unlock high-margin ad revenue as retailers sell placements on owned sites, apps, and in-store screens. Amazon recorded USD 46.9 billion in 2024 advertising sales, validating retail media as a profit engine detached from product margins.[2]Maria Renz, “Amazon Advertising Results 2024,” Aboutamazon.com The Interactive Advertising Bureau projects USD 74 billion will shift into retail media by 2026, equal to one-quarter of all digital ad spend. Closed-loop attribution elevates conversion accountability, letting brands tie impressions to carts and reorder cycles, while AI-driven bidding optimizes return on ad spend.
Restraints Impact Analysis*
| Restraint | (~) % Impact on CAGR Forecast | Geographic Relevance | Impact Timeline |
|---|---|---|---|
| Legacy store infrastructure compatibility challenges | -1.4% | Global, particularly acute in developed markets | Long term (≥4 years) |
| High upfront capex for end-to-end omnichannel integration | -1.1% | Global, more pronounced for SMEs | Medium term (2-4 years) |
| Heightened cybersecurity exposure with API-first architectures | -0.8% | Global, regulatory focus in Europe and North America | Short term (≤2 years) |
| Data governance complexities across jurisdictions | -0.6% | Global, varying by regulatory regime | Long term (≥4 years) |
| Source: Mordor Intelligence | |||
Legacy Store Infrastructure Compatibility Challenges
Decade-old POS terminals often lack APIs, forcing rip-and-replace projects before omnichannel features can launch. Red Hat notes that six in ten retailers face 18-24 month modernization timelines with integration costs running 40% above cloud-native deployments. Physical retrofits add wiring, cooling, and edge enclosures, stretching payback beyond four years and limiting smaller chains’ ability to keep pace.
High Upfront Capex for End-to-End Omnichannel Integration
Enterprise omnichannel suites cost USD 2-10 million to deploy, with annual run-rates exceeding 20% of initial spend, according to Phoenix Strategy Group. SMEs often cannot absorb the cash outlay or 18-36 month payback window, widening capability gaps and pushing them toward marketplace intermediaries that erode brand equity.
*Our forecasts treat driver/restraint impacts as directional, not additive. The impact forecasts reflect baseline growth, mix effects, and variable interactions.
Segment Analysis
By Accessibility: Mobile-First Commerce Drives Engagement
Mobile apps owned 46.58% of the digital transformation market in 2025, reflecting their lead role in discovery, checkout, and post-purchase engagement. In-store kiosks are tracking a 11.86% CAGR as retailers embed them to extend digital catalogs and self-service returns. Website traffic steadies as responsive design narrows the usability gap with native apps.
High-intent shoppers that toggle between app and kiosk inside a single visit spend 40% more per trip at Best Buy, proving the multiplier effect of seamless channel handoffs. Kiosks fitted with AR mirrors support virtual fittings and personalized cross-sells, while QR-based app logins hand-off customer profiles to shared in-store screens, closing attribution loops and boosting engagement metrics.


By Product Category: Beauty Leads Digital Innovation
Apparel captured 24.05% of the digital transformation market share in 2025, underpinned by size-and-fit algorithms and 3D visualization. Beauty and personal care, expanding at a 13.06% CAGR, leverages AR try-ons to reduce product hesitancy. Electronics players add comparison engines and live-stream demos, and food retailers roll out smart ordering and real-time inventory displays.
Sephora’s Virtual Artist drives 200% higher conversion than static browsing by overlaying shades on customer selfies. Frequent repurchase cycles in beauty amplify the impact of personalized recs and subscription replenishment. In furniture, 3D room planners offset the tactile barrier of large-ticket items, while media retailers optimize streaming bundles and content discovery to lock in recurring revenue.
By Technology: Cloud Computing Enables Scalable Innovation
Cloud platforms held 36.72% of the digital transformation market in 2025, anchoring data lakes and AI services. Edge nodes cut response times for vision-based checkout and localized pricing, while AR/VR adoption rises 13.52% on cheaper headsets and maturing developer tools. IoT sensors and AI together enhance demand forecasting accuracy by 30% at Target.
Walmart’s deployment of 10,000 edge nodes trimmed third-party cloud costs by up to 18% while supporting near-instant analytics at shelf level. Cloud providers bundle AI pipelines, lowering barriers for midsize chains to launch chatbots, conversational search, and intelligent workforce tools that scale elastically with seasonal demand.
By Deployment Mode: Cloud-Native Architecture Dominates
Cloud implementations accounted for 61.75% of the digital transformation market in 2025 and are advancing at a 12.2% CAGR. Flexible capacity, subscription billing, and rapid feature drops drive adoption, particularly among dispersed store networks. Hybrid models persist where data locality or latency constraints demand on-prem processing.
Coles processes 1.6 billion AI predictions each day across Azure to fine-tune inventory and promotions. Edge gateways within stores conduct sub-second inference for price adjustments, while centralized cloud cores orchestrate enterprise-wide analytics and ML model training. On-prem racks remain for payment encryption and regulated data silos but shrink as compliance guardrails evolve.
By Retail Format: Omnichannel Integration Drives Growth
Omnichannel operators controlled 46.05% of the digital transformation market share in 2025 by fusing online, mobile, and store journeys. Specialty chains are advancing at a 12.34% CAGR after layering digital experiences onto curated in-store assortments. Pure-play e-commerce models confront rising logistics costs and ad prices that compress margins.
Nordstrom measures a 15% lift in customer lifetime value among shoppers using three or more channels. Endless-aisle screens let associates source items from fulfillment centers in real time, while click-and-collect options extend selling windows beyond store hours.
By Organization Size: SMEs Accelerate Digital Adoption
Large enterprises held 57.84% of the digital transformation market size in 2025 through hefty R&D budgets and bespoke app stacks. SMEs, growing at an 11.72% CAGR, benefit from SaaS suites that bundle commerce, payments, and analytics.
More than 1 million merchants run on Shopify’s cloud commerce stack, tapping integrated POS and inventory modules without committing capital to servers. Plug-and-play APIs let smaller retailers launch omnichannel initiatives in weeks, eroding the scale advantage of legacy giants and spawning niche DTC challengers.
Geography Analysis
Asia Pacific commanded 34.72% of the digital transformation market in 2025 as mobile-first consumers embraced super apps that fuse payments, social feeds, and logistics. Alibaba, Tencent, and Grab illustrate how integrated ecosystems compress the purchase funnel into a single screen tap. Government incentives for cashless economies accelerate QR-based payment penetration, while domestic cloud providers localize compliance. India and Southeast Asia stage double-digit growth by leapfrogging to mobile wallets and social commerce, delivering 25% higher digital transformation ROI than the global mean.
North America and Europe together capture a sizable share by pioneering retail media networks, labor automation, and compliance-driven digital receipts. The EU’s e-receipt mandates ignite POS refresh cycles, while strict privacy codes push zero-party data strategies. U.S. majors scale in-house ad tech and computer vision checkout, setting operational benchmarks for the digital transformation market.
Africa is on course for a 12.09% CAGR through 2031, fueled by mobile money platforms such as M-Pesa and Flutterwave that bypass card networks. Mastercard projects regional digital payments of USD 1.5 trillion by 2030. South Africa and Nigeria lead with fintech ecosystems that dovetail with social commerce and agent networks, enabling micro-retailers to accept digital wallets without legacy POS hardware.

Competitive Landscape
The digital transformation market is moderately fragmented as broad-suite vendors, cloud hyperscalers, and specialist startups vie for budget. SAP, Oracle, and Microsoft deliver end-to-end commerce stacks, while focused players like Shopify, Salesforce, and Square package function-specific modules that integrate via open APIs. Amazon Web Services, Google Cloud, and Microsoft Azure intensify rivalry by embedding machine learning accelerators and retail-focused blueprints.
Specialists in computer vision (Standard AI), IoT (Wiliot), and edge orchestration (Emfas) proliferate, empowering retailers to adopt best-of-breed solutions, though integration complexity rises. System integrators such as Accenture and Capgemini capture value through advisory and rollout expertise.[4]Karthik Narain, “Accenture Retail Technology Outlook 2025,” Accenture.com Retailers increasingly demand modular, subscription-based tools to avoid vendor lock-in, pushing incumbents to unbundle monolithic suites and publish public APIs.
Leaders of Digital Transformation Market In Retail Industry
SAP SE
Oracle Corporation
IBM Corporation
Microsoft Corporation
Salesforce Inc.
- *Disclaimer: Major Players sorted in no particular order


Recent Industry Developments
- January 2025: Google Cloud and Everseen partnered to roll out Vision AI across 120,000 edge cameras, enabling near-instant loss prevention alerts and shrink analytics.
- December 2024: Wonder acquired Grubhub for USD 650 million, creating a hybrid delivery and ghost-kitchen network powered by predictive demand models.
- November 2024: Microsoft and Estée Lauder Companies opened an AI Innovation Lab to co-create generative beauty tools, including personalized regimen advisors and AR try-ons.
- October 2024: Standard AI purchased Skip Self-Checkout, combining autonomous checkout software with edge analytics that reconcile inventory in real time.


Scope of Report on Digital Transformation Market In Retail Industry
Digital Transformation is a movement from point solutions that deliver incremental value to integrated process and technology solutions that provide transformational outcomes in terms of Business Efficiency, Customer Experience, and/or Business Innovation. The Digital Transformation Market in Retail is segmented by Accessibility (Mobile Application, Website), Products (Consumer Electronics, Media and Entertainment, Apparel), Technology (Cloud computing, Big data, AI, IoT, AR/VR), and Geography (North America, Europe, Asia Pacific, Latin America, Middle East & Africa). The market sizes and forecasts are provided in terms of value (USD million) for all the above segments.
| Mobile Application |
| Website |
| In-Store Interactive Kiosks |
| Consumer Electronics |
| Media and Entertainment |
| Apparel |
| Food and Beverage |
| Furniture and Home Decor |
| Beauty and Personal Care |
| Cloud Computing |
| Big Data and Analytics |
| Artificial Intelligence |
| Internet of Things |
| Augmented Reality and Virtual Reality |
| On-Premise |
| Cloud |
| Hybrid |
| E-Commerce-Only Retailers |
| Omnichannel Retailers |
| Brick-and-Mortar Specialty Stores |
| Large Enterprises |
| Small and Medium Enterprises |
| North America | United States |
| Canada | |
| South America | Brazil |
| Mexico | |
| Argentina | |
| Europe | Germany |
| United Kingdom | |
| France | |
| Rest of Europe | |
| Asia Pacific | China |
| Japan | |
| India | |
| Rest of Asia Pacific | |
| Middle East | Saudi Arabia |
| United Arab Emirates | |
| Rest of Middle East | |
| Africa | South Africa |
| Nigeria | |
| Rest of Africa |
| By Accessibility | Mobile Application | |
| Website | ||
| In-Store Interactive Kiosks | ||
| By Product Category | Consumer Electronics | |
| Media and Entertainment | ||
| Apparel | ||
| Food and Beverage | ||
| Furniture and Home Decor | ||
| Beauty and Personal Care | ||
| By Technology | Cloud Computing | |
| Big Data and Analytics | ||
| Artificial Intelligence | ||
| Internet of Things | ||
| Augmented Reality and Virtual Reality | ||
| By Deployment Mode | On-Premise | |
| Cloud | ||
| Hybrid | ||
| By Retail Format | E-Commerce-Only Retailers | |
| Omnichannel Retailers | ||
| Brick-and-Mortar Specialty Stores | ||
| By Organization Size | Large Enterprises | |
| Small and Medium Enterprises | ||
| Geography | North America | United States |
| Canada | ||
| South America | Brazil | |
| Mexico | ||
| Argentina | ||
| Europe | Germany | |
| United Kingdom | ||
| France | ||
| Rest of Europe | ||
| Asia Pacific | China | |
| Japan | ||
| India | ||
| Rest of Asia Pacific | ||
| Middle East | Saudi Arabia | |
| United Arab Emirates | ||
| Rest of Middle East | ||
| Africa | South Africa | |
| Nigeria | ||
| Rest of Africa | ||


Key Questions Answered in the Report
What is the projected value of the digital transformation market in retail by 2031?
The digital transformation market is forecast to reach USD 535.94 billion by 2031, growing at an 11.05% CAGR.
Which technology currently holds the largest share of spending?
Cloud computing accounts for 36.72% of total spend, serving as the foundation for data storage, analytics, and application hosting.
Which product category is expanding the fastest under digitization programs?
Beauty and personal care is advancing at a 13.06% CAGR on the back of virtual try-on and personalization capabilities.
Why is Asia Pacific pivotal to global growth momentum?
The region combines mobile-first consumer behavior with super apps that bundle payments, social commerce, and logistics, driving the highest regional ROI on transformation spend.
How do retail media networks impact profitability?
By monetizing first-party data, retailers garner high-margin ad revenue that sits outside product sales, with top performers adding double-digit margin points.
What key barrier limits omnichannel rollouts for smaller retailers?
High upfront capital expenditure-often topping USD 2 milliondiscourages SMEs from deploying end-to-end omnichannel stacks despite clear long-term benefits.
Page last updated on:


