AI Carbon Footprint Management Software Market Size and Share
Market Overview
| Study Period | 2020 - 2031 |
|---|---|
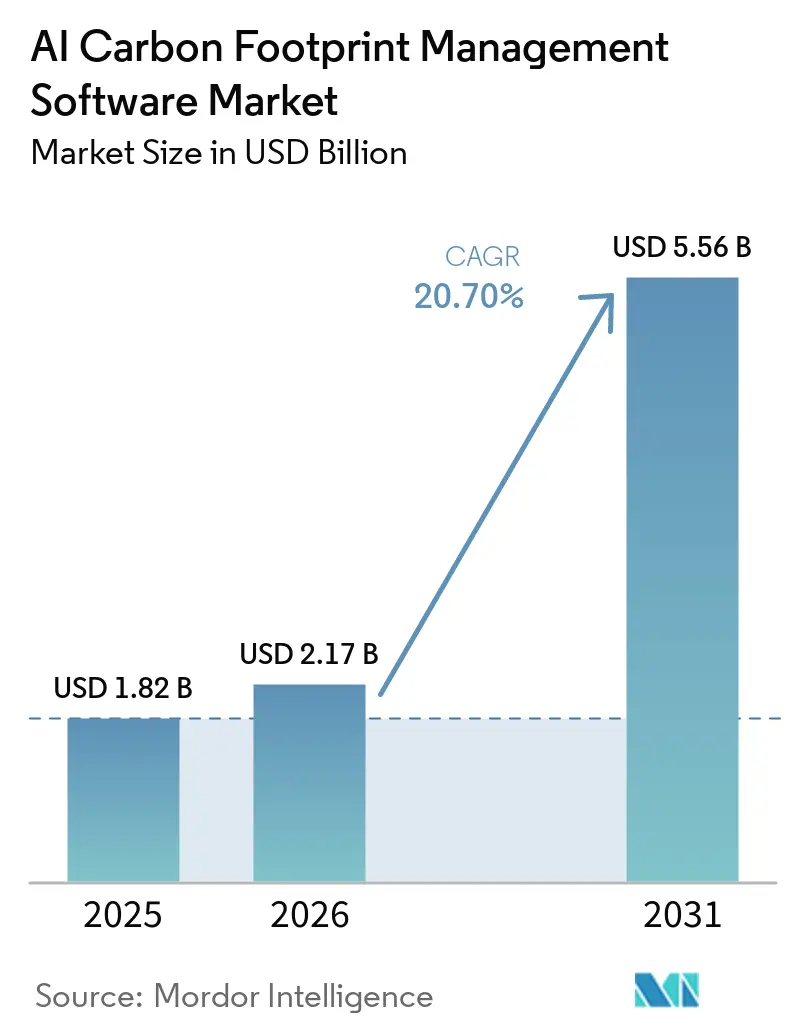
| Market Size (2026) | USD 2.17 Billion |
| Market Size (2031) | USD 5.56 Billion |
| Growth Rate (2026 - 2031) | 20.70% CAGR |
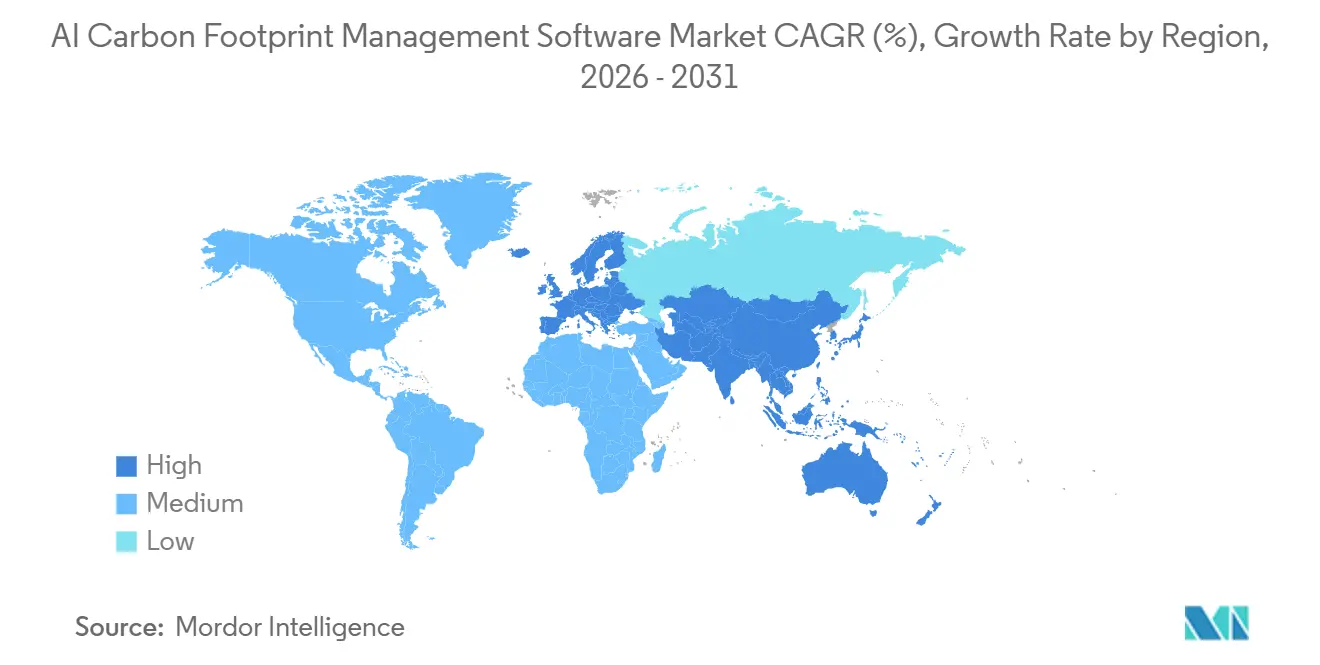
| Fastest Growing Market | Asia-Pacific |
| Largest Market | Europe |
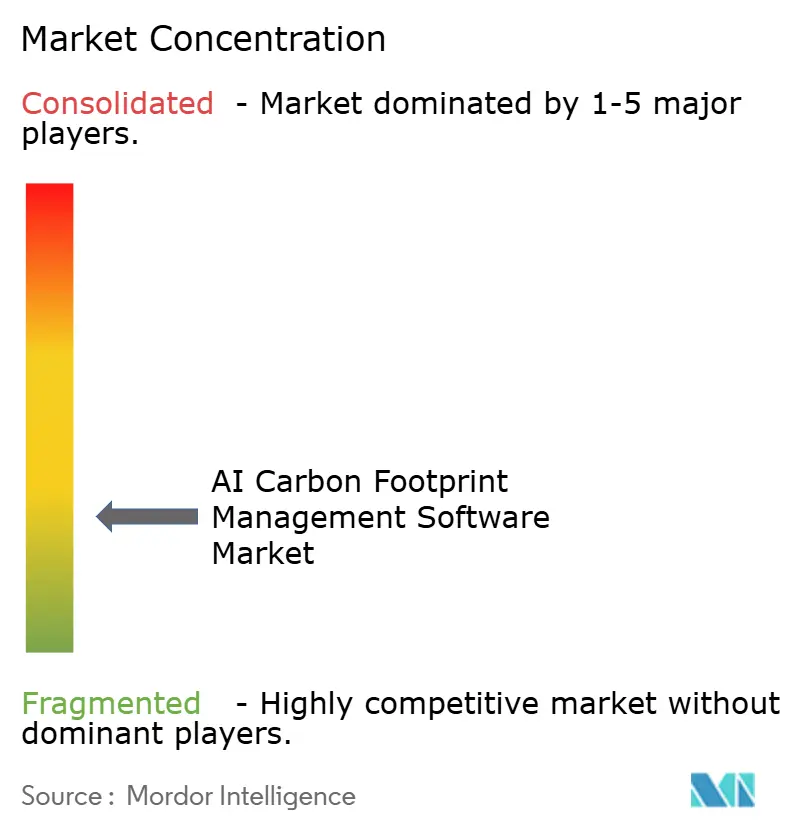
| Market Concentration | Low |
Major Players *Disclaimer: Major Players sorted in no particular order Image © Mordor Intelligence. Reuse requires attribution under CC BY 4.0. | |
AI Carbon Footprint Management Software Market Analysis by Mordor Intelligence
The AI carbon footprint management software market size was valued at USD 1.82 billion in 2025 and is forecast to reach USD 5.56 billion by 2031 at a CAGR of 20.70% from 2026 to 2031. Carbon accounting has moved beyond a voluntary sustainability task and has become a compliance-led operating requirement, closer to finance, procurement, and ERP workflows. Demand is being supported by a combination of formal disclosure rules, stronger board oversight, and software tools that reduce manual effort in emissions measurement and reporting. The buyer base is also broadening, as large companies now expect emissions data from suppliers outside the first wave of direct reporting mandates. That indirect pull is bringing smaller organizations into the AI carbon footprint management software market earlier than their own reporting deadlines would suggest. The result is a market with durable growth support across regions, deployment models, and customer types, even as data quality and integration challenges continue to shape vendor selection and implementation timing.
Key Report Takeaways
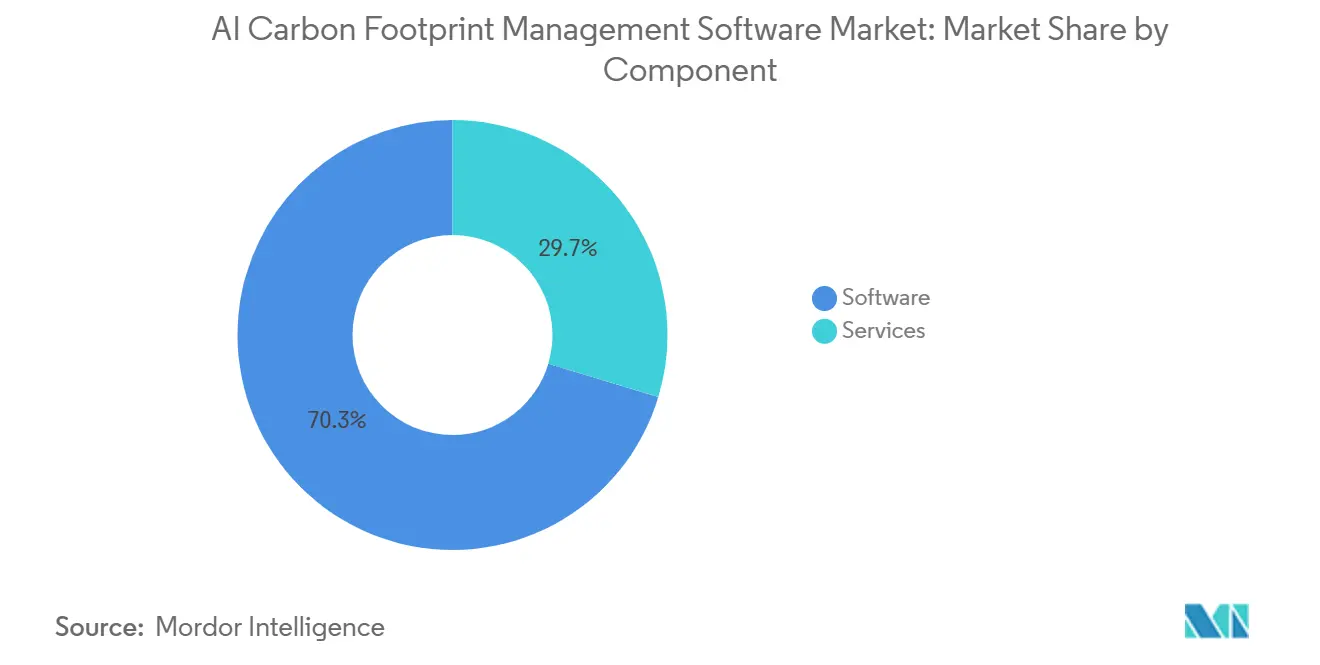
- By component, software held 70.34% share of the AI carbon footprint management software market revenue in 2025, while services are projected to expand at a 21.45% CAGR through 2031.
- By deployment mode, cloud-based deployment accounted for 67.12% of revenue in 2025, while hybrid deployment is projected to grow at a 22.08% CAGR through 2031.
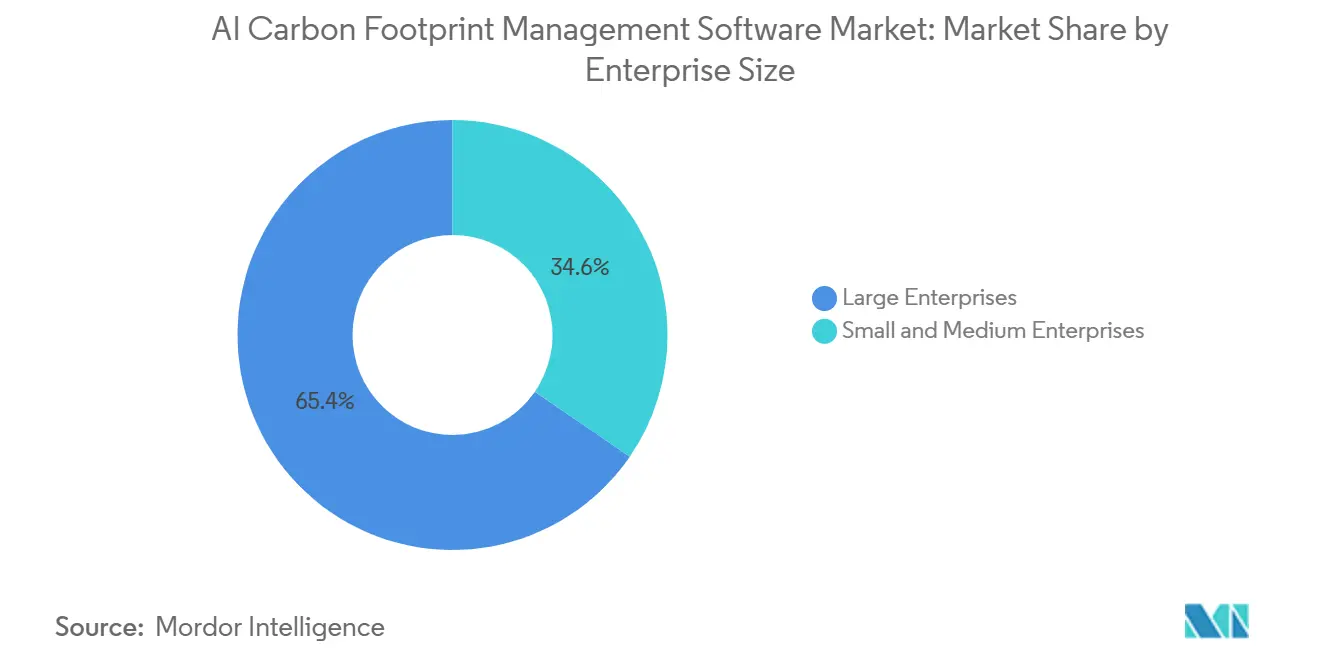
- By enterprise size, large enterprises held 65.41% of revenue in 2025, while SMEs are projected to record the fastest growth at a 21.92% CAGR through 2031.
- By end-use industry, IT and Telecom led with a 26.84% revenue share in 2025, while Retail and E-Commerce are projected to expand at a 21.05% CAGR through 2031.
- By geography, Europe held 34.56% share of the AI carbon footprint management software market in 2025, while Asia-Pacific is projected to grow at a 22.67% CAGR through 2031.
Note: Market size and forecast figures in this report are generated using Mordor Intelligence’s proprietary estimation framework, updated with the latest available data and insights as of January 2026.
Global AI Carbon Footprint Management Software Market Trends and Insights
Drivers Impact Analysis*
| Driver | (~) % Impact on CAGR Forecast | Geographic Relevance | Impact Timeline |
|---|---|---|---|
| Rising Regulatory Pressure for Scope 1, Scope 2, and Scope 3 Disclosure | +5.2% | Global, concentrated in EU, United States, Australia, Canada, and Japan | Short term (≤ 2 years) |
| Corporate Net-Zero Commitments and Science Based Targets Adoption | +4.1% | Global, led by Europe, East Asia, and North America | Medium term (2-4 years) |
| AI-Powered Automation Reducing Manual Carbon Data Workflows | +3.8% | Global, highest adoption velocity in North America and Western Europe | Medium term (2-4 years) |
| Enterprise Demand for Audit-Ready Sustainability Reporting | +3.0% | North America and EU core, with spillover to APAC | Short term (≤ 2 years) |
| Supplier-Level Carbon Visibility Requirements in Complex Value Chains | +2.4% | APAC core, spillover to Middle East and Africa | Medium term (2-4 years) |
| Integration of Carbon Data With ERP, EHS, and Financial Reporting Systems | +1.8% | Global | Long term (≥ 4 years) |
| Source: Mordor Intelligence | |||
Rising Regulatory Pressure For Scope 1, Scope 2, and Scope 3 Disclosure
Mandatory disclosure rules now cover a larger share of the corporate reporting base than in earlier phases of emissions reporting, providing direct growth support for the AI carbon footprint management software market. The EU Corporate Sustainability Reporting Directive required the first wave of companies, around 500 large public-interest entities with more than 500 employees, to publish ESRS-compliant sustainability statements in 2025 for fiscal 2024 data.[1]European Commission, “Corporate Sustainability Reporting,” European Commission, finance.ec.europa.eu California's Climate Corporate Data Accountability Act requires Scope 1 and Scope 2 reporting from August 10, 2026, for entities with more than USD 1 billion in annual revenue that do business in the state, and Scope 3 reporting begins in 2027. The practical change in this cycle is that disclosure is increasingly tied to traceability and external review rather than broad estimation, which raises the value of systems that preserve source records, workflow controls, and reporting consistency. That shift makes software adoption less discretionary because companies now need outputs that can withstand regulatory scrutiny and assurance processes, not just internal sustainability reviews.
Corporate Net-Zero Commitments and Science Based Targets Adoption
Corporate decarbonization commitments deepened further in 2025, reinforcing structural demand in the AI carbon footprint management software market. The Science Based Targets initiative reported 9,764 companies with validated near-term targets by the end of 2025, up 40% from 2024, while validated net-zero targets rose 61% to 2,325 companies.[2]Science Based Targets initiative, “SBTi Trend Tracker 2025,” Science Based Targets initiative, sciencebasedtargets.org The same tracker showed that the total number of companies with validated targets or active commitments reached 12,353, suggesting a much larger future reporting and monitoring base than current deployments alone indicate. Asia posted the fastest growth in validated companies, and China recorded 92% growth in validated targets, widening the addressable demand pool in markets previously viewed as less mature for carbon software procurement. SBTi's proposed revision of the Corporate Net-Zero Standard also points toward stricter Scope 3 coverage, encouraging companies to invest earlier in primary data capture and higher-fidelity inventory systems rather than relying on broad averages that may no longer be acceptable.
AI-Powered Automation Reducing Manual Carbon Data Workflows
Manual emissions accounting still consumes a large share of the sustainability team's time, especially in Scope 3 work that requires supplier outreach, invoice extraction, travel records, and repeated data cleaning across multiple systems. Watershed reported that only 43% of sustainability practitioners currently use AI tools in their work, compared with 88% of corporate employees overall, underscoring the room for automation in carbon workflows. The company also stated that early users of its agentic AI capabilities reduced data ingestion time by 87% or more and cut time to actionable emissions data by 80%, with one project falling from 5 hours to 20 minutes. Persefoni launched its Analytics Agent in May 2026 to let users query emissions records in plain language and generate auditable analysis without depending on static dashboards, demonstrating how automation is moving from data collection to interpretation and decision support. As vendors reduce reporting cycle times and the need for manual intervention, automation is becoming a buying factor with direct compliance value rather than a secondary productivity feature.
Enterprise Demand for Audit-Ready Sustainability Reporting
Buyer priorities are shifting from simple emissions visibility to audit-ready reporting, strengthening demand for deeper controls in the AI carbon footprint management software market. SAP Green Ledger, made commercially available in late 2024, applies double-entry accounting logic to carbon records in SAP S/4HANA Cloud, bringing emissions data closer to the standards used in financial accounting and internal controls.[3] SAP SE, “SAP Carbon Accounting and Emissions Management Software,” SAP SE, sap.com IBM expanded that same direction in April 2026 by launching Envizi Emissions Calculations as an Excel add-in through the Microsoft App Marketplace, which lets organizations bring standardized emissions calculations into an environment they already use for governed reporting work. EcoVadis also expanded its Carbon Data Network through partnerships with Watershed and Workiva in 2026, helping procurement teams replace average-based Scope 3 estimates with primary supplier data within reporting environments that are easier to verify. As assurance expectations rise, platforms that can show data lineage, version control, and system-based evidence are gaining a stronger position than tools built mainly for disclosure compilation.
Restraints Impact Analysis*
| Restraint | (~) % Impact on CAGR Forecast | Geographic Relevance | Impact Timeline |
|---|---|---|---|
| High Data Quality Gaps Across Scope 3 Supply Chains | -2.8% | Global, highest risk in APAC and MEA supply chain networks | Medium term (2-4 years) |
| High Implementation and Integration Costs for Mid-Market Buyers | -2.1% | Global, most acute in South America and MEA, emerging in APAC | Medium term (2-4 years) |
| Limited Internal Carbon Accounting Expertise in Emerging Enterprises | -1.6% | APAC, South America, and MEA | Long term (≥ 4 years) |
| Cybersecurity and Data Privacy Concerns in Cloud-Based Carbon Platforms | -1.0% | Global, concentrated in BFSI and government sectors | Long term (≥ 4 years) |
| Source: Mordor Intelligence | |||
High Data Quality Gaps Across Scope 3 Supply Chains
Scope 3 remains the most difficult part of a corporate inventory because the underlying data often sits outside direct operational control and flows through large supplier networks with varying reporting maturity. Normative launched Carbon Inventory Managed Services in February 2026 to address what it described as the last-mile problem, and its GHG Protocol-certified advisors logged more than 1,000 client-support hours in the first 6 weeks of 2026 alone.[4]Normative, “Normative Launches Carbon Inventory Managed Services to Eliminate the Biggest Bottleneck in Carbon Accounting,” GlobeNewswire, kommunikasjon.ntb.no EcoVadis expanded its Carbon Data Network in April 2026 by adding Carbmee, whose Environmental Intelligence System identifies emissions hotspots at the SKU level and links decarbonization actions to financial return metrics, demonstrating the level of granularity buyers now need to improve supplier-level reporting. Even with better platform tools, supplier data collection remains labor-intensive and methodologically uneven, which slows the path from software purchase to full compliance. This restraint matters most in multi-tier supply chains because software can centralize data but cannot immediately address weak primary inputs from every supplier node.
High Implementation and Integration Costs For Mid-Market Buyers
Implementation costs remain a clear restraint for smaller and mid-sized buyers because carbon platforms often require API integration, workflow design, data mapping, employee training, and advisory support before they become part of routine reporting. Peer-reviewed research published by Springer Nature in 2026 found that financial resource constraints and long payback periods were the leading barriers to AI-enabled sustainability adoption in SME manufacturing, ahead of many technical readiness issues. Vendor responses have started to reflect this issue, including managed onboarding services, modular SaaS packaging, and simpler workflow tools such as IBM's Excel-native emissions calculation offering. Even so, many mid-market organizations still depend on outside support for emissions inventory design and regulatory interpretation, which extends total ownership cost beyond license fees alone. This dynamic is pushing competition toward large integrated suites at one end and lower-cost entry tools at the other, while leaving a difficult middle tier that is increasingly served through software-plus-service models
*Our forecasts treat driver/restraint impacts as directional, not additive. The impact forecasts reflect baseline growth, mix effects, and variable interactions.
Segment Analysis
By Component: Software Leads Adoption While Services Gain Strategic Weight
Software accounted for 70.34% of the AI carbon footprint management software market in 2025, indicating that buyers still prefer scalable platforms that centralize Scope 1, 2, and 3 data in a single operating environment. That preference is strongest in larger deployments where companies need multi-entity workflows, standardized methodologies, and consistent reporting structures across business units and jurisdictions. Workiva expanded its platform in May 2026 with CDP 2026 questionnaire support and AI-powered, simplified ESRS intelligence, reflecting how vendors are adding compliance-specific functionality directly into product layers rather than treating it as separate advisory work. SAP's Green Ledger moved in the same direction by bringing transaction-level carbon accounting into S/4HANA Cloud, which supports the broader shift toward carbon-financial integration within systems that finance teams already trust. As carbon data becomes more closely tied to financial reporting, internal controls, and enterprise workflows, software retains its dominant role because it offers repeatability and central governance at scale.
Services are the fastest-growing component, with the AI carbon footprint management software market projected to expand at a 21.45% CAGR for this segment from 2026 to 2031. That growth reflects a clear execution gap between what the platform can automate and what organizations still need people to do, especially when supplier data must be collected, cleaned, and validated. Normative's managed service launch in 2026 showed that buyers continue to pay for hands-on inventory support even when they already have access to software functionality. The service layer is also gaining importance because assurance-ready reporting demands method consistency, evidence handling, and process discipline that many organizations still lack internally. Over time, the line between subscription revenue and delivery support is likely to remain blurred because vendors that can combine software with execution support are better positioned to convert demand into successful reporting outcomes.


By Deployment Mode: Cloud-Based Stays Largest While Hybrid Gains Faster Momentum
Cloud-based deployment held 67.12% of revenue in 2025, while hybrid deployment is set to record the fastest growth at a 22.08% CAGR through 2031. Cloud remained the largest model because it supports real-time APIs, makes supplier updates easier, and enables faster integration with reporting workflows that depend on continuous data refresh. It also aligns with the operating preferences of enterprises that want centralized visibility across sites, functions, and external partners without building new infrastructure at every location. At the same time, the hybrid model is gaining traction because some buyers want advanced analytics and reporting flexibility without moving all raw operational data off-premise. That pattern is especially relevant in regulated settings where sensitive plant, workforce, or process data must stay under tighter internal control even as reporting teams need cloud-scale modeling tools.
Microsoft's 2025 Wave 2 release for Dynamics 365 Business Central, which became generally available in January 2026, added Scope 3 value chain process automation into ERP purchasing workflows, demonstrating how deployment choices are increasingly shaped by the systems companies already use. On-premise deployment still matters in sectors such as oil and gas, defense, and parts of the public sector where emissions data overlaps with commercially sensitive or classified operating information. In that environment, hybrid architecture is less a temporary compromise and more a long-term operating model that combines on-premise control with cloud-based intelligence. The AI carbon footprint management software market is therefore moving toward a layered deployment design, where the data source may remain internal, but analytics, benchmarking, and reporting functions continue to shift to flexible cloud environments.
By Enterprise Size: Large Enterprises Remain The Core Buyer Group While SMEs Expand Quickly
Large enterprises held 65.41% of the AI carbon footprint management software market share in 2025, reflecting the weight of multi-jurisdiction reporting duties, complex supplier bases, and stronger budgets for integration and controls. These companies usually need more than carbon calculation tools because they must manage consolidation across subsidiaries, role-based permissions, framework mapping, and governance processes that resemble financial reporting. They also face greater exposure to third-party assurance, which raises the value of system traceability, approval workflows, and standardized evidence management. Large buyers are therefore more likely to choose platforms that connect sustainability data to ERP, finance, procurement, and risk management processes, rather than treating carbon accounting as a separate reporting task. This helps explain why enterprise-grade software with stronger control features has retained a central role in the AI carbon footprint management software market, even as newer entrants introduce faster automation features.
SMEs are projected to grow at a 21.92% CAGR through 2031, making them the fastest-growing enterprise cohort in the AI carbon footprint management software market. Much of that demand is being created externally, as large companies now require supplier emissions data for Scope 3 reporting, pushing smaller firms into the reporting chain before direct regulation reaches them. The European Commission's Recommendation EU 2025/1710 on the voluntary SME standard formalized a simplified reporting route for companies outside the mandatory scope, while also reinforcing the expectation that they will provide emissions data in larger value-chain disclosures. Research published by Springer Nature also found that ease of use and organizational readiness strongly shape AI-tool adoption in resource-constrained firms, which makes simpler onboarding and clear workflow design important competitive factors in this segment. As supply-chain requests spread across tiers, SME demand is likely to remain one of the broadest expansion channels for the AI carbon footprint management software market.
By End-Use Industry: IT And Telecom Leads Demand While Retail And E-Commerce Advances
IT and Telecom accounted for 26.84% of revenue in 2025, which made it the largest end-use segment in the AI carbon footprint management software market. The sector’s position reflects heavy exposure to power consumption reporting, especially for data center operators and technology infrastructure providers facing multiple disclosure expectations simultaneously. It also reflects a feedback loop in which the expansion of AI computing and digital infrastructure raises energy-related emissions reporting needs, which in turn supports demand for better measurement and reporting software. NTT’s release of cradle-to-grave CO₂ calculation rules for software lifecycles in March 2026 highlighted how the technology sector is moving toward more detailed emission factor standards across development and procurement activities. Manufacturing, energy and utilities, financial services, oil and gas, and public sector buyers each add demand for different reasons, but the IT and Telecom segment remains the clearest concentration point for early and large-scale adoption.
Retail and E-Commerce is projected to grow at a 21.05% CAGR through 2031, reflecting rising pressure for supplier-level transparency in consumer-facing value chains. Large brands and platform operators increasingly need more granular upstream data, as buyers, investors, and reporting standards are placing less weight on broad estimates. Food and beverage companies add a specialized layer to this growth path because SBTi guidance on land-use and agriculture-related emissions pushes them toward more detailed carbon accounting than generic platforms can always handle out of the box. This is one reason sector-specific data partnerships and product libraries are becoming increasingly important in platform competition, especially when agricultural sourcing and product-level emissions need to be tracked together. Healthcare, logistics, construction-linked supply chains, and equipment manufacturing are also entering the AI carbon footprint management software market as Scope 3 data requests continue to spread beyond the first group of directly regulated companies.
Geography Analysis
Europe held 34.56% of the AI carbon footprint management software market share in 2025, maintaining its lead. That position rests on the phased rollout of the CSRD and the broader maturity of corporate climate commitments across large European companies. The Science Based Targets initiative showed that CAC 40 and DAX 40 companies reached target penetration rates of 70% and 68% by the end of 2025, pointing to a deep installed base for ongoing software use, renewals, and upgrades. That mix of regulation and target validation means demand in Europe is not limited to first-time compliance deployments, because many buyers also need better controls, broader Scope 3 coverage, and stronger audit support. The region, therefore, remains the clearest example of how regulatory depth and corporate commitment can reinforce each other inside the AI carbon footprint management software market.
North America moved closer to a stronger adoption phase as regulatory deadlines approached. California's SB 253 created an August 10, 2026, deadline for Scope 1 and Scope 2 disclosure from large entities doing business in the state, with Scope 3 reporting beginning in 2027. The S&P 500 reached 39% SBTi target penetration by the end of 2025, which was below leading European benchmarks and suggests that the region still has meaningful room for new deployments rather than only upgrade demand. Asia-Pacific is projected to expand at a 22.67% CAGR through 2031, making it the fastest-growing geography in the AI carbon footprint management software market. China's 92% increase in SBTi-validated companies in 2025 points to a strong supply-chain spillover effect, while Japan's market is being supported by product launches such as ASUENE IMPACT and by more detailed carbon accounting standards from domestic technology leaders.
South America remained an earlier-stage market, but the direction of travel was positive because reporting expectations and export-linked supply chain requests continued to spread. SBTi target adoption in South America grew 42% in 2025, and Mexico posted a 58% increase in validated companies, showing that cross-border value chains are already influencing software demand in the region. The Middle East and Africa also remained at an earlier stage of adoption, with the UAE and Saudi Arabia as the main demand centers under broader net-zero and investment-led transition agendas. In both regions, the near-term trigger is often supply-chain pressure from European and North American buyers rather than a fully mature domestic disclosure regime, which means software demand is likely to remain closely linked to global trade relationships and customer reporting expectations.

Competitive Landscape
The AI carbon footprint management software market was fragmented in 2025, with competition spread across large enterprise software providers and specialist carbon accounting vendors. The broad split in positioning was clear: companies such as SAP, Microsoft, IBM, Salesforce, and Workiva competed through ecosystem integration, while AI-native providers focused more on automation speed, Scope 3 workflows, and supplier data depth. SAP strengthened its position by bringing Green Ledger into the carbon accounting conversation, which lets enterprises reconcile carbon and financial records at the transaction level inside a familiar ERP environment. Microsoft continued to embed value-chain emissions workflows into existing business software, and IBM extended its reach by integrating standardized emissions calculations directly into Excel via Envizi. These moves matter because they lower switching friction for buyers who already operate inside large software ecosystems and want carbon reporting to fit existing governance structures.
AI-native challengers have responded by leaning harder into automation, supplier data infrastructure, and faster analysis workflows. Watershed's 2026 agentic AI launch focused on utility bill processing, hotspot identification, supplier engagement, and report drafting, which directly addressed manual bottlenecks in enterprise sustainability teams. Persefoni took a similar step with Analytics Agent, which enabled plain-language queries over emissions ledgers and produced auditable analysis for enterprise users. EcoVadis pursued a different route by expanding its Carbon Data Network through partnerships with Watershed, Carbmee, and Workiva, which turned supplier primary data into a network advantage rather than a point feature. In practical terms, the moat is shifting away from simple emissions-factor libraries toward the ability to ingest messy supplier data, preserve auditability, and shorten the path from raw inputs to reporting outputs.
Consolidation also became more visible as vendors tried to fill capability gaps more quickly. Makersite's acquisition of Siemens' SiGREEN platform in June 2026 linked verified supplier emissions data with product lifecycle intelligence, thereby strengthening product-level decarbonization and supply-chain carbon visibility in a single offering. Green Project Technologies made a similar move in July 2025 by acquiring the Emitwise technology platform and integrating its automated product carbon footprint and supplier engagement capabilities into Suite50. The remaining white space is concentrated in vertical needs such as financed emissions, food and agriculture emissions, and embodied carbon tracking, where many general platforms still need specialist data models or partner support. That leaves the AI carbon footprint management software market competitive, active, and still open to differentiation through workflow depth, reporting credibility, and sector-specific execution.
AI Carbon Footprint Management Software Industry Leaders
Watershed, Inc.
Persefoni AI, Inc.
Normative Group AB
Greenly SAS
Sweep SAS
- *Disclaimer: Major Players sorted in no particular order

Recent Industry Developments
- June 2026: Makersite acquired SiGREEN, Siemens' product carbon footprint and supply chain data exchange platform, effective June 1, 2026. The acquisition combines SiGREEN's verified real-world emissions data from supply chain companies with Makersite's product lifecycle intelligence capabilities, creating one of the first integrated platforms for product-level decarbonization built on primary supplier data across complex industrial value chains.
- June 2026: Sweep partnered with HowGood to integrate a database covering over 12 million food and agriculture product carbon footprints with Sweep's AI-powered platform. The collaboration enables food and agriculture companies to incorporate granular Scope 3 supply chain emissions into CSRD, ISSB, and GRI reports without manual data transfers between systems.
- May 2026: EcoVadis and Workiva announced a strategic partnership to connect EcoVadis's primary supplier carbon data from its 175,000+ company network with Workiva's AI-powered platform, enabling mutual customers to transition from industry-average Scope 3 estimates to granular, assurance-ready emissions reporting.
- May 2026: Persefoni launched Persefoni Analytics Agent, an agentic AI capability embedded within its platform that allows enterprise teams to query their CO₂e Activity Ledger using plain language and generate auditable, customized emissions analyses. The platform supports over 500 enterprise customers globally and has raised USD 179 million in institutional funding.


Global AI Carbon Footprint Management Software Market Report Scope
The AI Carbon Footprint Management Software market refers to platforms and services that leverage artificial intelligence to measure, monitor, analyze, and optimize carbon emissions across applications, IT infrastructure, and enterprise operations. These solutions integrate advanced AI-driven analytics to provide real-time visibility into carbon footprints, automate sustainability reporting, ensure compliance with ESG frameworks, and deliver predictive insights for carbon reduction strategies.
The AI Carbon Footprint Management Software market report is segmented by Component (Software, and Services), Deployment Mode (Cloud-Based, On-Premise, and Hybrid), Enterprise Size (Large Enterprises, and Small and Medium Enterprises), End-Use Industry (IT and Telecom, BFSI, Industrial Manufacturing, Energy and Utilities, Oil and Gas, Retail and E-Commerce, Food and Beverage Manufacturing, Construction and Infrastructure, Government and Public Sector, and Other End-User Industries), and Geography (North America, South America, Europe, Asia-Pacific, Middle East and Africa). The Market Forecasts are Provided in Terms of Value (USD).
| Software |
| Services |
| Cloud-Based |
| On-Premise |
| Hybrid |
| Large Enterprises |
| Small and Medium Enterprises |
| IT and Telecom |
| BFSI |
| Industrial Manufacturing |
| Energy and Utilities |
| Oil and Gas |
| Retail and E-Commerce |
| Food and Beverage Manufacturing |
| Construction and Infrastructure |
| Government and Public Sector |
| Other End-User Industries |
| North America | United States | |
| Canada | ||
| Mexico | ||
| South America | Brazil | |
| Argentina | ||
| Rest of South America | ||
| Europe | Germany | |
| United Kingdom | ||
| France | ||
| Italy | ||
| Spain | ||
| Russia | ||
| Rest of Europe | ||
| Asia-Pacific | China | |
| India | ||
| Japan | ||
| South Korea | ||
| Australia | ||
| Rest of Asia-Pacific | ||
| Middle East and Africa | Middle East | Saudi Arabia |
| United Arab Emirates | ||
| Turkey | ||
| Rest of Middle East | ||
| Africa | South Africa | |
| Egypt | ||
| Rest of Africa | ||
| By Component | Software | ||
| Services | |||
| By Deployment Mode | Cloud-Based | ||
| On-Premise | |||
| Hybrid | |||
| By Enterprise Size | Large Enterprises | ||
| Small and Medium Enterprises | |||
| By End-Use Industry | IT and Telecom | ||
| BFSI | |||
| Industrial Manufacturing | |||
| Energy and Utilities | |||
| Oil and Gas | |||
| Retail and E-Commerce | |||
| Food and Beverage Manufacturing | |||
| Construction and Infrastructure | |||
| Government and Public Sector | |||
| Other End-User Industries | |||
| By Geography | North America | United States | |
| Canada | |||
| Mexico | |||
| South America | Brazil | ||
| Argentina | |||
| Rest of South America | |||
| Europe | Germany | ||
| United Kingdom | |||
| France | |||
| Italy | |||
| Spain | |||
| Russia | |||
| Rest of Europe | |||
| Asia-Pacific | China | ||
| India | |||
| Japan | |||
| South Korea | |||
| Australia | |||
| Rest of Asia-Pacific | |||
| Middle East and Africa | Middle East | Saudi Arabia | |
| United Arab Emirates | |||
| Turkey | |||
| Rest of Middle East | |||
| Africa | South Africa | ||
| Egypt | |||
| Rest of Africa | |||


Key Questions Answered in the Report
What is the current and future size of the AI carbon footprint management software market?
The AI carbon footprint management software market was valued at USD 1.82 billion in 2025 and is projected to reach USD 5.56 billion by 2031, growing at a CAGR of 20.70% from 2026 to 2031.
Which component category leads revenue in carbon management software for AI-enabled reporting?
Software led the market with a 70.34% revenue share in 2025 because enterprises preferred scalable platforms that centralize emissions data, automate calculations, and support audit-ready reporting.
Which deployment model is growing fastest for AI carbon footprint management software?
Hybrid deployment is projected to grow fastest at a 22.08% CAGR through 2031, while cloud-based deployment remained the largest with a 67.12% revenue share in 2025.
Why are SMEs entering carbon management platforms faster than before?
SMEs are being pulled in by Scope 3 data requests from large enterprise buyers. That is why the SME cohort is projected to grow at a 21.92% CAGR through 2031.
Which end-use sector is creating the strongest demand today?
IT and Telecom led with 26.84% of revenue in 2025 because data center operators and digital infrastructure providers face heavy electricity-related reporting requirements across several disclosure regimes.
Which region offers the strongest growth opportunity over the forecast period?
Asia-Pacific is projected to expand at a 22.67% CAGR through 2031, supported by stronger disclosure pathways, rising science-based target adoption, and supply-chain reporting pressure across export ecosystems.
Page last updated on:


