
U.S. Supply Chain Management Software Market Size and Share
Market Overview
| Study Period | 2020 - 2031 |
|---|---|
| Forecast Data Period | 2026 - 2031 |
| Base Year Market Size (2025) | USD 7.15 Billion |
| Market Size (2026) | USD 7.63 Billion |
| Market Size (2031) | USD 10.53 Billion |
| Growth Rate (2026 - 2031) | 6.65 % |
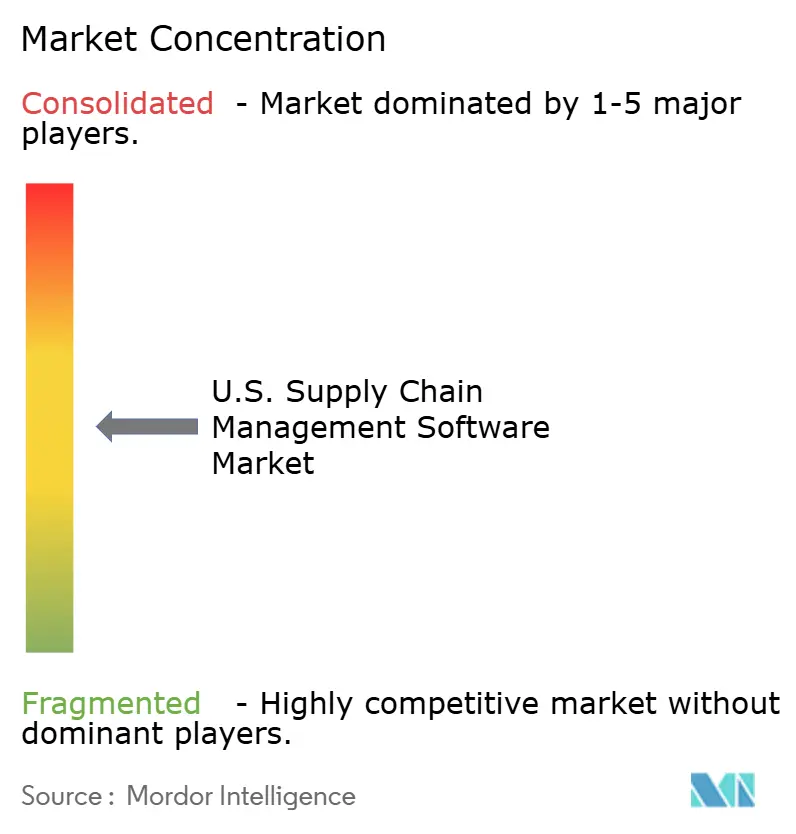
| Market Concentration | Medium |
Major Players *Disclaimer: Major Players sorted in no particular order Image © Mordor Intelligence. Reuse requires attribution under CC BY 4.0. | |
U.S. Supply Chain Management Software Market Analysis by Mordor Intelligence
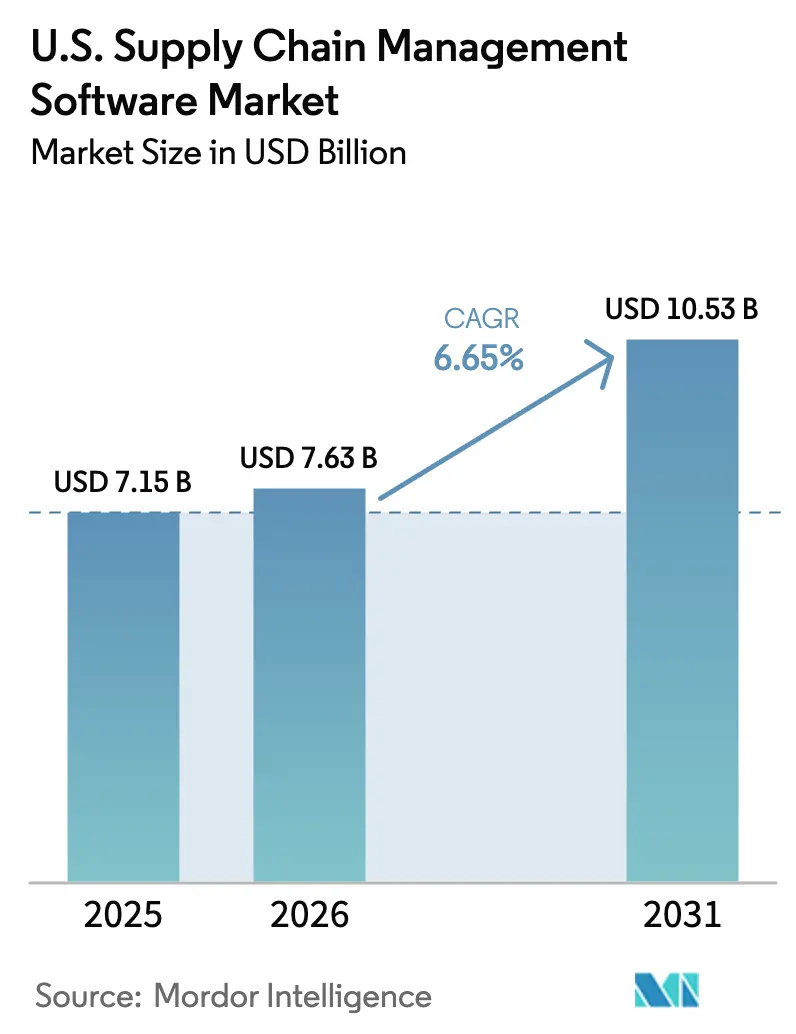
The U.S. supply chain management software market size was valued at USD 7.15 billion in 2025 and estimated to grow from USD 7.63 billion in 2026 to reach USD 10.53 billion by 2031, at a CAGR of 6.65% during the forecast period (2026-2031). Rapid cloud adoption, AI-infused planning suites, and new federal trade-compliance rules are reinforcing the momentum. E-commerce growth continues to push shippers toward real-time visibility tools, while rising generative-AI compute costs are accelerating hybrid deployment models that temper innovation with budget controls[1]IBM Institute for Business Value, “Balancing Cost and Performance in Hybrid AI Deployments,” ibm.com. The reshoring wave, strengthened by mounting public incentives for domestic manufacturing, is spurring investment in network-orchestration platforms that optimize shorter, regional supply bases. Intensifying M&A activity—exemplified by Blue Yonder’s USD 839 million purchase of One Network Enterprises—illustrates a premium on AI-native architectures that can address new regulatory traceability mandates. Collectively, these forces position the U.S. supply chain management software market for steady, innovation-led expansion.
Key Report Takeaways
- By solution type, Supply Chain Planning led with 31.12% of the U.S. supply chain management software market share in 2025; Supply Chain Analytics & AI is projected to grow at 7.05% CAGR through 2031.
- By deployment, on-premise models accounted for 64.10% of the market in 2025, while cloud deployments are forecast to expand at 8.15% CAGR.
- By organization size, large enterprises held 71.05% of the market in 2025; the SME segment is advancing at 7.85% CAGR as SaaS accessibility rises.
- By end user, manufacturing maintained 30.05% share in 2025, whereas retail & e-commerce is poised for a 6.78% CAGR through 2031.
Note: Market size and forecast figures in this report are generated using Mordor Intelligence’s proprietary estimation framework, updated with the latest available data and insights as of 2026.
Worldwide, activity is shaped by contributions from multiple countries and regions, with United states representing one among them. The global report on supply chain management software market by Mordor Intelligence reflects how these countries and regional layers combine into a single system.
U.S. Supply Chain Management Software Market Trends and Insights
Drivers Impact Analysis*
| Driver | (~) % Impact on CAGR Forecast | Geographic Relevance | Impact Timeline |
|---|---|---|---|
| E-commerce boom and cloud-first adoption | +1.8% | Global, with concentration in West and Northeast | Medium term (2-4 years) |
| AI-driven planning and analytics platforms | +1.2% | National, with early gains in Northeast, Midwest | Long term (≥ 4 years) |
| SME SaaS penetration surge | +0.9% | National, strongest in South and Midwest | Medium term (2-4 years) |
| Reshoring incentives boost domestic network orchestration | +0.7% | National, concentrated in Midwest manufacturing belt | Long term (≥ 4 years) |
| Forced-labor import bans elevate traceability solutions | +0.5% | National, with emphasis on West Coast ports | Short term (≤ 2 years) |
| Hybrid/on-prem AI cost-control architectures | +0.4% | Global, with enterprise concentration in Northeast | Medium term (2-4 years) |
| Source: Mordor Intelligence | |||
E-commerce boom and cloud-first adoption
Omnichannel sales spikes are forcing retailers and healthcare operators alike to demand elastic, cloud-native suites that can scale during peak cycles. Cloud solutions already represent 34% of the overall market and are rising swiftly as companies replace capital-heavy upgrades with consumption-based subscriptions. Hospital systems have mirrored the trend, with nearly half adopting cloud supply-chain tools to stabilize critical-item availability. The shift is strategic rather than purely technical, linking cost to actual throughput while reducing downtime tied to major version releases. As a result, the U.S. supply chain management software market is witnessing a surge in multitenant implementations that deliver rapid analytics, automatic patching, and disaster-recovery baked into service-level agreements. The dynamic continues to strengthen vendor lock-in barriers yet broadens the addressable base among firms formerly constrained by infrastructure limitations.
AI-driven planning and analytics platforms
Real-time AI copilots are shortening demand-planning cycles from days to minutes, with a quarter of logistics KPIs now forecast to be AI-generated by 2028. Kinaxis, for example, embedded its Maestro engine directly into core workflows, letting planners automate scenario modeling without toggling between modules. Such native integrations elevate supply-chain software from transactional record-keepers to predictive decision systems that flag disruptions before they materialize. Yet only one in six U.S. factories maintains live production visibility, underscoring ample whitespace for analytics rollouts[2]Zebra Technologies, “Manufacturing Vision Study,” zebra.com. Consequently, spending on AI accelerators is climbing even as firms experiment with cost-efficient edge inference to curb rising compute bills. These factors collectively lift the U.S. supply chain management software market toward higher-value, insight-centric use cases.
SME SaaS penetration surge
Affordable, subscription-based suites are granting mid-market manufacturers direct access to planning, execution, and analytics once limited to Fortune 500 budgets. Nine in ten industrial firms intend to add new digital tools in 2025, and seven in ten have increased software budgets to fund these deployments. Implementation hurdles persist—average ERP rollouts still overshoot timelines by 195 days and budgets by 34%—but vendors specializing in mid-market workflows are trimming time-to-value through templatized best practices. As a result, the U.S. supply chain management software market is expanding rather than cannibalizing large-enterprise demand, creating a two-tier growth engine that balances volume and value. To cement adoption, leading providers now bundle onboarding, managed services, and outcome-based pricing that resonate with lean IT teams.
Reshoring incentives boost domestic network orchestration
Federal semiconductor funding, Buy-American preferences, and state-level tax breaks are nudging manufacturers to relocate production. Ninety-three percent of surveyed plants plan to accelerate reshoring programs, prompting demand for software that can configure region-specific supplier nodes, optimize domestic freight, and ensure labor-practice compliance. IBM’s research notes that AI-driven scheduling and advanced workforce planning are critical for bridging skilled-labor shortages arising from new facility ramp-ups. Platforms that integrate factory-floor IoT streams with transportation analytics are therefore gaining prominence. Because domestic suppliers often operate on disparate systems, multi-enterprise collaboration layers and low-code connectors are now essential features. This reshoring momentum injects structural growth into the U.S. supply chain management software market, particularly across the Midwest manufacturing belt.
Restraints Impact Analysis*
| Restraint | (~) % Impact on CAGR Forecast | Geographic Relevance | Impact Timeline |
|---|---|---|---|
| Legacy ERP integration complexity | -1.1% | National, concentrated in manufacturing-heavy regions | Short term (≤ 2 years) |
| Skilled SCM-IT talent shortage | -0.8% | National, acute in Northeast and West Coast tech hubs | Long term (≥ 4 years) |
| GenAI compute cost–driven price inflation | -0.6% | Global, with enterprise concentration in Northeast and West | Medium term (2-4 years) |
| Data-sovereignty hurdles in regulated verticals | -0.4% | National, concentrated in healthcare and financial services sectors | Medium term (2-4 years) |
| Source: Mordor Intelligence | |||
Legacy ERP integration complexity
Fewer than 60% of manufacturers are on track to shift aging SAP landscapes to modern S/4HANA stacks before mainstream support deadlines, leaving hundreds of custom interfaces in place. Integration projects demand data cleansing, process redesign, and new cybersecurity layers; attacks on legacy SAP systems surged fourfold between 2021 and 2023 as criminals exploited unpatched modules. Extended timelines inflate project budgets just as CFOs push digital investments to show near-term returns. To contain risk, many firms are piloting API-first microservices that wrap legacy cores while letting new cloud analytics run in parallel. Although this tactic speeds up visible wins, the underlying debt continues to slow broader migration, capping potential growth in the U.S. supply chain management software market.
Skilled SCM-IT talent shortage
An insufficient pipeline of supply-chain data scientists and control-tower architects is stretching deployment calendars and raising consulting fees. Semiconductor fabs, critical to national policy goals, flag labor deficiencies as a top threat despite USD 52 billion in federal funding. Zebra’s manufacturing survey shows 73% of plant leaders prioritizing workforce upskilling to harness new analytics investments. Vendors are responding by offering managed-service models and pre-configured AI agents that reduce customer staffing needs, yet this relief comes at the expense of higher subscription commitments. Over the long term, continuous education partnerships with universities aim to replenish the talent pool, but shortages will likely temper adoption velocity in the U.S. supply chain management software market through the decade.
*Our forecasts treat driver/restraint impacts as directional, not additive. The impact forecasts reflect baseline growth, mix effects, and variable interactions.
Segment Analysis
By Solution Type: Planning Dominance Meets AI Acceleration
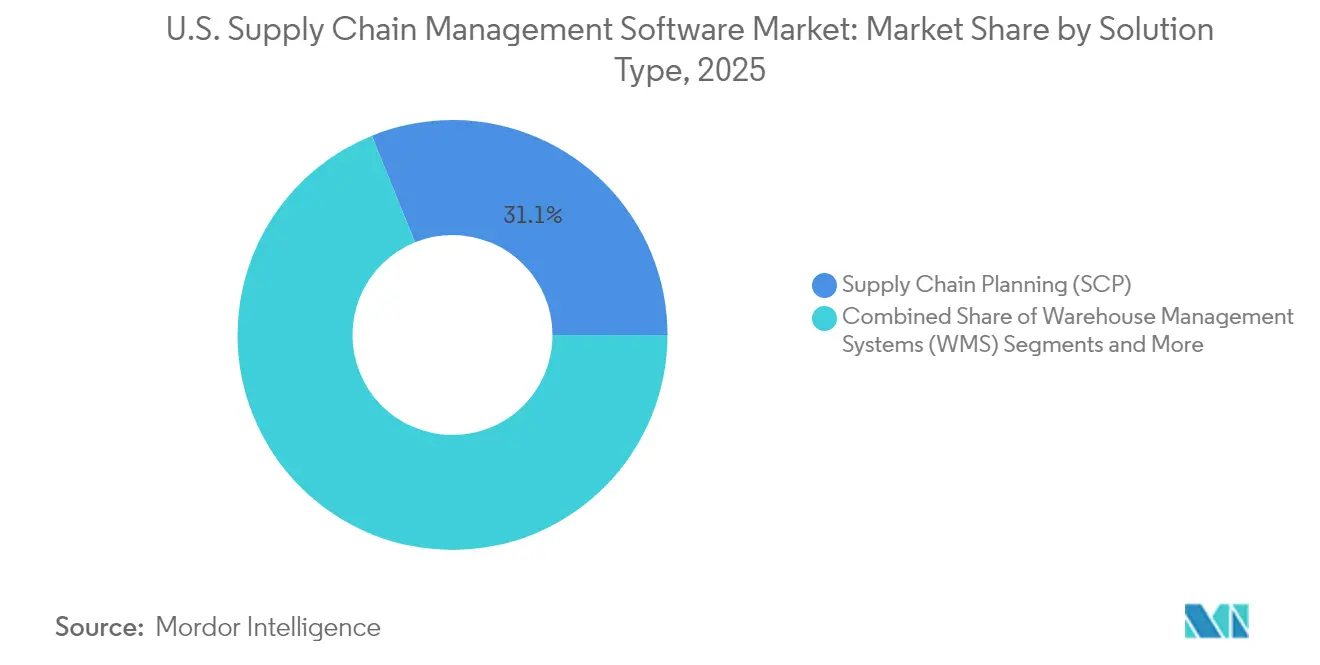
Supply Chain Planning remained the revenue cornerstone, accounting for 31.12% of the U.S. supply chain management software market in 2025. Demand-sensing modules and inventory-optimization engines continue to draw upgrades as firms seek resilience against volatile order patterns. In parallel, the Supply Chain Analytics and AI segment is expanding at a 7.05% CAGR, underscoring a pivot toward prescriptive insights that complement existing planning backbones. Warehouse Management Systems and Transportation Management Systems attract steady spend because they offer immediate throughput improvements; North American WMS suppliers capture more than half of worldwide revenue, reflecting deep domain expertise. Procurement and Sourcing tools are regaining attention as traceability and ESG requirements intensify. Risk-and-Compliance point solutions, though smaller in ticket size, are outpacing historical averages by monetizing forced-labor screening functions mandated by U.S. Customs. Coupa’s billion-dollar annual billings validate the appetite for integrated platforms uniting spend, sourcing, and supplier risk management.
Increasingly, customers favor suites that embed AI copilots rather than bolt-on analytics, a trend evident from Kinaxis’s Maestro launch. This shift streamlines user experience and limits data-integration friction, positioning analytics as a natural extension of planning. As a result, the U.S. supply chain management software market size for analytics-infused suites is projected to swell at a rate that outpaces core transactional modules through 2031. For vendors, cross-selling synergies are improving lifetime contract values: planning clients adopting embedded analytics raise annual subscriptions by roughly 22% on average. Meanwhile, best-of-breed visibility platforms are integrating with planning engines to secure footholds before full-suite vendors close the gap, suggesting a window for specialized innovation.



By Deployment: On-Premise Resilience Amid Cloud Surge
On-premise systems still commanded 64.10% revenue in 2025, reflecting entrenched data-sovereignty policies among defense, healthcare, and critical-infrastructure operators. High-availability clusters and custom security ciphers make lift-and-shift migration costly, so many large organizations continue to budget for evergreen maintenance. Yet cloud subscriptions are racing ahead at an 8.15% CAGR as mid-market adopters and digitally mature enterprises move routine workloads offsite for scale and lower capex. Manhattan Associates’ cloud revenue climbed to USD 86.5 million in Q3 2024, illustrating how legacy vendors can pivot their base to SaaS without sacrificing license margins.
Hybrid patterns now dominate RFPs: sensitive master data resides on premises while AI-heavy analytics and collaboration tools run in the cloud. Transportation Management and Global Trade modules exhibit the fastest cloud uptake because they benefit from network effects across carriers and brokers. The U.S. supply chain management software market is therefore bifurcating into workload-optimized topologies rather than single-stack deployments. Vendors offering unified orchestration layers that span cloud and edge environments are capturing premium pricing, and customers report 19% lower total cost of ownership when they switch to such federated models. Over time, usage-based billing is expected to nudge budgeting practices toward operating-expense frameworks that better align with fluctuating freight volumes.
By Organization Size: Enterprise Foundation Enables SME Expansion
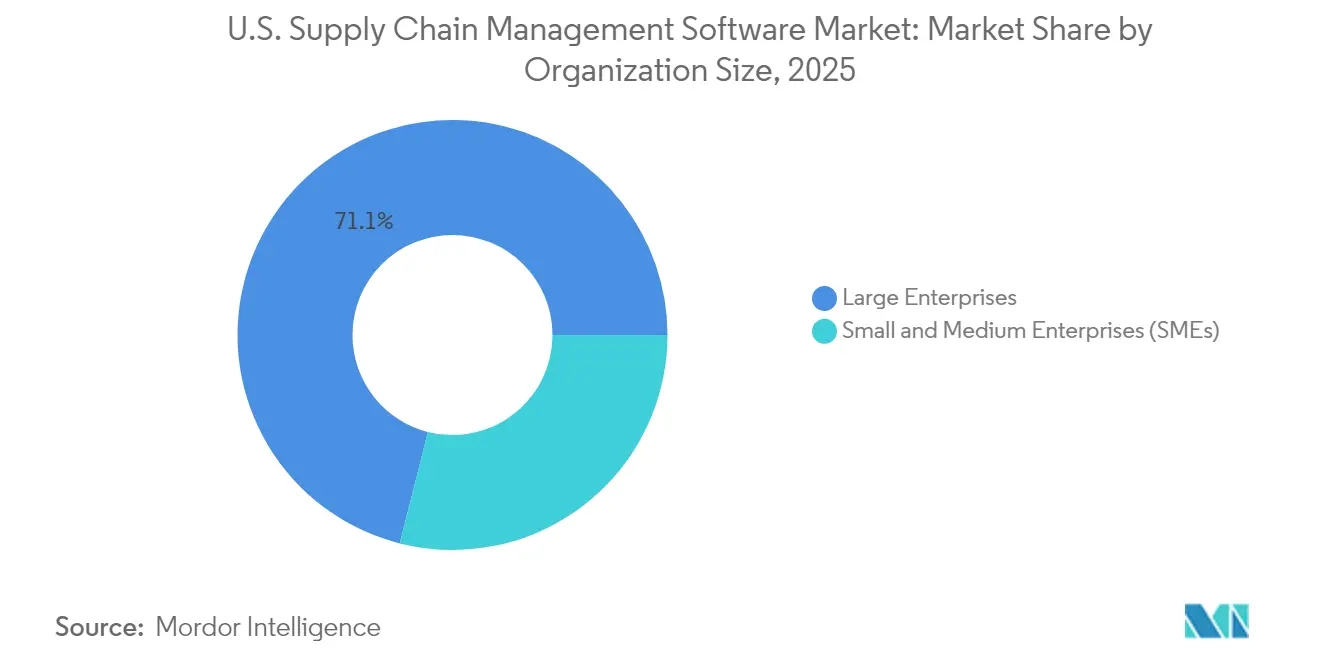
Large enterprises retained a commanding 71.05% share of the U.S. supply chain management software market in 2025. Their global multi-site footprints, stringent audit obligations, and integration needs favor comprehensive suites backed by multi-year service agreements. These accounts deliver substantial recurring revenue and fund the R&D pipelines of incumbent vendors. Nevertheless, the SME cohort is expanding at 7.85% CAGR, propelled by cloud economies of scale and simplified onboarding collected in modular bundles. SaaS vendors now embed self-service setup wizards that let mid-sized factories launch inbound-planning modules in weeks, not months.
The cost barrier is falling as subscription plans distribute expenditure over longer horizons, replacing six-figure implementation checks with monthly per-user fees. In parallel, larger corporations are adopting micro-service agility traditionally associated with SMEs: pilots run in discrete business units before scaling to enterprise rollouts. This cross-pollination blurs categorical boundaries, but it solidifies the premise that the U.S. supply chain management software market will grow through additive demand rather than share redistribution. The primary challenge for vendors is balancing feature depth with ease of consumption, particularly when servicing clients with minimal in-house IT support.
By End User: Manufacturing Leadership Faces Retail Disruption
Manufacturing generated 30.05% of 2025 revenue, underpinned by complex production planning, quality control, and compliance imperatives. Automakers upgrading to electric-vehicle platforms and pharmaceutical plants adopting serialization workflows require fine-grained orchestration that legacy MRP could not deliver. In contrast, retail and e-commerce is forecast to post a 6.78% CAGR, spurred by next-day delivery expectations and real-time inventory commitments across physical and digital channels. Healthcare providers meanwhile accelerated cloud adoption to stabilize critical-item stock, showcasing diversification in use cases.
Sustainability reporting has emerged as a unifying theme: CPG brands, oil-and-gas operators, and grocers alike need carbon-footprint dashboards to satisfy regulators and investors. This cross-vertical commonality is encouraging platform convergence in the U.S. supply chain management software market, where modular frameworks can serve both discrete manufacturing and high-velocity retail scenarios. Vendors that layer emissions tracking or labor-compliance screening onto core logistics execution are widening their total addressable market without venturing far from core competencies.
Geography Analysis
The Northeast captured 36.20% of the U.S. supply chain management software market in 2025, buoyed by dense clusters of pharmaceutical, financial-services, and technology headquarters. Regulatory complexity around FDA serialization and New York financial reporting drives preference for solutions with built-in audit trails and continuous controls monitoring. Contract values trend higher and procurement cycles run longer, but customer loyalty often extends past decade-long life spans once fit-for-purpose compliance capabilities are proven. Partnerships such as TraceLink and Tecsys illustrate demand for niche track-and-trace add-ons that synchronize with hospital and life-science workflows.
The Midwest is the growth engine, projected to expand 7.35% annually through 2031 as re-industrialization picks up pace. States like Ohio and Michigan are modernizing plant networks with machine-vision inspection and IIoT data hubs, which feed advanced planning algorithms. Supply Chain Management Review reports that 97% of Midwestern factories have already piloted at least one digital technology, underscoring readiness for layered orchestration rollouts. Infrastructure legislation and the CHIPS Act funnel capital into semiconductor, EV, and battery manufacturing corridors, necessitating regional supplier mapping, domestic logistics optimization, and workforce-management modules.
The South and West round out national demand with distinct priorities. Gulf-state energy complexes emphasize asset-intensive maintenance planning and hazard tracking as petrochemical and renewables investments accelerate. Distribution hubs near Atlanta and Dallas rely heavily on warehouse-automation suites to manage national retail flows. The West, anchored by California’s technology cluster and port throughput, leans toward AI-powered visibility dashboards and sustainability analytics to meet stringent emissions mandates. These regional nuances confirm that the U.S. supply chain management software market requires configurable platforms that can address location-specific compliance and industry mixes from the outset.
Regulatory Landscape
The regulatory environment shaping U.S. supply chain management software demand is being pulled by trade enforcement, traceability timelines, and formalized cyber supply chain risk management guidance. In January 2026, U.S. Customs and Border Protection (CBP) implemented 25% ad valorem duties on certain semiconductors and derivative products, increasing the compliance burden around product classification, documentation, and import workflows that are commonly managed through global trade, procurement, and supplier data modules.
Policy actions in 2026 also raised the operational stakes for importer and supplier compliance programs. A June 3, 2026 executive order directed heightened import disclosure requirements and a higher penalty floor for noncompliance, reinforcing the need for auditable supplier records and automated screening. On the cyber side, NIST published SP 800-18 Rev. 2 on June 30, 2026 and finalized SP 1326 on July 8, 2026, adding clearer expectations for security, privacy, and cybersecurity supply chain risk management (C-SCRM) planning and due diligence that influence vendor qualification and federal-adjacent procurement requirements. Congress enacted an enforcement pause for FDA FSMA 204 (Food Traceability Rule) until July 20, 2028, keeping traceability investments active while shifting near-term emphasis toward readiness programs, data foundations, and interoperable partner connectivity rather than enforcement-driven deadlines.
Value Chain Analysis
The value chain for U.S. supply chain management software starts with hyperscalers and infrastructure providers (cloud, data platforms, and AI compute), application vendors (planning, WMS, TMS, procurement, risk and compliance, and multi-enterprise networks), and a services layer that includes system integrators, managed services providers, and specialized consultants for ERP integration, data engineering, and change management. Major application ecosystems in scope include SAP, Oracle, Blue Yonder, Infor, Coupa Software, Manhattan Associates, E2open, Descartes Systems Group, and Kinaxis, alongside network and visibility platforms such as FourKites, TraceLink (OPUS), and C.H. Robinson (Navisphere), which connect shippers, carriers, suppliers, and contract manufacturers.
Downstream value creation depends on reliable master data, partner connectivity, and operational governance to turn visibility into actions. Organizations commonly run multiple systems for decision-making, which drives demand for orchestration layers, standardized APIs/connectors, and data harmonization. Bottlenecks cited in 2025 center on data quality constraints that limit AI utility, heavy reliance on legacy systems that slow deployment and integration, and inconsistent SOPs for responding to real-time alerts, increasing reliance on vendor templates and managed operations. Security and procurement requirements are also moving closer to operational gatekeeping: 2026 guidance work around AI software bills of materials (SBOMs) and NIST C-SCRM publications (including SP 1326) elevates software supply chain transparency and supplier assessment as part of enterprise and public-sector buying workflows.
Competitive Landscape
Consolidation is reshaping the U.S. supply chain management software industry as incumbents augment AI portfolios and fill solution gaps through M&A. Blue Yonder’s USD 839 million purchase of One Network Enterprises created a multi-enterprise collaboration network spanning 150,000 trade partners. Vista Equity’s Jaggaer acquisition and Aptean’s bid for Logility signal investor confidence that integrated suites will command premium valuations when they incorporate native analytics and sustainability modules. While these moves lift barriers for new entrants, they also leave space for focused disruptors to capture niches unloved by broad-suite roadmaps.
Technology differentiation outweighs functional parity in current RFPs. Vendors such as Manhattan Associates have preserved a 20% share in warehouse management by migrating legacy customers to a cloud-first codebase while layering computer-vision picking and gamified labor-management functions. Start-ups like Pelico, fresh off a USD 40 million funding round, target factory-floor orchestration that promises 40% fewer parts shortages. Compliance-first specialists are likewise thriving: forced-labor regulations blocked USD 3.17 billion of shipments in 2024, and platforms that automate supplier documentation checks are seeing double-digit pipeline growth[3]Descartes Systems Group, “U.S. CBP Forced-Labor Detentions Update,” descartes.com . The resulting competitive matrix shows legacy scale on one axis and specialized depth on the other, with hybrid AI architectures serving as the principal battleground.
Pricing models continue to evolve. Perpetual licenses are giving way to usage-tiered subscriptions that bundle data-lake access, real-time alerting, and continuous model retraining. Customers increasingly benchmark total time-to-value rather than module-level features, rewarding vendors with low-code extensibility and curated marketplace ecosystems. Consequently, the U.S. supply chain management software market is expected to witness additional bolt-on acquisitions aimed at rounding out industry-specific workflows, especially in life sciences, aerospace, and food safety. The net effect is a moderate-to-high concentration environment where the top five vendors collectively hold an estimated 55% revenue share, but specialized challengers retain viable entry points.
U.S. Supply Chain Management Software Industry Leaders
Oracle Corporation
Infor Inc.
SAP SE
Blue Yonder
Coupa Software
- *Disclaimer: Major Players sorted in no particular order

Market Opportunities and Future Outlook
Near-term opportunity is concentrated in compliance-grade, audit-ready workflows that reduce manual effort across trade, supplier, and traceability processes while fitting hybrid deployments. The combination of a tighter CBP compliance posture in 2026 and tariff administration complexity for certain product categories increases demand for integrated global trade management, supplier documentation, and exception handling embedded within SCM suites, particularly for import-intensive manufacturers and retailers. The enforcement pause for FDA FSMA 204 until July 20, 2028 also creates room for vendors and buyers to focus on foundational data models, partner onboarding, and interoperable traceability networks that can be extended across food, CPG, and broader regulated supply chains.
A second opportunity track centers on domestic manufacturing scale-up programs that require multi-site planning, supplier mapping, and production-to-logistics synchronization. Public-sector industrial supply chain initiatives have continued to highlight semiconductors and critical supply chains, and in July 2026 the Trump Administration announced an additional USD 100 billion investment from TSMC for U.S.-based advanced semiconductor manufacturing (bringing total planned investment to USD 265 billion across 12 facilities). Large, multi-facility build-outs of this kind expand the addressable need for planning, inventory, and execution software that spans new plants, regional supplier ecosystems, and logistics nodes. On the operating-model side, the move toward centralized Global Business Services (GBS) cited by KPMG in 2026 supports demand for standardization, cross-business governance, and end-to-end control towers, while PwC’s 2026 Digital Trends in Operations Survey finding that 89% of operations and supply chain leaders report tech investments not yet fully delivering results keeps attention on implementations that emphasize adoption, data readiness, and measurable operational KPIs rather than additional point-solution layering.
Recent Industry Developments
- June 2026: Oracle announced four new Fusion Agentic Applications for Oracle Fusion Cloud SCM focused on inventory visibility and manufacturing efficiency, alongside new inventory optimization capabilities. The release deepens Oracle’s push from analytics to execution-oriented automation inside core SCM workflows, raising competitive pressure on suite vendors to embed agent-based orchestration rather than offer add-on copilots.
- October 2025: Oracle announced new AI agents within Oracle Fusion Cloud Applications aimed at improving supply chain performance. By productizing AI agents across key SCM processes, Oracle reinforced the shift toward native AI functionality bundled into subscription suites, influencing evaluation criteria in enterprise RFPs.
- July 2024: Infor completed the acquisitions of Albanero and Acumen, strengthening revenue growth management and data migration capabilities. These additions supported broader platform modernization and implementation acceleration, capabilities that often determine time-to-value for multi-module SCM deployments.


Research Methodology Framework and Report Scope
Market Definition and Coverage
For this methodology, the market covers revenue earned in the United States from supply chain management software used to plan, execute, and monitor supply chain activities across functions like procurement, manufacturing planning, inventory, and logistics coordination.
Scope exclusions: We exclude pure third-party logistics services, physical automation hardware, and general ERP revenue that is not attributable to supply chain management software use cases.
Segmentation Overview
- By Solution Type
- Supply Chain Planning (SCP)
- Procurement and Sourcing
- Warehouse Management Systems (WMS)
- Transportation Management Systems (TMS)
- Supply Chain Analytics and AI
- Risk and Compliance Management
- By Deployment
- On-Premise
- Cloud
- By Organization Size
- Large Enterprises
- Small and Medium Enterprises (SMEs)
- By End User
- Manufacturing
- Healthcare and Life Sciences
- Retail and E-commerce
- FMCG and CPG
- Oil and Gas / Energy
- Other Industries
Data Sources, Market Sizing, and Validation
Desk Research
Desk research was used to set the market frame, build a clean list of addressable software categories, and anchor the model to public demand signals in the US. We referenced public sources such as the US Census Bureau, Bureau of Labor Statistics, Federal Reserve Economic Data (FRED), the Bureau of Transportation Statistics, and the US International Trade Commission for baseline indicators that track inventory cycles, freight activity, and industrial output.
To translate those signals into software demand, we also used company filings and earnings call commentary, investor presentations, and trusted trade press coverage for adoption themes and pricing direction. For cross-checking vendor presence and solution positioning, we used a paid subscription focused on company financials and intelligence, and a separate paid patent database to sanity-check where product investment is clustering. The specific desk sources listed above are illustrative, and many other public and proprietary references were also used for data collection, validation, and clarification during analysis.
Primary Interviews and Surveys
Primary work focused on validating what is actually being bought in the US and how deals are priced and renewed across industries with complex supply chains. We spoke with a mix of software providers, implementation partners, and end users to confirm deployment patterns, module bundling, and the split between new wins and expansion in existing accounts. Feedback was also used to pressure-test assumptions around upgrade cycles, cloud migration timing, and the pace of AI feature monetization.
Distribution of primary research fieldwork respondents
| Company type | Respondent position |
|---|---|
| Top tier: 29% | CXOs: 21% |
| Mid tier: 50% | Functional/Unit leaders: 33% |
| Smaller Players: 21% | Managers: 46% |
Market-Sizing & Forecasting
Sizing started with a top-down build that ties US supply chain software spend to the addressable enterprise software budget pool, which is then filtered by SCM adoption rates and typical suite versus point-solution mix across target industries. Once that total was formed, we corroborated it with selective bottom-up checks using sampled vendor revenues where public disclosures were available, channel partner inputs on implementation intensity, and a simple ASP times volume check for common modules.
A few market-specific inputs were kept visible in the model so the math stays explainable, including cloud deployment share (since subscription recognition changes timing), average contract term and renewal behavior, implementation and integration effort as a driver of total deal value, adoption of planning versus execution modules, and industry activity indicators such as inventory-to-sales trends and freight movement. Where vendor financial detail was not separable, revenue was allocated using product mix cues from filings and validated through interviews, and then adjusted conservatively when responses varied.
For forecasting, scenario analysis was used because adoption speed and pricing are moving at different rates across industries. The base case was guided by primary feedback on budget cycles and replacement timing, then stress-tested with slower and faster cloud migration paths and different assumptions on price uplift from analytics and AI add-ons.
Data Validation & Update Cycle
Totals were checked against independent signals, such as shifts in enterprise IT spending intent, reported backlog and renewal commentary from public companies, and macro indicators that typically change SCM urgency in the US. Outliers by year were flagged and reviewed, and we revisited assumptions when the model implied pricing or penetration levels that interviewees said were unrealistic.
Before sign-off, the model and write-up went through multi-step analyst reviews so calculation logic, units, and currency handling stayed consistent across the time series. The report is refreshed annually, with interim updates when a material event changes assumptions, and a final pre-delivery review is completed so clients receive the latest updated view.
Mordor Intelligence's US Supply Chain Management Software Market Size Versus Other Published Estimates
It is normal to see different published numbers for this market because the line between software, services, and broader supply chain spending is not drawn the same way by every publisher. Timing choices also matter, since subscription revenue recognition, multi-year contracts, and currency treatment can shift the stated market value for a given year.
In practice, the biggest gaps usually come from scope choices, especially whether implementation services, embedded hardware in supply chain solutions, or non-SCM ERP modules are counted inside the total. Different update cadences can also introduce drift, since fast changes in cloud share and pricing for analytics features need to be refreshed often to avoid carrying forward older assumptions. In this comparison, software-only US revenue is isolated and rechecked against renewal and deployment signals in the model applied by Mordor Intelligence.
Benchmark comparison
| Source | Market Size | Gaps in Research Methodology |
|---|---|---|
| Mordor Intelligence | USD 7.15 B (2025) | |
| Investment Advisory A | USD 12.50 B (2024) | Uses a broader US SCM software bucket that appears to include adjacent enterprise application spend and larger-suite allocations, and the stated 2024 starting point can also reflect earlier cloud revenue recognition assumptions. |
| Trade Publication B | USD 9.88 B (2024) | Covers North America and blends solution spend with services and embedded hardware, which inflates totals versus a software-only US view, and the base-year framing can differ from software revenue accounting. |
Taken together, the spread is mainly explained by what gets bundled into the definition and whether the geography is strictly US or expanded to North America, followed by differences in how subscription revenue timing is handled. Our approach keeps the total traceable to clear software demand drivers, and then it is cross-checked with deal, renewal, and deployment inputs so the number remains repeatable and easy to audit.


Key Questions Answered in the Report
What is the current value of the U.S. supply chain management software market?
The market is valued at USD 7.63 billion in 2026.
How fast is the market expected to grow through 2031?
It is projected to expand at a 6.65% CAGR, reaching USD 10.53 billion by the end of the forecast period (2026-2031).
Which solution segment leads the market today?
Supply Chain Planning holds the largest position with 31.12% of 2025 revenue.
Which U.S. region is showing the fastest growth?
The Midwest is forecast to record a 7.35% CAGR through 2031 as manufacturing reshoring accelerates.
What deployment model is growing quickest?
Cloud deployments are rising at an 8.15% CAGR thanks to lower upfront cost and elastic scaling features.
How are small and medium enterprises impacting market dynamics?
SMEs are the fastest-growing customer group at an 7.85% CAGR, leveraging SaaS bundles that compress implementation time and reduce capital expense.
Page last updated on:


 Your data is secure and never sold or shared.


