
South Africa Renewable Gas Waste Feedstock Management Market Size and Share
Market Overview
| Study Period | 2020 - 2031 |
|---|---|
| Forecast Data Period | 2026 - 2031 |
| Base Year Market Size (2025) | USD 0.19 Billion |
| Market Size (2026) | USD 0.2 Billion |
| Market Size (2031) | USD 0.3 Billion |
| Growth Rate (2026 - 2031) | 8.45 % |
| Market Concentration | Low |
Major Players *Disclaimer: Major Players sorted in no particular order Image © Mordor Intelligence. Reuse requires attribution under CC BY 4.0. | |
South Africa Renewable Gas Waste Feedstock Management Market Analysis by Mordor Intelligence
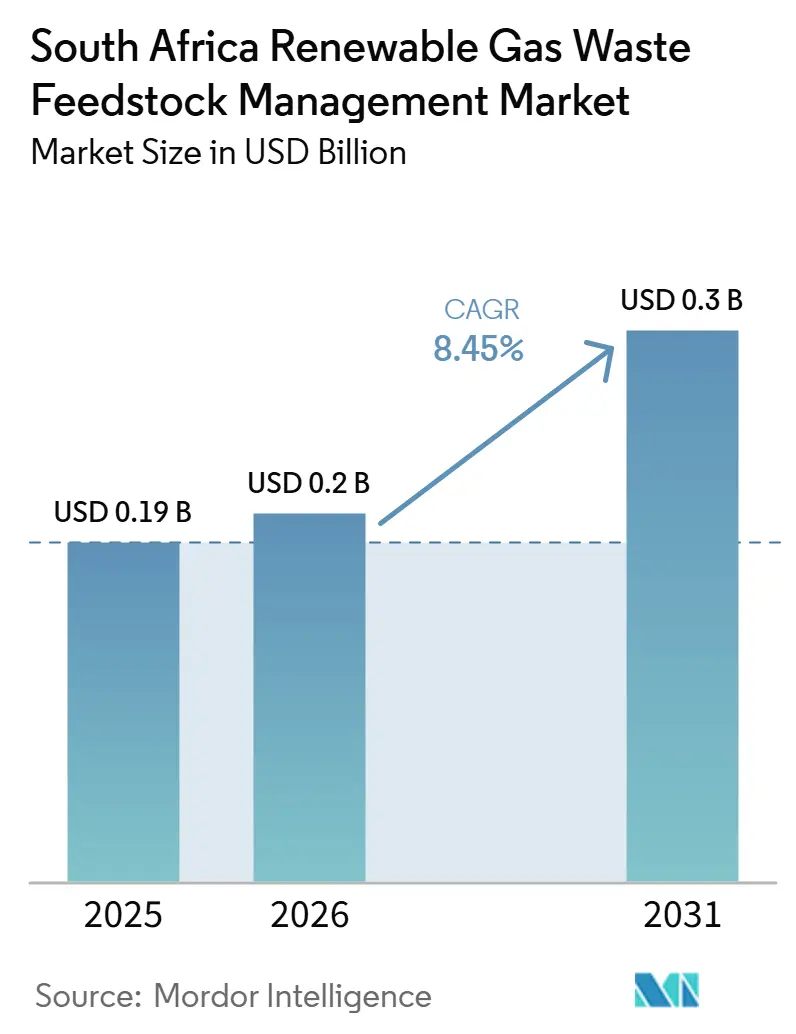
The South Africa Renewable Gas Waste Feedstock Management Market size was valued at USD 0.19 billion in 2025 and is estimated to grow from USD 0.2 billion in 2026 to reach USD 0.3 billion by 2031, at a CAGR of 8.45% during the forecast period (2026-2031).
South Africa generated 122 million tons of waste annually, including more than 19.25 million tons of organic waste, while only 10% of total waste was diverted from landfill in 2024. This gap leaves a substantial volume of recoverable material outside formal renewable gas supply chains, particularly when collection reaches disposal sites before separation. Higher disposal costs, municipal waste volumes, and energy security needs support investment in collection, conditioning, and processing services, as conversion facilities cannot operate reliably without organized upstream handling. The carbon tax is USD 18.5 per ton of CO₂ equivalent in 2026, which strengthens the financial case for diverting organic material from landfill. The South Africa renewable gas waste feedstock management market is also shifting from logistics-centered services toward monitoring, traceability, and tighter control of feedstock quality, as operators seek more predictable plant intake and gas output.
Key Report Takeaways
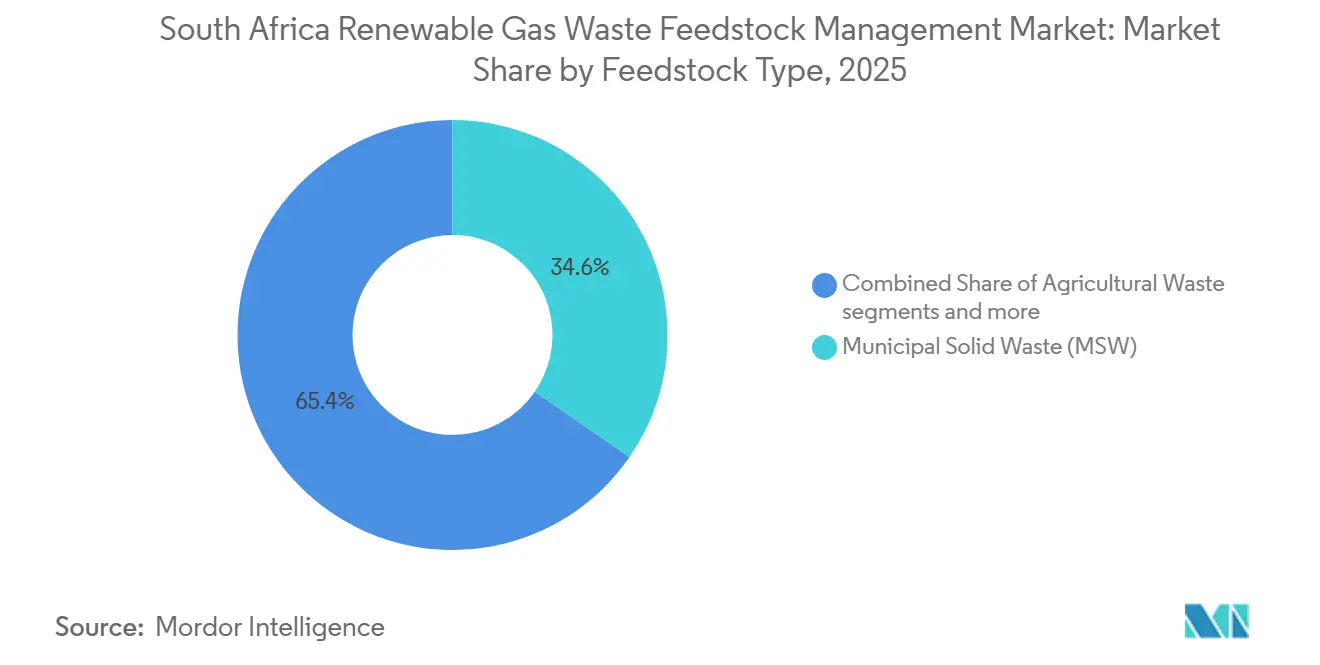
- By feedstock type, municipal solid waste held 34.6% of the South Africa renewable gas waste feedstock management market share in 2025, while food and beverage processing waste is projected to grow at a 9.5% CAGR through 2031.
- By end-use facility type, landfill gas recovery sites accounted for 38.4% of the South Africa renewable gas waste feedstock management market size in 2025, while gasification and thermal treatment facilities are forecast to expand at a 9.8% CAGR through 2031.
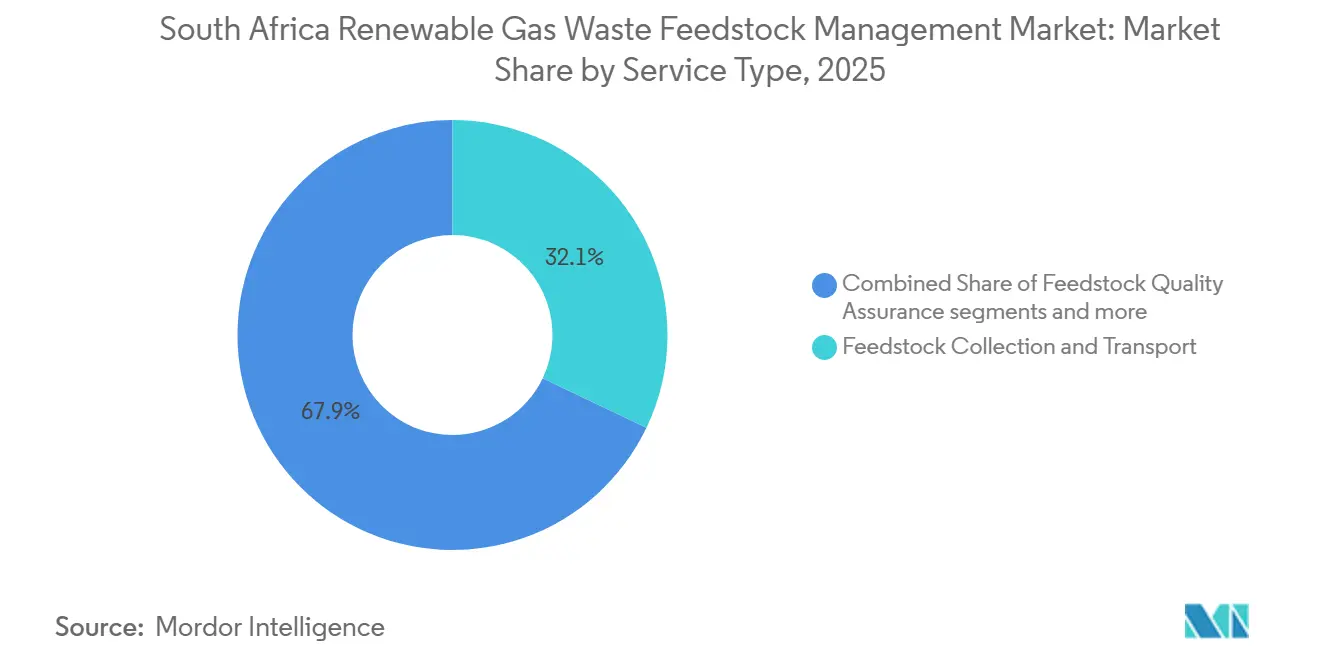
- By service type, feedstock collection and transport held 32.1% of revenue in 2025, while digital feedstock monitoring platforms are forecast to grow at a 12.4% CAGR through 2031.
Note: Market size and forecast figures in this report are generated using Mordor Intelligence’s proprietary estimation framework, updated with the latest available data and insights as of January 2026.
South Africa Renewable Gas Waste Feedstock Management Market Trends and Insights
Drivers Impact Analysis*
| Driver | (~) % Impact on CAGR Forecast | Geographic Relevance | Impact Timeline |
|---|---|---|---|
| Rising Municipal Solid Waste Generation Driving Organic Feedstock Recovery | +2.0% | National, with core gains in Gauteng, Western Cape, and eThekwini | Short term (≤ 2 years) |
| Electricity Supply Constraints Accelerating Renewable Gas Adoption | +1.5% | National, with high urgency in industrial corridors | Short term (≤ 2 years) |
| National Circular Economy Initiatives Promoting Organic Waste Valorization | +1.2% | National, with regulatory leadership in Western Cape | Medium term (2-4 years) |
| Livestock and Agro-Processing Industries Expanding Agricultural Feedstock Availability | +0.9% | KwaZulu-Natal, Western Cape, and Eastern Cape | Medium term (2-4 years) |
| Wastewater Treatment Upgrades Increasing Biosolids Feedstock Utilization | +0.6% | Gauteng, Western Cape, and eThekwini | Medium term (2-4 years) |
| Landfill Diversion Strategies Strengthening Organic Waste Collection | +0.4% | National, with early gains in Cape Town and Johannesburg | Short term (≤ 2 years) |
| Source: Mordor Intelligence | |||
Rising Municipal Solid Waste Generation and Landfill Diversion
South Africa generated 12.7 million tons of municipal waste each year, while 3.67 million tons remained uncollected.[1] Organic waste was the largest general waste category, at 19.25 million tons per year, and 50.8% was sent to landfill. The South Africa renewable gas waste feedstock management market can capture more material as collection networks become more formal, especially when municipalities and private providers establish clear responsibilities for sorting and delivery. Waste volumes and limited landfill diversion continue to increase the need for aggregation, sorting, and pre-treatment before disposal. Cape Town and Johannesburg provide early examples of landfill diversion measures that can support formal organic waste contracts, which can give generators and processors clearer expectations on volumes, quality, and timing.
Electricity Supply Constraints Accelerating Renewable Gas Adoption
The electricity supply system has exposed a persistent risk for commercial and industrial users.[2] Supply conditions improved during 2024 as private embedded generation expanded, but structural grid risks remained.[3] Biogas and landfill gas can provide a controllable output for facilities that cannot accept production interruptions. This differs from intermittent renewable generation that depends on weather conditions. As more industries invest in dispatchable renewable energy, demand for reliable organic waste collection, feedstock pre-treatment, and long-term supply agreements is expected to increase, supporting the expansion of the renewable gas waste feedstock management value chain. The Integrated Resource Plan 2025 provides for 22.9 GW of utility-scale renewable procurement through 2030. That policy setting gives the South Africa renewable gas waste feedstock management market a role alongside wider renewable capacity additions, particularly where users need energy that can be scheduled around operating requirements.
National Circular Economy Initiatives Promoting Organic Waste Valorization
The National Waste Management Strategy 2026 identified organic waste as a national priority stream. It included anaerobic digestion, pyrolysis, and gasification in the waste management hierarchy. The strategy set a target of producing 10% of biogas from organic waste annually by 2030. Municipalities are required to include organic waste technologies in their Integrated Waste Management Plans. These policy measures are expected to increase the volume of segregated organic waste available for renewable gas projects, creating sustained demand for feedstock collection, aggregation, and pre-treatment services. These measures support longer-term feedstock contracts that were previously harder for operators to secure, and they give project developers a clearer basis for planning collection and processing capacity. Cabinet approval of the Food Waste Strategy in November 2024 also established government responsibility for food waste across the supply chain.
Livestock and Agro-Processing Industries Expanding Agricultural Feedstock Availability
UNIDO assessments attributed 2,500 MW of South Africa's biogas potential to the agricultural sector. Agricultural residues, livestock waste, and food-processing material create a broad potential feedstock base. The commercial opportunity remains tied to aggregation, collection, and transport across dispersed sources. This leaves a clear need for service providers that can combine smaller volumes into reliable deliveries, while keeping material streams separate enough to meet facility intake requirements. As investment in farm-scale and agro-industrial biogas projects increases, efficient feedstock logistics and quality management will become critical to maintaining stable plant operations and biomethane yields. Food waste across provincial value chains can be converted into bio-CNG, although this resource remains largely untapped. Wastewater upgrades can add another supply route, as treatment works already digest sludge, though most historically flared the resulting biogas.
Restraints Impact Analysis*
| Restraint | (~) % Impact on CAGR Forecast | Geographic Relevance | Impact Timeline |
|---|---|---|---|
| Limited Source Separation Reducing Organic Feedstock Quality | -1.5% | National, most severe outside metropolitan areas | Long term (≥ 4 years) |
| Inadequate Organic Waste Collection Infrastructure Outside Major Cities | -1.2% | Peri-urban and rural areas, including provincial towns | Long term (≥ 4 years) |
| High Feedstock Transportation Costs Across Dispersed Waste Sources | -0.8% | Remote and rural areas, including dispersed agricultural zones | Long term (≥ 4 years) |
| Fragmented Agricultural Waste Collection Networks | -0.5% | KwaZulu-Natal, Eastern Cape, and Limpopo agricultural corridors | Long term (≥ 4 years) |
| Source: Mordor Intelligence | |||
Limited Source Separation Reducing Organic Feedstock Quality
South Africa's municipal waste collection system continues to face coverage and service consistency challenges, limiting the availability of clean organic feedstock for renewable gas production. Only 59.7% of households received waste collection at least once a week in 2025, while another 34.9% relied on communal or household refuse dumps. Mixed waste reduces the biochemical methane potential and increases pre-treatment costs for anaerobic digestion operators. Irregular collection and inadequate source segregation also create inconsistent feedstock volumes, making it more difficult for renewable gas facilities to secure stable long-term supplies. Reliable quality requires separate bins, regular public education, and municipal enforcement. These constraints slow the expansion of the South Africa renewable gas waste feedstock management market, especially where local collection systems are weak and operators must spend more on sorting material after collection.
Collection, Transport, and Agricultural Network Gaps
Gauteng and Western Cape municipalities reported weekly collection rates above 90% of households, but rural and peri-urban service gaps persisted. Collection service remains uneven across community types. Many high-potential agricultural areas are located far from licensed pre-treatment and anaerobic digestion facilities, limiting the commercial recovery of livestock manure, crop residues, and agro-industrial waste. Transport costs rise when feedstock volumes are dispersed across farms, provincial towns, and industrial sites, because vehicles can carry lower loads over longer routes before reaching a licensed facility. This increases the delivered cost of feedstock and reduces the economic viability of smaller renewable gas projects. Seasonal fluctuations in agricultural residue generation further complicate feedstock planning, requiring operators to secure multiple supply contracts across different waste streams to maintain year-round plant utilization. Smaller municipalities often lack the financing, fleet maintenance, transfer infrastructure, and skilled personnel needed for broad collection coverage. Limited investment in source segregation and transfer stations also reduces the quantity and quality of organic waste available for renewable gas production. As a result, private operators frequently need to establish their own collection networks or partner directly with commercial waste generators, increasing capital and operating costs.
*Our forecasts treat driver/restraint impacts as directional, not additive. The impact forecasts reflect baseline growth, mix effects, and variable interactions.
Segment Analysis
By Feedstock Type: Municipal Solid Waste Anchors Supply, While Food Waste Changes the Value Mix
Municipal solid waste accounted for 34.6% of the South Africa renewable gas waste feedstock market share in 2025, reflecting the presence of formal infrastructure near major urban waste sources. South Africa generated 12.7 million tons of municipal waste in 2024, and Gauteng, Western Cape, and KwaZulu-Natal accounted for much of the recoverable organic fraction due to higher population density and higher waste intensity. Municipal streams can provide continuous volumes when collection and sorting are in place. Still, limited source separation exposes facilities to contamination risk and can reduce the value of otherwise large waste flows. Sewage sludge and biosolids form a more consistent secondary stream, as around 50 wastewater treatment works already use anaerobic digestion for sludge stabilization, although most historically flared the resulting biogas.
This material already moves through eligible infrastructure without full energy recovery, making wastewater sites relevant for incremental throughput where external organics can be safely accepted. Agricultural waste, including manure, slurry, and crop residues, offers a broad rural supply base. Food and beverage processing waste is forecast to grow at a 9.5% CAGR through 2031, driven by brewery, dairy, and agro-processing effluents with high organic content. Distell's Vinaqua wastewater facility in Worcester showed how co-digestion can provide on-site gas while addressing effluent requirements. The model can be used by comparable industrial sites that need an alternative to disposal, particularly where waste management and energy requirements are managed at the same location. Food waste across provincial value chains is also a large but underused resource for biomethane production.

By End-Use Facility Type: Landfill Gas Leads Current Use While Gasification Gains Ground
Landfill gas recovery sites accounted for 38.4% of the South Africa renewable gas waste feedstock management market in 2025, reflecting the existing landfill estate rather than a planned low-carbon buildout. Coastal Park's landfill gas-to-energy plant generated 1.3 million kWh per month after its November 2025 activation, following a ZAR 93 million investment, equivalent to USD 5.2 million. It showed that existing landfill assets can support energy recovery with moderate additional capital. Landfill gas remains important where historic waste volumes and gas capture systems are already in place, since these sites can use existing waste deposits without requiring separate feedstock delivery.
Anaerobic digestion is becoming a more established biological route, with Bio2Watt processing 240,000 tons of organic waste each year and Cape Town Biogas handling 250 tons per day. Long-term offtake agreements have helped both models reach commercial scale by linking plant output to defined customer demand. Gasification and thermal treatment facilities are projected to grow at a 9.8% CAGR through 2031 and can process some contaminated streams that are less suitable for biological treatment. Their tolerance for lower feedstock quality can be useful where source separation remains limited, although operators must still manage material consistency and process controls. Wastewater treatment plants are still underused because fewer than 5 of the 50 facilities that use anaerobic digestion are believed to co-digest external organics. This leaves room for operators who can organize deliveries and manage material quality before intake.
By Service Type: Collection Leads Revenue While Digital Monitoring Supports Better Margins
Feedstock collection and transport accounted for 32.1% of service revenue in 2025 and remains necessary because organic material must be moved from municipal, farm, and industrial sources to licensed facilities. EnviroServ, Interwaste, and WastePlan support this activity through their waste logistics networks and transport infrastructure, which smaller providers cannot easily replicate. The South Africa renewable gas waste feedstock management market, therefore, retains a strong physical logistics component. Collection providers also hold useful positions in feedstock contracts because they manage the link between generators and processors, including the timing, routing, and condition of delivered material.
Testing and laboratory services have smaller revenue bases but can support higher-value decisions. Biochemical methane potential analysis and contamination screening help operators decide whether gate fees cover operating costs and can influence tipping fees and contract length. Digital feedstock monitoring platforms are forecast to grow at a 12.4% CAGR through 2031. These systems use dosing controls, blending tools, and traceability records to connect waste inputs with gas output. Bakery waste can produce more than 20 times the biogas volume of cattle manure under equivalent digestion conditions, underscoring the importance of substrate selection for plant economics. Real-time quality information can improve blending decisions and reduce variability at processing plants, helping operators respond before unsuitable material affects plant performance.
Geography Analysis
Gauteng, Western Cape, and KwaZulu-Natal account for much of the recoverable municipal organic material due to their high population density and waste generation. Gauteng and Western Cape reported weekly collection coverage above 90% of households, supporting more reliable routes and formal supply. Gauteng also has industrial energy users, food processors, and active project developers. Bio2Watt's Bronkhorstspruit facility and proposed Sunderland Ridge project point to commercial development in the province. This proximity between waste sources, logistics providers, and energy buyers benefits the South Africa renewable gas waste feedstock management market by reducing travel requirements and supporting more regular collection schedules.
The Western Cape's planned 2027 ban on organic waste landfills gives the province a strong policy position. Cape Town activated Coastal Park, a landfill gas project producing 1.3 million kWh each month, and committed further funding for Bellville South and Vissershok. Cape Town Biogas processes 250 tons of organic waste each day at its Athlone facility. Established waste infrastructure supports contract-based feedstock management, though contamination continues to constrain biological treatment. The province, therefore, illustrates both the opportunity presented by concentrated waste volumes and the limits imposed by material quality, which can determine whether biological processing remains commercially practical.
KwaZulu-Natal and the Eastern Cape have significant agricultural and agro-processing feedstock potential. Still, their livestock, dairy, and food-processing residues sit alongside weaker rural and peri-urban collection systems. Limpopo faces similar transport issues because its agricultural sources are dispersed. The South Africa renewable gas waste feedstock management market needs local aggregation points before large facilities can consistently accept material from these regions. Wastewater upgrades in Gauteng, the Western Cape, and eThekwini can create additional regional co-digestion opportunities where collection capacity, stable waste volumes, and nearby energy demand align.
Competitive Landscape
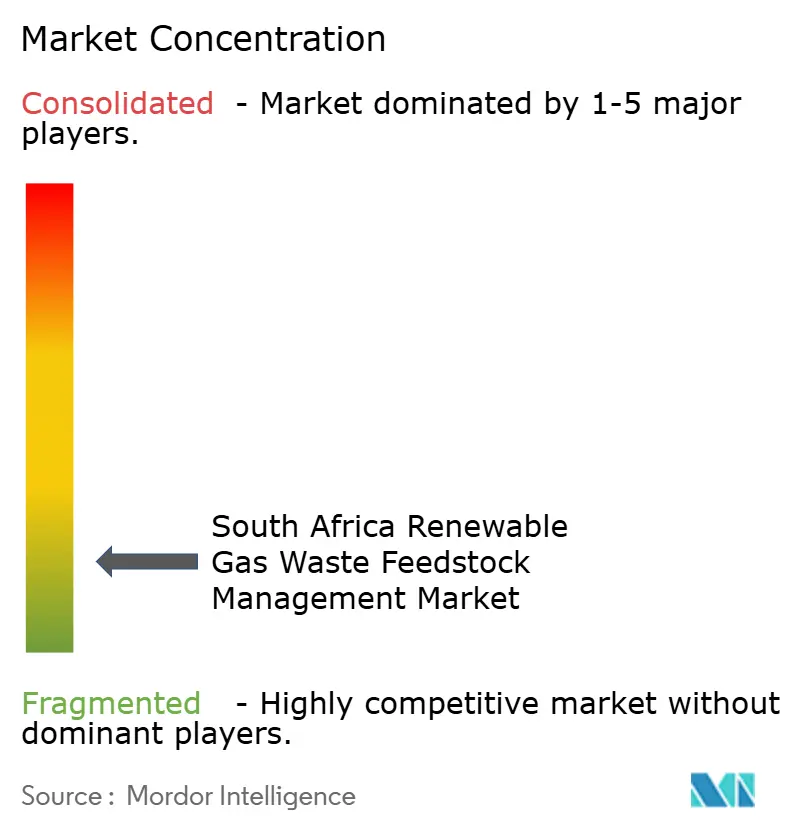
The South Africa renewable gas waste feedstock management market exhibits a low level of market concentration, with competition remaining fragmented across multiple participant groups. Fewer than 10 operators manage formal commercial throughput at scale, while smaller collectors and specialists serve narrower roles. Bio2Watt is one of the most vertically integrated companies in the South Africa renewable gas waste feedstock management market, combining feedstock aggregation, pre-treatment, anaerobic digestion, and energy offtake. Its power purchase agreements with BMW South Africa's Rosslyn plant and AB InBev's South Africa operations support this model. This integration can reduce coordination risk where feedstock quality and delivery volumes vary, because one operator can align collection, preparation, processing, and sales decisions.
Veolia Services Southern Africa and Anaergia Africa bring thermal hydrolysis and high-solids anaerobic digestion capabilities. Domestic operators often access these capabilities through licensed technology agreements rather than in-house research. EnviroServ, Interwaste, and WastePlan have established logistics positions in a collection-led service environment. Cape Town Biogas has built processing capacity around organic waste recovery in Athlone. At the same time, Bio2Watt began construction of the 9.8 MW Cape Dairy Biogas Plant in Malmesbury, using dairy slurry and other organic waste as co-feedstock. This project expands its feedstock base beyond the agricultural-food waste model at Bronkhorstspruit and demonstrates how dairy slurry can be combined with other organic material in a commercial project.
Open areas remain in mid-scale agricultural aggregation, digital quality management, and co-digestion support for wastewater treatment works. Farms and processors with consistent organic material, including HEINEKEN Beverages South Africa and Sappi, can negotiate favorable gate fees or develop on-site processing. Digital biochemical methane potential monitoring can improve blending decisions and reduce yield variability, which is relevant when the composition of incoming waste changes across loads.
South Africa Renewable Gas Waste Feedstock Management Industry Leaders
-
EnviroServ Waste Management (Pty) Ltd
-
Interwaste (Pty) Ltd
-
Veolia Services Southern Africa (Pty) Ltd
-
Bio2Watt Energy Holdings (Pty) Ltd
-
Sappi Limited
- *Disclaimer: Major Players sorted in no particular order
Recent Industry Developments
- May 2026: A Foreign Affairs Committee delegation from the European Parliament visited Bio2Watt Energy Holdings' Bronkhorstspruit biogas plant, confirming it as a flagship project under the EU's Global Gateway strategy. Climate Fund Managers committed over ZAR 635 million (USD 35.5 million) through Climate Investor ONE and TWO, enabling Bio2Watt to consolidate a ZAR 3.75 billion (USD 209.7 million) investment pipeline covering South Africa plant expansion plus new facilities in Mozambique and Uganda. The Bronkhorstspruit facility already avoids 48,000 tons of CO₂-equivalent emissions annually and supplies green energy to over 26,000 people and major industrial clients.
- December 2025: South Africa's Department of Forestry, Fisheries, and the Environment published the National Waste Management Strategy 2026, formally integrating waste-to-energy into the statutory waste hierarchy and setting a target of 10% biogas from organic waste annually by 2030. The strategy designates organic waste as a priority national stream, thereby raising the policy floor for investment in feedstock management infrastructure.
South Africa Renewable Gas Waste Feedstock Management Market Report Scope
The South Africa Renewable Gas Waste Feedstock Management Market Report is Segmented by Feedstock Type (Municipal Solid Waste, Agricultural Waste, and More), by End-Use Facility Type (Anaerobic Digestion (AD) Plants, Landfill Gas Recovery Sites, and More), and Service Type (Feedstock Collection & Transport, Feedstock Testing & Laboratory Services, and More). The Market Forecasts are Provided in Terms of Value (USD).
| Municipal Solid Waste (Organic Fraction / Source-Separated) |
| Agricultural Waste (Manure, Slurry, Crop Residues) |
| Sewage Sludge / Biosolids |
| Food & Beverage Processing Waste (FOG, Spent Grains, Off-Spec Product) |
| Industrial Organic Waste (Breweries, Paper Mills, Pharma Effluent) |
| Others |
| Anaerobic Digestion (AD) Plants |
| Landfill Gas Recovery Sites |
| Gasification / Thermal Treatment Facilities |
| Wastewater Treatment Plants (Co-Digestion) |
| Others (Pyrolysis, Hydrothermal) |
| Feedstock Collection & Transport |
| Feedstock Testing & Laboratory Services |
| Feedstock Quality Assurance |
| Digital Feedstock Monitoring Platforms |
| Feedstock Supply Chain Management & Consultancy |
| By Feedstock Type | Municipal Solid Waste (Organic Fraction / Source-Separated) |
| Agricultural Waste (Manure, Slurry, Crop Residues) | |
| Sewage Sludge / Biosolids | |
| Food & Beverage Processing Waste (FOG, Spent Grains, Off-Spec Product) | |
| Industrial Organic Waste (Breweries, Paper Mills, Pharma Effluent) | |
| Others | |
| By End-Use Facility Type | Anaerobic Digestion (AD) Plants |
| Landfill Gas Recovery Sites | |
| Gasification / Thermal Treatment Facilities | |
| Wastewater Treatment Plants (Co-Digestion) | |
| Others (Pyrolysis, Hydrothermal) | |
| By Service Type | Feedstock Collection & Transport |
| Feedstock Testing & Laboratory Services | |
| Feedstock Quality Assurance | |
| Digital Feedstock Monitoring Platforms | |
| Feedstock Supply Chain Management & Consultancy |
Key Questions Answered in the Report
What is driving renewable gas feedstock management in South Africa?
Higher organic waste volumes, landfill diversion needs, and demand for reliable energy are supporting activity. The sector is forecast to grow at an 8.4% CAGR through 2031.
Which feedstock has the largest role in South Africa?
Municipal solid waste held 34.6% of revenue in 2025, supported by large volumes around major urban centers.
Which feedstock is growing fastest?
Food and beverage processing waste is projected to grow at a 9.5% CAGR through 2031, as its organic effluents can yield high-value gases.
Which facility type leads renewable gas processing?
Landfill gas recovery sites held 38.4% in 2025, reflecting South Africa’s existing landfill infrastructure.
Why is feedstock quality important for biogas projects?
Mixed waste can reduce biochemical methane potential and raise pre-treatment costs. Separate collection and reliable quality checks are therefore important.
How are digital platforms changing feedstock operations?
Digital monitoring platforms are forecast to grow at a 12.4% CAGR through 2031, as they support dosing, blending, traceability, and improved gas yield control.