United States Renewable Gas From Waste Market Size and Share
Market Overview
| Study Period | 2020 - 2031 |
|---|---|
| Forecast Data Period | 2026 - 2031 |
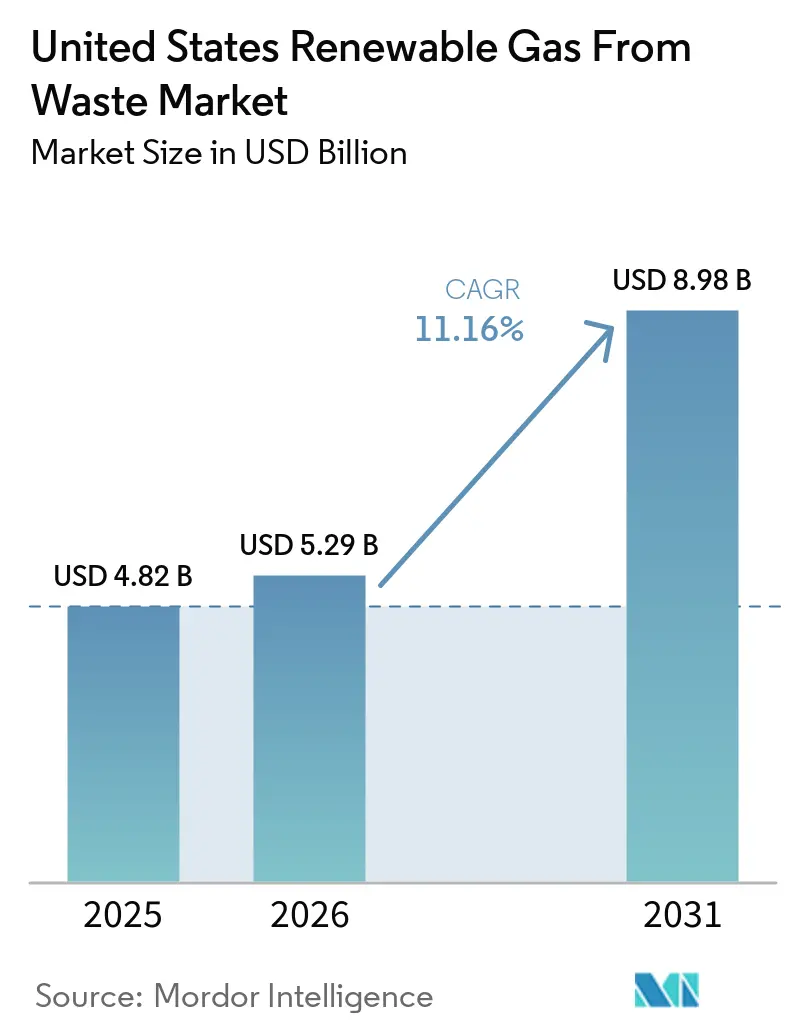
| Base Year Market Size (2025) | USD 4.82 Billion |
| Market Size (2026) | USD 5.29 Billion |
| Market Size (2031) | USD 8.98 Billion |
| Growth Rate (2026 - 2031) | 11.16% CAGR |
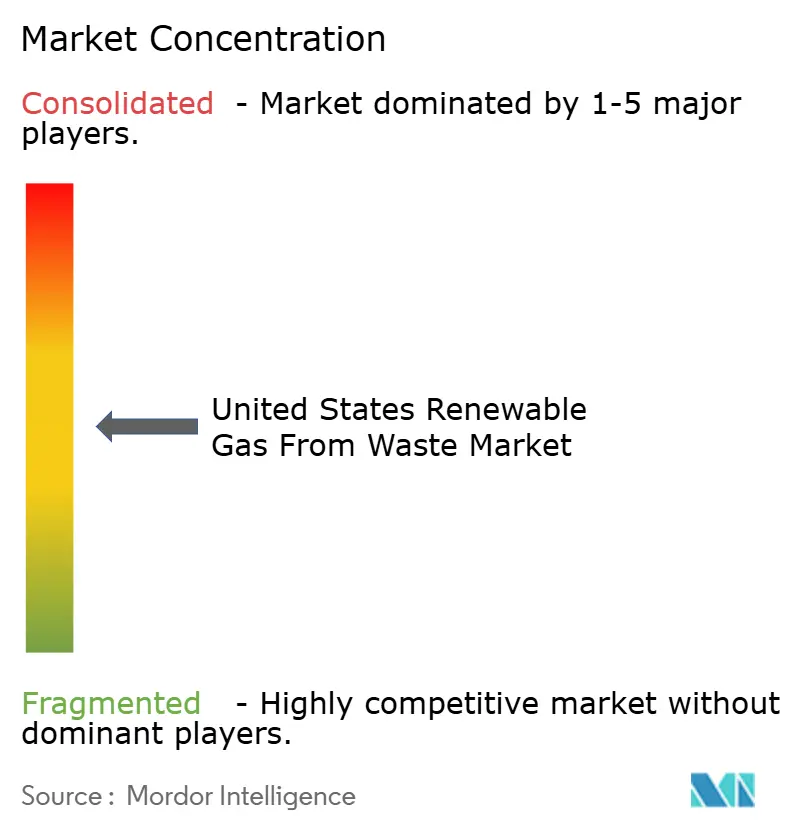
| Market Concentration | Medium |
Major Players *Disclaimer: Major Players sorted in no particular order Image © Mordor Intelligence. Reuse requires attribution under CC BY 4.0. | |
United States Renewable Gas From Waste Market Analysis by Mordor Intelligence
The United States Renewable Gas From Waste Market size is projected to be USD 4.82 billion in 2025, USD 5.29 billion in 2026, and reach USD 8.98 billion by 2031, growing at a CAGR of 11.16% from 2026 to 2031.
Federal support has become more dependable as Section 45Z moved toward implementation clarity and extended the planning window for developers with longer construction timelines. Demand is also becoming more durable because fleet operators, utilities, and large energy users are seeking low-carbon fuels and firm renewable power that can be contracted for long periods rather than sold into short-term markets. State organics diversion rules are widening the feedstock base and are steadily pushing food waste and other organic streams away from disposal and toward digestion and upgrading systems. Capital is now spreading well beyond a few coastal states. At the same time, softer LCFS prices and remaining policy interpretation risk still shape near-term underwriting in the United States renewable gas from waste market.
Key Report Takeaways
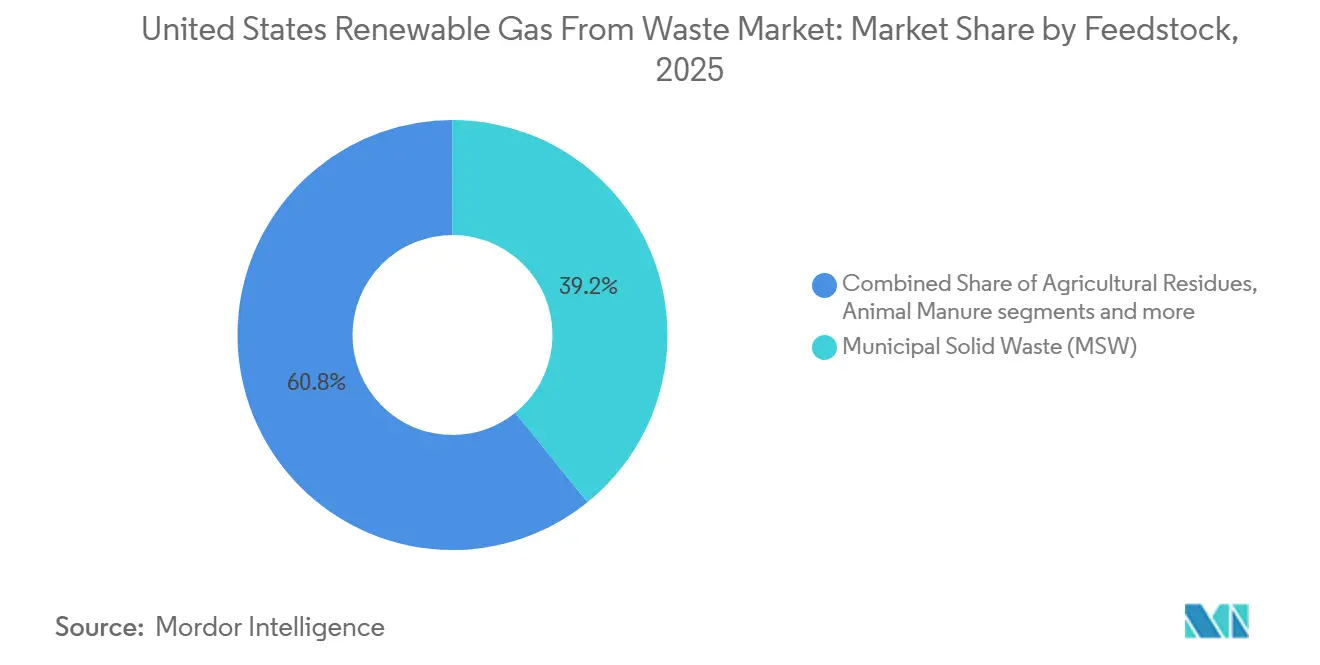
- By feedstock, municipal solid waste led with 39.2% of the United States renewable gas from waste market share in 2025, while food waste is projected to expand at a 13.8% CAGR through 2031.
- By technology, anaerobic digestion accounted for 41.8% of the United States renewable gas from waste market size in 2025, while biogas upgrading systems are projected to grow at a 12.3% CAGR through 2031.
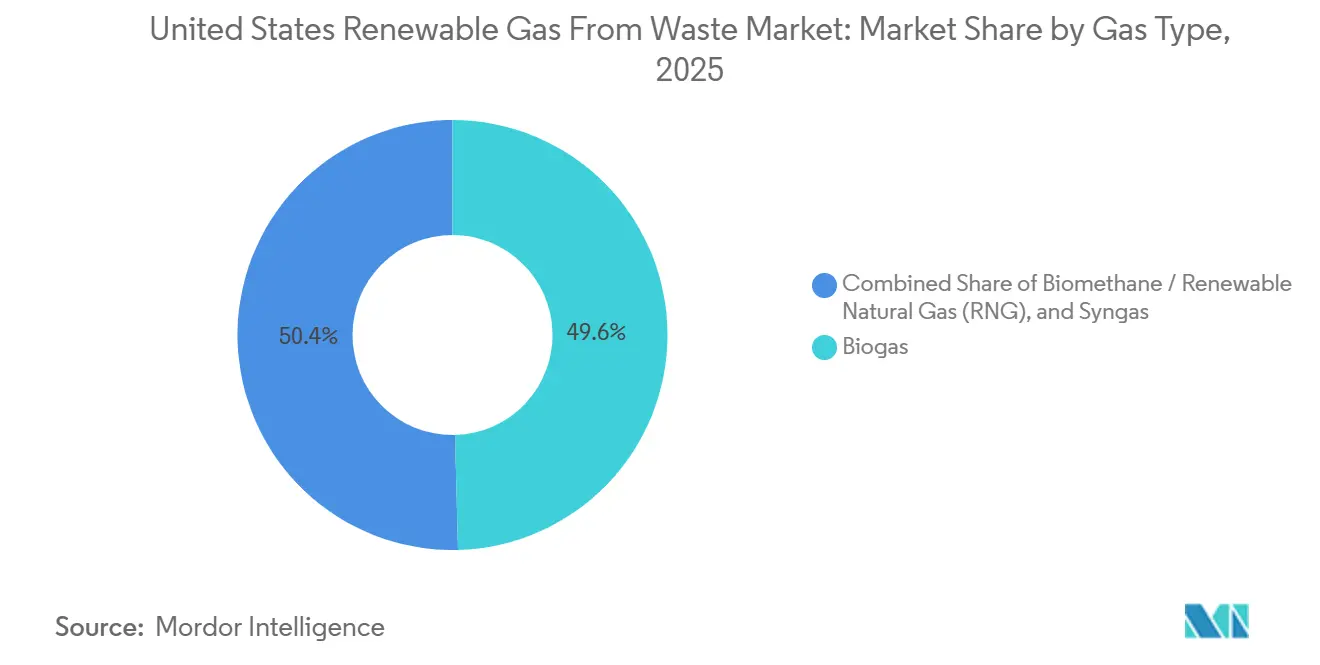
- By gas type, biogas accounted for a 49.6% share in 2025, while renewable natural gas is projected to grow at a 13.1% CAGR through 2031.
- By application, electricity generation accounted for 36.5% share in 2025, while transportation fuel is forecast to grow at a 14.3% CAGR through 2031.
- By component, gas processing and upgrading units held 29.8% share in 2025, while monitoring and control systems are projected to expand at a 11.2% CAGR through 2031.
Note: Market size and forecast figures in this report are generated using Mordor Intelligence’s proprietary estimation framework, updated with the latest available data and insights as of January 2026.
United States Renewable Gas From Waste Market Trends and Insights
Drivers Impact Analysis*
| Driver | (~) % Impact on CAGR Forecast | Geographic Relevance | Impact Timeline |
|---|---|---|---|
| IRA Tax Credits Catalyzing Large-Scale Capital Deployment | +2.8% | National, with concentration in California, Texas, Illinois, and the Midwest agricultural states | Medium term (2-4 years) |
| Federal RFS RIN Credits Boosting RNG Project Economics | +2.5% | Nationwide, the highest value is in states with active D3 RIN generation across landfill, dairy, and food waste pathways. | Short term (≤ 2 years) |
| California LCFS Rewarding Negative Carbon Intensity Feedstocks | +1.8% | California primary, with spillover to Oregon and Washington through linked clean fuel programs | Medium term (2-4 years) |
| Corporate Fleet Decarbonization Driving Long-Term RNG Offtake | +1.4% | National, concentrated along major freight corridors and in states with fleet emission mandates. | Medium term (2-4 years) |
| State Organics Diversion Mandates Expanding Feedstock Availability | +1.0% | California, New York, Washington, Connecticut, New Jersey, with wider national expansion | Long term (≥ 4 years) |
| AI-Driven Electricity Demand Strengthening Dispatchable Biogas Value | +0.7% | Northern Virginia, Texas, and Midwest data center clusters | Long term (≥ 4 years) |
| Source: Mordor Intelligence | |||
IRA Tax Credits Catalyzing Large-Scale Capital Deployment
The Inflation Reduction Act's Section 45Z clean fuel production credit has become the strongest project finance catalyst in the United States renewable gas from waste market.[1]U.S. House of Representatives, “26 USC §45Z, Clean Fuel Production Credit,” U.S. House of Representatives, uscode.house.gov. Unlike older volume-based structures, Section 45Z ties credit value to lifecycle carbon intensity, giving dairy manure and food waste pathways a clear economic edge over higher-carbon feedstocks.[2]Federal Register, “Section 45Z Clean Fuel Production Credit Proposed Regulations,” Federal Register, govinfo.gov. The One Big Beautiful Bill Act extended the credit through 2029, materially improving the bankability of projects that require 5 to 7 years from development to operation. The February 2026 proposed regulations from the United States Treasury and IRS also confirmed that biogas upgraded to pipeline-quality biomethane qualifies for the credit, removing one of the biggest financing uncertainties in the market. Transferability has widened the buyer pool for these credits, and this effect was evident in 2025, when 40 new farm-based systems and 20 new landfill gas systems came online, totaling a combined capital of USD 1.75 billion.
Federal RFS RIN Credits Boosting RNG Project Economics
The Renewable Fuel Standard remains the primary revenue stream for the United States renewable gas from waste market, and the March 2026 final rule set total applicable cellulosic biofuel volumes at 1.36 billion RINs for 2026 and 1.43 billion RINs for 2027.[3]U.S. Environmental Protection Agency, “Final Renewable Fuel Standards for 2026 and 2027,” U.S. Environmental Protection Agency, epa.gov. The same rule removed eRINs from the program, narrowing the compliance pathway and concentrating demand on D3 cellulosic RINs generated largely by RNG projects. The Biogas Regulatory Reform Rule also reduced compliance friction by decoupling RNG RIN generation from transportation fuel demonstration requirements under 40 CFR Part 80 Subpart E. Market demand has kept pace with that framework because 94% of all on-road natural gas vehicle fuel consumed in the United States in 2025 was RNG, equal to 755 million GGE out of 806 million GGE total, while RNG motor fuel use rose 13% year over year. This combination of regulatory clarity and verified fuel consumption continues to support project returns at levels that remain attractive to institutional capital in the United States renewable gas from waste market.
California LCFS Rewarding Negative Carbon Intensity Feedstocks
California's Low Carbon Fuel Standard remains the richest state-level revenue stream for the United States renewable gas from waste market when projects qualify with negative carbon-intensity scores. California Air Resources Board (CARB) tightened the carbon intensity reduction benchmark to 22.75% effective July 1, 2025, and that single rule change led to two consecutive net deficit quarters in the second half of 2025. Credit prices did not yet fully reflect that tighter balance because the 2025 average remained USD 57 per metric ton against a ceiling of USD 268.9, but the market signal still points to firmer pricing once the credit bank is worked down. California AB 70 would require CARB to amend regulations by January 1, 2027, so that pipeline biomethane from diverted organic waste can count toward utility procurement targets under SB 1440. If that path is pursued, eligible projects would gain a third value stream in addition to RFS and LCFS revenues, further improving the economics of organics diversion facilities in the state.
Corporate Fleet Decarbonization Driving Long-Term RNG Offtake
Long-term offtake agreements have become an important financing anchor in the United States renewable gas from waste market, as they replace merchant exposure with contracted revenue. Downstream infrastructure is also expanding with demand, shown by Clean Energy Fuels opening six new RNG fueling stations in May 2026 and announcing additional fleet agreements in March 2026. Corporate buyers are also stepping in on the supply side, as Vanguard Renewables completed three RNG facilities through a joint venture with TotalEnergies, with output committed to AstraZeneca's United States research and manufacturing operations. It provides lenders with clearer visibility into cash flow, which supports larger project financing along freight corridors and other high-demand locations.
Restraints Impact Analysis*
| Restraint | (~) % Impact on CAGR Forecast | Geographic Relevance | Impact Timeline |
|---|---|---|---|
| RFS Volatility and Declining LCFS Credit Prices Hurting Revenue Visibility | -2.0% | National for RFS, California, Oregon, and Washington for LCFS | Short term (≤ 2 years) |
| Federal Policy Uncertainty Stalling Final Investment Decisions | -1.5% | National | Short term (≤ 2 years) |
| Pipeline Interconnection Backlogs Delaying RNG Project Commissioning | -1.2% | National, most acute in PJM, MISO, and ERCOT service areas | Medium term (2-4 years) |
| Geographic Feedstock Dispersal Limiting Viable Economic-Scale Sites | -0.8% | Agricultural Midwest, rural Southeast, and sparse population Western states | Long term (≥ 4 years) |
| Source: Mordor Intelligence | |||
RFS Volatility and Declining LCFS Credit Prices Hurting Revenue Visibility
Many projects in the United States renewable gas from waste market still rely on a stacked revenue model built around federal RINs and California LCFS credits, which makes revenue forecasts sensitive to policy and pricing changes. The April 2026 final rule partially waived the 2025 cellulosic biofuel volume from 1.38 billion RINs to 1.21 billion RINs because production fell short, which showed that the EPA is willing to reduce obligations when supply does not meet expectations. On the LCFS side, the second half of 2025 produced two net-deficit quarters, yet the annual average credit price remained at USD 57 per metric ton, below the 2024 average of USD 60. That disconnect reflects the overhang from a 39.69 million metric ton credit bank at the end of 2025, leaving a meaningful revenue gap for projects underwritten at LCFS values above USD 100 per metric ton. Revenue visibility is further affected by the provisional emissions rate process under Section 45Z, which slows appraisal for co-digestion projects that still need a bankable carbon intensity score.
Federal Policy Uncertainty Stalling Final Investment Decisions
Final investment decisions in the United States renewable gas from waste market remain highly sensitive to tax credit design because project returns often depend on IRA support covering 25% to 40% of capital costs. Treasury's initial guidance path left a gap, as Notice 2024-49 deferred full proposed regulations until February 2026, and many developers paused engineering, procurement, and construction decisions while they waited for clarity on feedstock treatment and emissions rate tables. The February 2026 proposed regulations addressed part of that uncertainty but also limited eligible feedstocks to those grown or produced in the United States, Mexico, or Canada for fuel produced after December 31, 2025. The One Big Beautiful Bill Act added another layer by making foreign-influenced entities ineligible for the 45Z credit for tax years beginning after July 4, 2025, triggering legal review for sponsors with international investors. As a result, a share of development-stage projects, especially those using more complex co-digestion configurations, are still waiting for final guidance before committing capital, even though long-term demand remains strong.
*Our forecasts treat driver/restraint impacts as directional, not additive. The impact forecasts reflect baseline growth, mix effects, and variable interactions.
Segment Analysis
By Feedstock: MSW and Food Waste Define the Growth Spectrum
Municipal Solid Waste accounted for 39.2% of the United States renewable gas from waste market share in 2025, reflecting the long-established installed base of landfill gas capture systems across the country. The American Biogas Council counted 599 landfill gas facilities producing 559 billion cubic feet per year, and landfill biogas investment exceeded USD 1 billion annually in both 2023 and 2024. Food waste is the fastest-growing feedstock, with a forecast CAGR of 13.8% from 2026 to 2031, supported by a near tripling of investment in food waste-only digestion facilities between 2024 and 2025 to USD 325 million and an 18% rise in biogas capture to 28 billion cubic feet in 2025. This pattern shows that the United States renewable gas from waste market is still anchored by mature landfill assets even as organics diversion is shifting the growth center toward more distributed feedstocks.
Animal manure, especially dairy and swine waste, has grown rapidly because lower carbon-intensity scores translate into greater tax credit value under Section 45Z. Sewage sludge remains a large and widely available feedstock, with more than 1,240 water resource recovery facilities operating anaerobic digesters, although municipal procurement cycles and aging infrastructure slow new-build activity. Industrial organic waste is becoming more relevant in food processing and beverage operations, where feedstock supply is predictable. At the same time, more than 470 active landfills still flare gas that could, in theory, be captured and upgraded, leaving a measurable project pipeline for the United States renewable gas from waste market.


By Technology: Anaerobic Digestion Leads, Biogas Upgrading Accelerates
Anaerobic digestion held 41.8% share in 2025 and remains the lead technology because it is proven across manure, food waste, wastewater sludge, and industrial organics. That lead is tied to a major project design shift, as farm-based anaerobic digestion RNG facilities increased from 90 in 2020 to 414 in 2025, representing 360% growth in five years. Biogas upgrading systems are the fastest-growing technology segment, with a forecast CAGR of 12.3% from 2026 to 2031. The acceleration in upgrading is consistent with the fact that 95% of new United States biogas projects since 2024 have been designed for RNG production rather than onsite power generation.
Landfill gas recovery still accounts for a large share of the technology mix because federal emissions rules support capture at larger landfill sites, and Illinois added the most new landfill gas capacity from 2023 to 2025. Gasification and pyrolysis remain smaller but developing options in the United States renewable gas from waste market, especially for municipal solid waste and agricultural residues, where conventional digestion can deliver lower biomethane yield. These thermochemical routes are attracting attention for electricity generation as policy support broadens and developers seek better ways to monetize harder-to-digest feedstocks. Quality compliance also matters at the point of upgrading and injection, so ASTM D8452 and related gas quality standards continue to shape technology selection at commercial sites.
By Gas Type: Biogas Holds Scale, RNG Captures Growth Premium
Biogas retained a 49.6% share in 2025 because electricity-generating landfill gas projects and wastewater digester systems still make up the largest installed base in the country. More than 52% of captured biogas was used to generate electricity in 2025, indicating that legacy conversion assets remain important even as project economics continue to move toward pipeline-grade fuel. Renewable natural gas is the fastest-growing gas type, with a forecast CAGR of 13.1% from 2026 to 2031, while biomethane for utility grid injection is gaining momentum through state procurement mandates such as California SB 1440, which sets an annual procurement target of 72.8 billion cubic feet by 2030, and AB 70 would expand the eligibility path for pipeline biomethane made from diverted organic waste.
Syngas remains a smaller category, but it has strategic value in the United States renewable gas from waste market as gasification and pyrolysis advance for feedstocks less suited to biological conversion. The contrast between biogas and RNG shows that the market is no longer centered only on energy output and is increasingly organized around carbon intensity, fuel quality, and environmental attributes. That change is affecting valuation, project design, and the kinds of buyers entering the United States renewable gas from waste market.
By Application: Transportation Fuel Takes the Wheel in United States Renewable Gas Applications
Electricity generation held 36.5% share in 2025 because landfill gas power systems and wastewater digester cogeneration plants were built well before the current RNG transport fuel cycle. Combined Heat and Power remains a practical application at municipal water resource recovery facilities and food processing sites where thermal efficiency matters alongside power output. Grid injection has also grown steadily through utility procurement support in California and through parallel interest in states such as New York, Illinois, and Massachusetts. The installed base in power generation still matters because it provides operational data, site control, and upgrade pathways for future conversion to pipeline-quality fuel.
Transportation fuel is projected to grow at a 14.3% CAGR through 2031, making it the fastest-growing segment of the United States renewable gas from waste market by application. That pace is tied directly to the fact that 94% of on-road natural gas vehicle fuel in the United States in 2025 was already RNG. Industrial, residential, and commercial heating are also gaining share through utility procurement contracts that create a lower-risk grid injection outlet for producers. A newer use case is the co-location of biogas with electricity assets near data center campuses that want firm renewable power and want to bypass long interconnection queues, turning dispatchable generation into a premium application rather than a secondary one.
By Component: Gas Processing Dominates, Monitoring Systems Ascend
Gas Processing and Upgrading Units accounted for a 29.8% share in 2025, reflecting the importance of upgrading raw biogas to pipeline-quality standards in terms of both cost and revenue. This stage accounts for a large share of value because membrane separation, pressure swing adsorption, and water scrubbing systems are among the most expensive pieces of equipment in an RNG project. Monitoring and Control Systems are the fastest-growing component segment, with a 11.2% CAGR from 2026 to 2031, as operators need stronger remote monitoring, reporting, and optimization across larger, distributed portfolios. The growth in this segment is also tied to documentation requirements for carbon intensity, as more lenders and buyers now expect continuous operational records rather than periodic reporting.
Gas Collection Systems, Digesters and Fermentation Systems, and Compressors and Storage Systems continue to represent large installed base demand across agricultural and food waste projects. The addition of 40 new farm-based biogas systems and 20 new landfill systems in 2025 increased demand for collection infrastructure and compression equipment across the United States renewable gas from waste market. Power generation equipment is not the main growth engine in new builds, but it still benefits from replacement demand across more than 1,450 electricity-producing biogas sites. ISO 14001 systems and SCADA-based controls are also becoming standard in lender due diligence, which gives the monitoring segment a stronger compliance role in the United States renewable gas from waste market.
Geography Analysis
California led state-level capital deployment in the United States renewable gas from waste market, with USD 1.4 billion in accumulated biogas investment and more than a quarter of all United States farm-based biogas capture systems. California and Illinois anchor the national footprint for different reasons: California leads in capital intensity, while Illinois stands out for landfill gas project density and recent capacity additions. California's position is strengthened by the LCFS and by utility procurement obligations under SB 1440, which keep dairy RNG and other low-carbon-intensity pathways commercially attractive. Illinois also benefits from clean energy mandates that target 40% renewable electricity by 2030 and 100% clean energy by 2050, which help support long-duration landfill gas and RNG contracting.
Pennsylvania, Texas, Michigan, and the broader Midwest form a strong second tier in the United States renewable gas from waste market. Pennsylvania led the country in annual landfill biogas capture capacity at 56.6 billion cubic feet per year. It hosts 3 of the 10 largest United States biogas facilities, giving it a strong operating base where landfill density and pipeline access overlap. Texas attracted more than USD 100 million in new biogas capital in 2025 and is becoming a dual pathway state, with agricultural RNG development alongside growing demand for dispatchable power near data center clusters in the Dallas-Fort Worth corridor. Across Wisconsin, Indiana, Nebraska, and nearby states, manure-based digestion is gaining traction because these feedstocks perform well under carbon intensity-based support structures.
Washington, Idaho, and Florida each recorded more than USD 100 million in new biogas investment in 2025, which shows that expansion is spreading across very different regulatory and feedstock environments. Washington is especially notable because HB 1799 and HB 2301 set a target to divert 75% of organic materials from landfills by 2030, compared with 2015 levels, and also required businesses generating 4 or more cubic yards of organic waste per week to arrange organics management service as of January 1, 2025. That policy structure, combined with an existing agricultural base and access to technology-heavy end markets, makes Washington one of the more active new development frontiers through 2031. The result is a United States renewable gas from waste market that is broadening beyond a few early leader states and becoming more nationally distributed in both capital deployment and project origination.
Competitive Landscape
The United States renewable gas from waste market is moderately concentrated at the platform level, with a small set of large operators controlling meaningful landfill gas and agricultural digestion portfolios. At the same time, a broader middle tier remains active in food waste, wastewater, and co-digestion projects. Archaea Energy, now part of BP, is the largest RNG producer in the United States by production volume and uses its Archaea Modular Design platform to standardize project delivery across landfill and waste-stream types. That modular approach shortens construction timelines, lowers site execution risk, and makes smaller projects more repeatable across a wide portfolio. Waste Management's USD 1.6 billion program to build 20 new RNG facilities by 2026 demonstrates how captive landfill owners are converting legacy gas streams into higher-value fuel assets. Republic Services is following a similar scale strategy, aiming to reuse 50% more biogas by 2030, which reinforces the advantage held by operators that control both feedstock and disposal infrastructure.
A second competitive pattern is the rise of joint ventures that match development expertise with institutional capital. Ameresco closed the Neogenyx Fuels joint venture with HASI in May 2026, with USD 400 million committed against a development pipeline exceeding 13.2 million MMBtu per year of non-electric renewable fuel capacity. Vanguard Renewables also completed 3 RNG facilities through its joint venture with TotalEnergies, with all output contracted to AstraZeneca's United States operations. These structures reduce capital bottlenecks and allow the United States renewable gas from waste market to support larger development programs without relying solely on balance-sheet funding.
The main white space remains in mid-scale agricultural co-digestion, where developers who can aggregate manure and food waste into a single low-carbon-intensity project are likely to secure stronger economics. Regulatory compliance also acts as a real barrier to entry because EPA biogas rules under 40 CFR Part 80 Subpart E reward teams that can manage registration, reporting, and fuel pathway documentation with fewer delays. That favors established operators with dedicated compliance staff and repeat financing relationships, even though many regional developers still compete for site-level opportunities. Competitive behavior in the United States renewable gas from waste market is therefore moving toward larger standardized portfolios, more contracted offtake, and deeper capital partnerships through 2031.
United States Renewable Gas From Waste Industry Leaders
Archaea Energy
Clean Energy Fuels Corp.
Waste Management Inc. / WM
Republic Services
OPAL Fuels
- *Disclaimer: Major Players sorted in no particular order

Recent Industry Developments
- May 2026: Neogenyx Fuels commenced construction of its first agricultural RNG facility at Adams Land & Cattle's feedlot in Broken Bow, Nebraska, converting cattle manure into pipeline-quality RNG and establishing the JV's inaugural project under the USD 400 million HASI investment commitment.
- March 2026: Aemetis, Inc. secured an Initial Resolution from California's Capital Programs & Climate Financing Authority supporting up to USD 1.1 billion in tax-exempt bond financing for the construction of more than 40 additional dairy digesters and biogas pipeline connections at its Keyes, California RNG facility, marking one of the largest single-state financing commitments to biogas infrastructure in United States history.


United States Renewable Gas From Waste Market Report Scope
| Municipal Solid Waste (MSW) |
| Agricultural Residues |
| Animal Manure |
| Industrial Organic Waste |
| Sewage Sludge |
| Food Waste |
| Others |
| Anaerobic Digestion |
| Landfill Gas Recovery |
| Gasification |
| Pyrolysis |
| Biogas Upgrading Systems |
| Others |
| Biogas |
| Biomethane / Renewable Natural Gas (RNG) |
| Syngas |
| Electricity Generation |
| Combined Heat & Power (CHP) |
| Grid Injection |
| Transportation Fuel |
| Industrial Heating |
| Residential & Commercial Heating |
| Others |
| Gas Collection Systems |
| Digesters & Fermentation Systems |
| Gas Processing & Upgrading Units |
| Compressors & Storage Systems |
| Power Generation Equipment |
| Monitoring & Control Systems |
| Others |
| By Feedstock | Municipal Solid Waste (MSW) |
| Agricultural Residues | |
| Animal Manure | |
| Industrial Organic Waste | |
| Sewage Sludge | |
| Food Waste | |
| Others | |
| By Technology | Anaerobic Digestion |
| Landfill Gas Recovery | |
| Gasification | |
| Pyrolysis | |
| Biogas Upgrading Systems | |
| Others | |
| By Gas Type | Biogas |
| Biomethane / Renewable Natural Gas (RNG) | |
| Syngas | |
| By Application | Electricity Generation |
| Combined Heat & Power (CHP) | |
| Grid Injection | |
| Transportation Fuel | |
| Industrial Heating | |
| Residential & Commercial Heating | |
| Others | |
| By Component | Gas Collection Systems |
| Digesters & Fermentation Systems | |
| Gas Processing & Upgrading Units | |
| Compressors & Storage Systems | |
| Power Generation Equipment | |
| Monitoring & Control Systems | |
| Others |


Key Questions Answered in the Report
What is the expected value of renewable gas from waste in the United States by 2031?
The sector is projected to reach USD 8.98 billion by 2031, up from USD 5.29 billion in 2026, supported by an 11.16% CAGR during 2026 to 2031.
Which feedstock is growing fastest in this space?
Food waste is the fastest growing feedstock with a 13.8% CAGR through 2031, helped by stronger organics diversion and higher investment in dedicated digestion facilities.
Why is transportation fuel expanding faster than electricity generation?
Transportation fuel is projected to grow at 14.3% CAGR because 94% of on-road natural gas vehicle fuel in the United States in 2025 was already RNG, which shows a strong and proven demand base.
Which technology is leading project deployment?
Anaerobic digestion led with 41.8% share in 2025 because it is already bankable across manure, food waste, wastewater sludge, and industrial organics.
Which gas type is gaining the strongest premium?
RNG is the fastest growing gas type at 13.1% CAGR, driven by stronger revenue stacking under RFS, LCFS, and Section 45Z than most onsite power pathways can offer.
Which states are shaping current project activity the most?
California and Illinois remain leading states, while Pennsylvania, Texas, Washington, Idaho, and Florida are also important because of strong capital inflows, feedstock availability, and policy support.
Page last updated on:


