Market Overview
| Study Period | 2020 - 2031 |
|---|---|
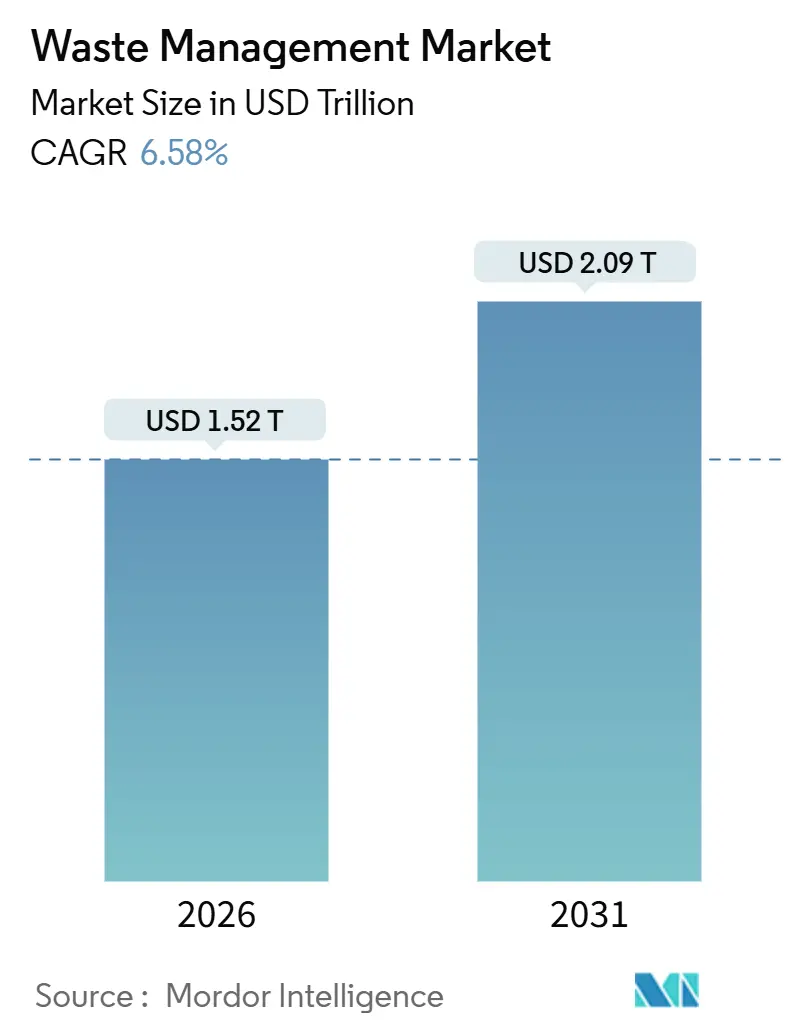
| Market Size (2026) | USD 1.52 Trillion |
| Market Size (2031) | USD 2.09 Trillion |
| Growth Rate (2026 - 2031) | 6.58% CAGR |
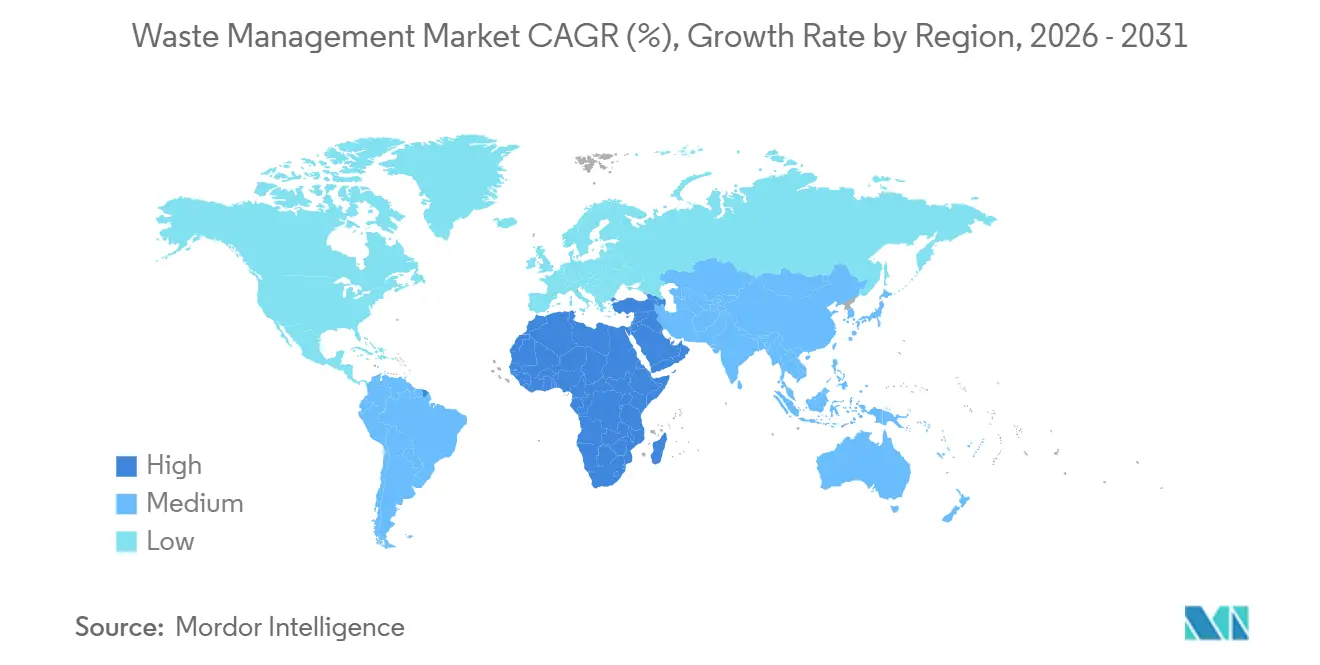
| Fastest Growing Market | Middle East and Africa |
| Largest Market | Asia Pacific |
| Market Concentration | Medium |
Major Players *Disclaimer: Major Players sorted in no particular order Image © Mordor Intelligence. Reuse requires attribution under CC BY 4.0. | |
Waste Management Market Analysis by Mordor Intelligence
The Waste Management Market size is estimated at USD 1.52 trillion in 2026, and is expected to reach USD 2.09 trillion by 2031, at a CAGR of 6.58% during the forecast period (2026-2031). The opening shift from disposal-centric operations toward resource recovery underscores this market size and growth trajectory. Mandatory recycled-content laws in the European Union and several U.S. states, broader extended-producer-responsibility (EPR) mandates across Asia-Pacific, and Scope-3 waste reporting tied to corporate science-based targets are accelerating capital flows into advanced sorting, chemical recycling, and waste-to-energy infrastructure. Landfill services still anchor revenue, yet operators are pivoting as recycling and resource-recovery lines attract 6.80% annual growth, supported by artificial-intelligence robotics that deliver 99% purity at material-recovery facilities. Asia-Pacific remains the revenue epicenter, but sovereign-wealth-fund financing of waste-to-energy projects is lifting the Middle East and Africa to the fastest regional CAGR (9.1%). Competitive pressure is intensifying as energy majors and digital-sorting start-ups push incumbents to bundle collection, treatment, and renewable-fuel production within integrated offerings.
Key Report Takeaways
- By service type, landfill operations commanded 52.45% of Waste Management's market share in 2025; recycling and resource recovery are advancing at a 6.80% CAGR to 2031.
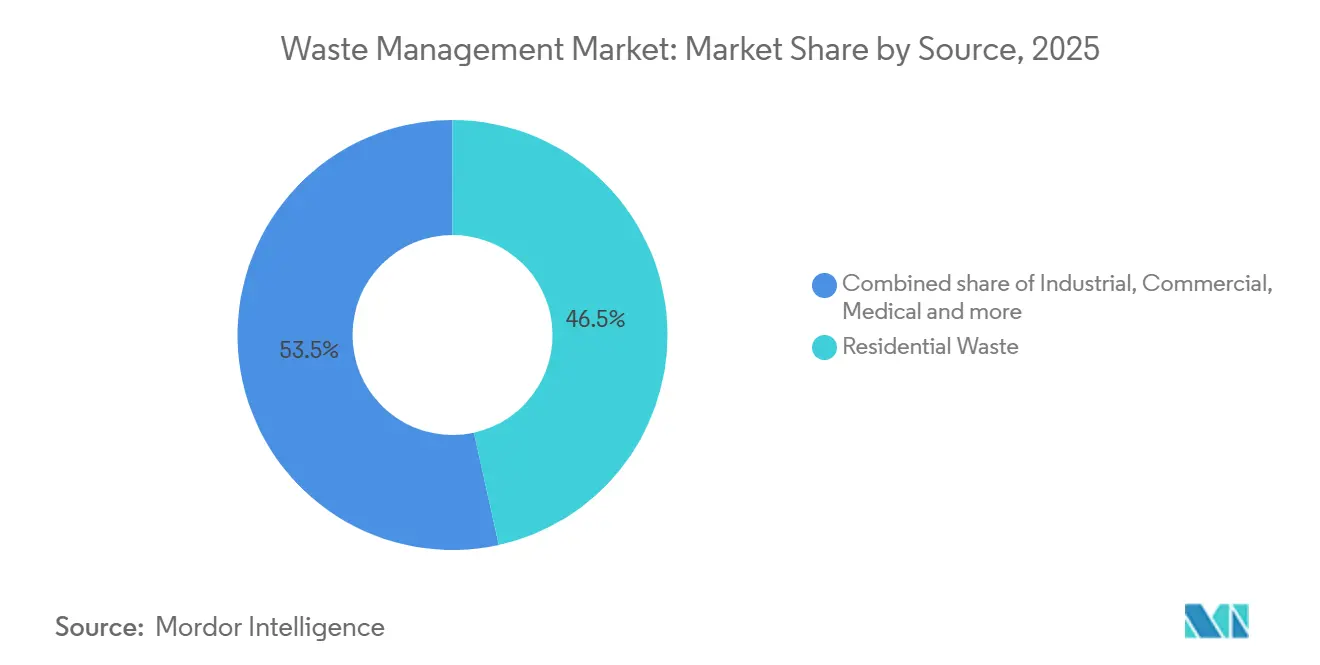
- By source, residential waste contributed 46.54% of 2025 revenue, while industrial streams are growing at an 8.3% CAGR through 2031.
- By waste type, municipal solid waste held 46.78% of revenue in 2025; electronic waste is forecast to expand at a 10.2% CAGR to 2031.
- By geography, Asia-Pacific captured 56% of global revenue in 2025, whereas the Middle East and Africa are set to grow at a 9.1% CAGR through 2031.
Note: Market size and forecast figures in this report are generated using Mordor Intelligence’s proprietary estimation framework, updated with the latest available data and insights as of January 2026.
Global Waste Management Market Trends and Insights
Drivers Impact Analysis*
| Drivers | (~) % Impact on CAGR Forecast | Geographic Relevance | Impact Timeline |
|---|---|---|---|
| Mandatory recycled-content laws for plastic packaging | +1.2% | Europe, North America, and export-oriented APAC economies | Medium term (2–4 years) |
| EPR expansion to textiles & electronics across APAC | +0.9% | China, India, Singapore, Hong Kong, early Japan & South Korea | Medium term (2–4 years) |
| AI-driven robotics achieving 99% MRF purity | +0.8% | North America, Europe, and advanced APAC economies | Short term (≤ 2 years) |
| Corporate science-based targets requiring Waste Scope-3 reporting | +0.7% | Multinational headquarters hubs in North America & Europe | Long term (≥ 4 years) |
| Sustainability-linked bonds for emerging-market infrastructure | +0.6% | Brazil, Indonesia, Egypt, South Africa | Long term (≥ 4 years) |
| Green-hydrogen projects using municipal solid waste | +0.5% | Germany, the Netherlands, California, and pilot sites in Japan | Long term (≥ 4 years) |
| Source: Mordor Intelligence | |||
Mandatory Recycled-Content Laws for Plastic Packaging (EU, US)
Legislation such as the European Union’s Packaging and Packaging Waste Regulation 2025/40 and California’s Senate Bill 54 compels brand owners to integrate defined shares of post-consumer resin in all primary packaging, driving multi-year offtake contracts with mechanical and chemical recyclers[1]European Commission, “Packaging and Packaging Waste Regulation 2025/40,” europa.eu . These statutes tighten quality standards, prompting upgrades in optical-sorter lines and investment in depolymerization units capable of food-grade outputs. The International Energy Agency estimates that meeting statutory targets could divert 15 million metric tons of plastic from landfills annually by 2030, provided collection systems keep pace[2]International Energy Agency, “Plastics Outlook 2024,” iea.org . Larger recyclers equipped with ISO 9001 and ISO 14001 certifications are absorbing compliance premiums, while smaller facilities lacking traceability tools struggle to remain viable. Penalties for non-compliance escalate, and procurement teams increasingly reward operators offering guaranteed purity and long-term capacity.
EPR Expansion to Textiles & Electronics Across APAC
Singapore, Hong Kong, and India broadened EPR frameworks during 2024–2025, shifting waste-collection and treatment costs upstream to product manufacturers. Penalties now reach USD 74,000 per violation in Singapore, and India’s revised targets demand 70% take-back volumes by 2027, sharpening financial incentives for design-for-disassembly[3]Singapore National Environment Agency, “Resource Sustainability Act Amendments 2024,” nea.gov.sg . Formal collection remains below 20% in much of Asia, so compliance pushes brand owners to co-fund municipal drop-off points and reverse-logistics hubs. These policies channel private capital into electronics-dismantling centers and high-throughput textile shredders, expanding addressable revenue pools beyond packaging. Industry analysts expect more jurisdictions to replicate EPR schemes as landfill capacity tightens and informal recycling draws regulatory scrutiny.
Corporate Science-Based Targets Requiring Waste Scope-3 Reporting
The Science Based Targets initiative now demands granular accounting of downstream waste emissions, pushing more than 800 global companies to set diversion and methane-abatement milestones. Waste-management contracts increasingly embed performance clauses indexed to verified recycling rates rather than tonnage alone, rewarding operators offering third-party-audited tracking. Sustainability-linked loans tied to these metrics reached USD 18 billion in 2024, illustrating how financiers price waste performance into credit spreads. Firms missing interim targets face index exclusion and reputational setbacks, so procurement teams prize partners that deliver transparent data flows suitable for assurance audits. This driver reinforces demand for blockchain-enabled traceability and ISO-aligned reporting services.
Sustainability-Linked Bonds Financing Waste Infrastructure in Emerging Markets
Multilateral lenders and national development banks are issuing bonds whose coupons step up if diversion thresholds are missed, funneling low-cost capital toward collection fleets, MRF upgrades, and landfill-gas capture. The International Finance Corporation’s USD 1 billion plastic-waste bond backs Southeast-Asian projects that formalize waste-picker networks, while Brazil’s BNDES offers concessional rates to municipalities achieving 50% diversion by 2030. Although project pipelines tripled to USD 4.2 billion in 2024, execution risks persist around land acquisition and permitting. The mechanism nevertheless de-risks ventures in tariff-sensitive regions, enlarging the future revenue base for operators with design-build-operate expertise.
Restraints Impact Analysis*
| Restraints | (~) % Impact on CAGR Forecast | Geographic Relevance | Impact Timeline |
|---|---|---|---|
| High interest rates are weakening PPP financing for recycling plants | −0.5% | Global, most acute in South America, MEA, Southeast Asia | Medium term (2–4 years) |
| Labor shortages are inflating collection wages in OECD nations | −0.4% | United States, Canada, Germany, Australia, Japan | Short term (≤ 2 years) |
| Import bans on solid waste are shrinking cross-border disposal | −0.3% | China, Southeast Asia, Turkey, select African states | Medium term (2–4 years) |
| Absence of end-of-waste rules for recycled carbon fiber | −0.2% | Europe, North America, Japan | Long term (≥ 4 years) |
| Source: Mordor Intelligence | |||
High Interest Rates Weakening PPP Financing for Recycling Plants
Global monetary tightening pushed public-private partnership (PPP) waste projects down 25% in 2024, with investment falling to USD 6.8 billion as debt-service ratios worsened. Canceled tenders in South Africa and postponed treatment plants in Indonesia illustrate how higher capital costs deter sponsors from long-tenor concessions. Municipalities lacking credit enhancements must now offer higher gate-fee guarantees or risk facility delays, extending landfill lifespans and undermining diversion targets. The financing squeeze also raises barriers for small technology providers that rely on project finance for scale-up. Unless interest rates ease, many emerging-market recycling projects will hinge on concessional or blended-finance structures.
Labor Shortages Inflating Collection Wages in OECD Countries
Vacancy rates for truck drivers and sorters remain above 8% in the United States, Canada, and Germany, driven by demographic aging and competition from e-commerce logistics. U.S. median wages for refuse collectors rose 12% year-on-year to USD 48,000 in 2024, squeezing margins in residential curbside contracts where municipal budgets are fixed. German municipalities extended collection intervals to manage staffing gaps, which in turn lifted contamination levels and customer complaints. Operators respond by fast-tracking autonomous-vehicle pilots and single-stream sorting systems, but regulatory approval for driverless fleets remains pending, delaying widespread relief. Persistent wage inflation could accelerate consolidation as smaller haulers struggle to absorb labor cost spikes.
*Our forecasts treat driver/restraint impacts as directional, not additive. The impact forecasts reflect baseline growth, mix effects, and variable interactions.
Segment Analysis
By Source: Industrial Waste Captures Compliance-Focused Capital
Industrial streams are gaining prominence even though residential waste still accounted for 46.54% of revenue in 2025, the largest share within the Waste Management market share landscape. The segment’s faster 8.3% CAGR stems from manufacturers installing on-site neutralization units to satisfy stricter occupational-safety rules such as OSHA’s 2024 Hazard Communication Standard revision. Many plants now couple closed-loop water systems with hazardous-waste pretreatment, reducing off-site hauling volumes and permitting costs. Electronics assemblers in Malaysia and Vietnam added acid-scrubbing reactors in 2025 to comply with European import audits, illustrating how downstream buyers dictate upstream waste behavior. Automotive suppliers in Mexico deployed solvent-recovery stills that recaptured 95% of isopropanol, cutting material expense and avoiding flammable-waste surcharges. These examples show that compliance investments are lining up with cost avoidance, a combination that sustains segment growth even when commodity prices dip.
Over the forecast horizon, industrial operators will sign multi-year “net-zero waste” service contracts that embed pay-for-performance clauses rather than simple tonnage fees, a structure already piloted by semiconductor fabs in Arizona and Singapore. Specialized hazardous-waste firms displaying ISO 14001 credentials are therefore winning bids over generalist haulers that lack laboratory testing and manifest-tracking software. Rising capital expenditure pushes some smaller electroplating shops to form cooperatives that share on-site treatment units, echoing pooled effluent plants adopted by Indian textile clusters. The Waste Management market is responding with modular mobile separators that treat emulsified oils at the generator’s dock, eliminating road transport and the liability it entails. As credit providers increasingly incorporate waste metrics into ESG loan covenants, industrial producers unwilling to disclose diversion progress are paying higher interest spreads, reinforcing the segment’s push toward certified vendors.


By Service Type: Recycling Rises as Landfill Dominance Erodes
Landfill disposal still led 2025 revenue with a 52.45% slice of the Waste Management market size, but recycling and resource recovery are ascending at a 6.80% CAGR to 2031. Operators in Germany and the Netherlands now pay landfill taxes above USD 110 per metric ton, a cost that has tripled since 2020 and pushes commercial customers toward diversion programs. Chemical-recycling units capable of depolymerizing mixed polyolefins into naphtha were commissioned by ExxonMobil and LyondellBasell in Texas and Antwerp during 2025, adding 140,000 metric tons of annual recycled monomer supply. U.S. municipal contracts in Portland and Austin allow haulers to earn bonus fees if contamination stays below 3%, a direct incentive that lifts robotic-sorting adoption. Japanese incinerators are covering 70% of municipal solid waste while recovering electricity for public grids, demonstrating a hybrid model where thermal treatment complements material recovery rather than replaces it.
Global investment patterns underscore the pivot: over USD 7 billion in sustainability-linked credit was earmarked for MRF upgrades during 2024–2025, compared with USD 3 billion for new landfill cells. The Waste Management market is also seeing early pilots of autonomous side-loader trucks in California’s Central Valley, cutting driver hours by 20% and easing labor constraints. Consultants expect organics-only curbside collection to expand from 11 U.S. states in 2025 to 28 by 2030, boosting demand for composting and anaerobic digestion. Saudi Arabia’s National Waste Management Strategy mandates 85% landfill diversion by 2035, spurring build-operate-transfer deals that bundle recycling centers with energy-from-waste units. As carbon-border-adjustment mechanisms loom in Europe, exporters without credible recycling footprints may face tariffs, a risk that motivates supply-chain localization of recovery capacity.
By Waste Type: Electronic Waste Leads Multi-material Diversification
Municipal solid waste retained 46.78% of 2025 revenue, anchoring the Waste Management market, yet electronic waste is advancing at a 10.2% CAGR, the fastest among tracked streams. Shorter device replacement cycles and regulatory take-back obligations in India and Singapore are flooding dismantling centers with circuit boards containing high-value copper and gold. Apple and Dell signed multiyear contracts with U.S. recycler ERI in 2025 that guarantee closed-loop sourcing of rare earths, a template other OEMs now emulate. Battery-embedded products raise fire risks at MRFs, so operators retrofit lines with infrared sensors that detect thermal runaway, protecting staff and equipment. Parallel momentum surrounds plastic waste, where the European Union’s recycled-content targets spur pyrolysis-oil production, feeding back into virgin-quality polymer lines.
As design-for-recycling standards mature, upcoming digital product passports will log material compositions and dismantling guidance, improving recovery economics. The Waste Management market size for e-waste treatment reached an estimated USD 61 billion in 2026, and forward commitments from electronics brands suggest steady capacity utilization. Biomedical waste, though smaller in tonnage, commands premium tipping fees because autoclaving and high-temperature incineration remain mandatory, a cost hospitals pass through insurance reimbursement. Construction and demolition debris continues to benefit from green-building credits, with U.S. contractors diverting concrete for aggregate substitution on federally funded highways. Each sub-stream illustrates how regulation, technology, and end-market pull converge to reshape material flows and revenue distribution.

Geography Analysis
Asia-Pacific held 56% of 2025 global revenue, giving it the largest regional slice of the Waste Management market share and positioning it as the anchor for volume growth. China’s revised Solid Waste Law imposes fines of USD 140,000 for illegal dumping, accelerating investment in optical sorters and waste-to-energy boilers that handle rising urban tonnage. India’s Swachh Bharat Mission 2.0 disbursed USD 1.7 billion across 4,700 cities to scale source segregation and composting, while Japanese municipalities collectively target a 50% cut in final disposal by 2030, supported by mandatory take-back for textiles and smartphones. Private equity funds in Singapore are buying minority stakes in Malaysian recyclers, betting on regional logistics hubs that consolidate high-value plastics before shipment to local chemical depolymerization plants. Corporations exporting into Europe increasingly depend on compliant recovery certificates issued by licensed operators in Vietnam and Thailand, creating new revenue channels for firms that obtain both EU REACH and local permits.
The Middle East and Africa are the fastest-growing territories, expanding at a 9.1% CAGR to 2031 as sovereign wealth funds co-finance integrated waste campuses. Saudi Arabia’s USD 1.8 billion joint venture with Averda exemplifies how public capital aligns with policy mandates targeting 70% diversion by 2030. The United Arab Emirates banned single-use plastics in 2024 and now grants fee holidays to operators installing advanced material-recovery facilities in Abu Dhabi’s KEZAD zone. Egypt leverages World Bank loans to rehabilitate landfill cells and establish composting lines that process Cairo’s food waste into agricultural amendments sold under guaranteed off-take agreements. South Africa’s extended producer responsibility regulations, effective 2024, generated USD 90 million in compliance fees during their first full year, financing collection cooperatives in underserved townships.
North America and Europe remain technologically mature yet far from complacent. California and Washington State passed patchwork recycled-content statutes, prompting brand owners to lock in supply via 10-year contracts that favor U.S. recyclers offering blockchain-verified traceability. German and Dutch municipalities launched auction mechanisms where operators bid diversion percentages instead of gate-fee discounts, aligning incentives with circular-economy goals. Brazil, Chile, and Colombia trail in formal infrastructure but are closing gaps through sustainability-linked bond issuances, which subsidize fleet modernization and MRF upgrades. As legislation restricting waste exports widens, cross-border movements shrink, reinforcing regional self-sufficiency and pushing operators to optimize domestic treatment capacity.
Note: Segment shares of all individual regions available upon report purchase

Competitive Landscape
Incumbent integrators such as Veolia, Waste Management Inc., and Suez account for a combined 18% of the global Waste Management market revenue, leaving ample room for regional specialists. Their recent deals focus on vertical integration: Veolia’s USD 14.3 billion purchase of Suez’s international assets in January 2026 added chemical-recycling intellectual property and extended water-energy-waste cross-selling. Republic Services committed USD 2.1 billion for fifteen robotic MRFs, signaling confidence that premium recycled-resin contracts with consumer-goods brands will offset commodity volatility. Waste Management Inc.’s autonomous-truck pilots in Texas produced 15% fuel savings, and the firm projects a fleet turnover to semi-autonomous units by 2030. These moves tighten the technology gap that smaller haulers must bridge through partnerships or niche specialization.
Strategic investors from outside the traditional Waste Management industry are entering, attracted by renewable-fuel opportunities. Energy majors, including Shell and TotalEnergies, hold equity in waste-to-hydrogen developers that leverage gasification to supply refineries with low-carbon feedstock. Dow and Eastman Chemical signed fifteen-year offtake agreements with pyrolysis-oil producers, creating secure revenue streams that entice project financiers even amid high interest rates. Startup valuations are rising despite capital-market volatility; AMP Robotics completed a USD 400 million Series D round in mid-2025 to triple production of AI-guided sorters, and its backlog now stretches into 2028. As multinationals chase closed-loop supply chains, they increasingly demand digital ledgers that certify material flows, opening service niches for blockchain platform vendors.
Regulation also shapes rivalry. Municipal tenders in Germany now specify ISO 59020 circular-economy performance metrics, which favor bidders armed with audit-ready dashboards. Saudi Arabia’s 20-year integrated concessions require bidders to pair waste-to-energy capacity with community recycling centers, inviting consortia that bundle engineering, procurement, and finance expertise. European landfill-gas operators monetize biomethane under RED III mandates, giving them a margin buffer that pure-play MRF firms cannot access. Competitive dynamics, therefore, hinge on multi-vector diversification that couples material recovery with energy generation, data analytics, and compliance management. Operators incapable of crossing those boundaries risk relegation to low-margin collection contracts.
Waste Management Industry Leaders
Veolia Environment SA
Waste Management Inc.
Suez SA
Republic Services Inc.
Waste Connections Inc.
- *Disclaimer: Major Players sorted in no particular order

Recent Industry Developments
- January 2026: Veolia completed the USD 14.3 billion acquisition of Suez’s international waste assets, creating a USD 44 billion revenue environmental-services leader and consolidating recycling capacity across 50 countries.
- November 2025: Republic Services announced a USD 2.1 billion program to build 15 robotic and chemical-recycling facilities in the United States, backed by offtake pacts with Procter & Gamble, Unilever, and PepsiCo.
- September 2025: The Saudi Public Investment Fund and Averda formed a USD 1.8 billion venture to develop material-recovery, waste-to-energy, and landfill-gas systems in Riyadh, Jeddah, and Dammam.
- July 2025: Clean Harbors bought Stericycle’s North American medical-waste unit for USD 460 million, raising its biomedical-waste capacity 40% and adding 120 collection routes.


Research Methodology Framework and Report Scope
Market Definitions and Key Coverage
Our study defines the global waste management market as the annual revenue earned by licensed operators that collect, transport, sort, treat, recycle, and finally dispose of solid and liquid waste arising from residential, commercial, and industrial sources. Activities counted cover landfill operations, controlled incineration, material-recovery facilities, and the supporting logistics and monitoring that make these steps possible.
Scope Exclusions: Informal scavenging, on-site industrial remediation jobs, and sales of electricity or heat from waste-to-energy plants fall outside this sizing.
Segmentation Overview
- By Source
- Residential
- Commercial (retail, office, etc.)
- Industrial
- Medical (Health and Pharmaceutical)
- Construction & Demolition
- Others (institutional, agricultural, etc)
- By Service Type
- Collection, Transportation, Sorting & Segregation
- Disposal / Treatment
- Landfill
- Recycling & Resource Recovery
- Incineration & Waste-to-Energy
- Others (Chemical Treatment, Composting, etc.)
- Others (Consulting, Audit & Training, etc.)
- By Waste Type
- Municipal Solid Waste
- Industrial Hazardous Waste
- E-waste
- Plastic Waste
- Biomedical Waste
- Construction & Demolition Waste
- Agricultural Waste
- Other Specialized Waste (radio active, etc)
- By Geography
- North America
- United States
- Canada
- Mexico
- South America
- Brazil
- Argentina
- Rest of South America
- Asia-Pacific
- China
- Japan
- India
- South Korea
- ASEAN (Indonesia, Thailand, Philippines, Malaysia, Vietnam)
- Australia
- Rest of Asia-Pacific
- Europe
- United Kingdom
- Germany
- France
- Italy
- Spain
- Russia
- BENELUX (Belgium, Netherlands, and Luxembourg)
- NORDICS (Denmark, Finland, Iceland, Norway, and Sweden)
- Rest of Europe
- Middle East and Africa
- Saudi Arabia
- United Arab Emirates
- Qatar
- Turkey
- South Africa
- Egypt
- Nigeria
- Rest of Middle East and Africa
- North America
Detailed Research Methodology and Data Validation
Primary Research
Mordor analysts interviewed municipal solid-waste directors, private haulers, landfill engineers, technology vendors, and environmental regulators across North America, Europe, Asia-Pacific, and the Gulf. These conversations validated prevailing average selling prices, recovery yields, and likely policy shifts, filling gaps the public domain leaves and guiding the final triangulation.
Desk Research
We reviewed open datasets from authorities such as the World Bank, Eurostat, the US EPA, and UNEP for generation rates, tipping fees, and recycling targets. Trade bodies (ISWA, PlasticsEurope, WEEE Forum) added sector-specific insights, while company 10-Ks, bond prospectuses, and investor decks revealed service pricing and margin profiles. Paid feeds on D&B Hoovers and Dow Jones Factiva helped us triangulate contractor revenues. The sources cited illustrate our desk work and are not exhaustive.
Market-Sizing & Forecasting
A top-down build begins with country waste-generation tables multiplied by blended disposal and recycling fees. Results are then checked against sampled ASP × tonnage estimates from leading contractors to fine-tune totals. Variables that drive the model include per-capita waste output, urbanization rates, landfill tipping fees, Extended Producer Responsibility deadlines, recycled-commodity prices, and GDP growth. Multivariate regression translates each driver's projected path into volume and value forecasts, and scenario analysis tests policy-shift sensitivities.
Data Validation & Update Cycle
Outputs run through anomaly screens that flag deviations from historic elasticities, followed by two peer-review passes and senior-analyst sign-off. Reports refresh every twelve months, with interim updates issued when material regulatory or M&A events occur.
Why Mordor's Waste Management Baseline Earns Trust
Published numbers often diverge because firms adopt different waste streams, price bases, or refresh schedules. By fixing a transparent scope and refreshing annually, we limit such skews and give clients a consistent yardstick.
Key gap drivers include whether biomedical and remediation fees are bundled, how informal-sector leakage is treated, currency-year choices, and the timing of price escalators applied to landfill and recycling revenues.
Benchmark comparison
| Market Size | Anonymized source | Primary gap driver |
|---|---|---|
| 1.43 trillion | Mordor Intelligence | - |
| 1.50 trillion | Global Consultancy A | Bundles energy sales and remediation services, inflating totals |
| 1.28 trillion | Industry Association B | Uses constant-2019 pricing and omits informal-sector leakage adjustment |
These contrasts show that Mordor's clearly bounded scope, fresh pricing benchmarks, and dual-step validation deliver a balanced, traceable baseline decision-makers can rely on.


Key Questions Answered in the Report
What revenue share did Asia-Pacific capture in 2025 within the Waste Management market?
Asia-Pacific held 56% of global revenue, anchored by China and India.
Which waste stream is growing fastest worldwide?
Electronic waste is expanding at a 10.2% CAGR through 2031, driven by stricter take-back rules and shorter device lifecycles.
How large was the Waste Management market size in 2026?
The market reached USD 1.52 trillion in 2026.
Why are labor shortages a restraint on sector growth?
OECD vacancy rates above 8% push collection wages higher, compressing margins and delaying service expansion.
What technology is delivering 99% sorting purity at material-recovery facilities?
AI-guided robotic sorters from firms such as AMP Robotics and Tomra Systems achieve above-99% purity for key recyclables.
How is high interest affecting new recycling plants?
Elevated borrowing costs cut PPP closures by 25% in 2024, forcing many emerging-market projects to seek concessional finance.
Page last updated on:


