
Europe Renewable Gas Waste Feedstock Management Market Size and Share
Market Overview
| Study Period | 2020 - 2031 |
|---|---|
| Forecast Data Period | 2026 - 2031 |
| Base Year Market Size (2025) | USD 7.22 Billion |
| Market Size (2026) | USD 7.78 Billion |
| Market Size (2031) | USD 11.45 Billion |
| Growth Rate (2026 - 2031) | 8.04 % |
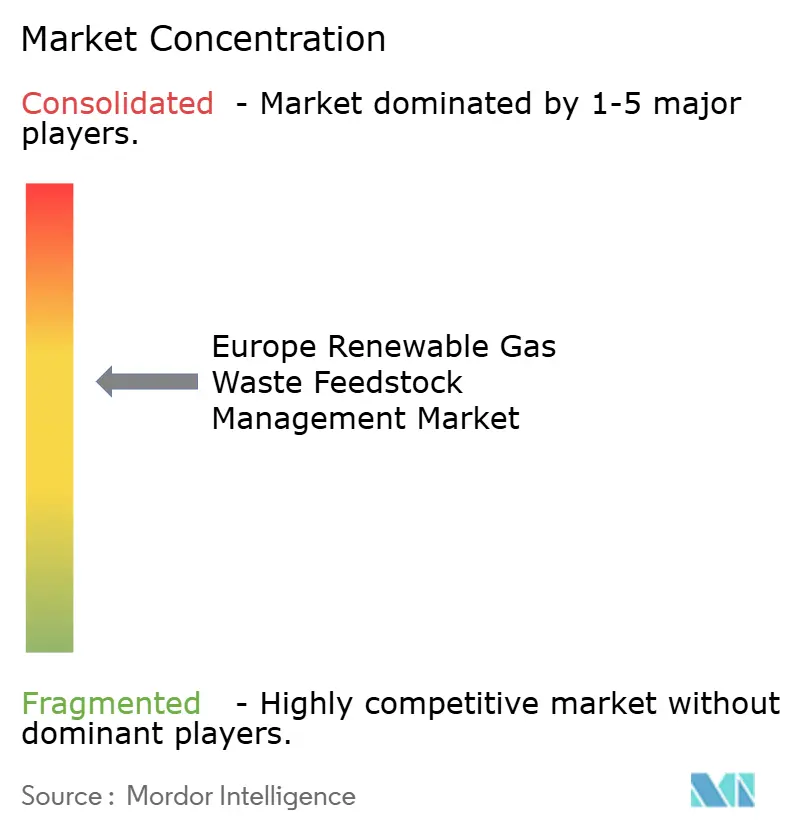
| Market Concentration | Medium |
Major Players *Disclaimer: Major Players sorted in no particular order Image © Mordor Intelligence. Reuse requires attribution under CC BY 4.0. | |
Europe Renewable Gas Waste Feedstock Management Market Analysis by Mordor Intelligence
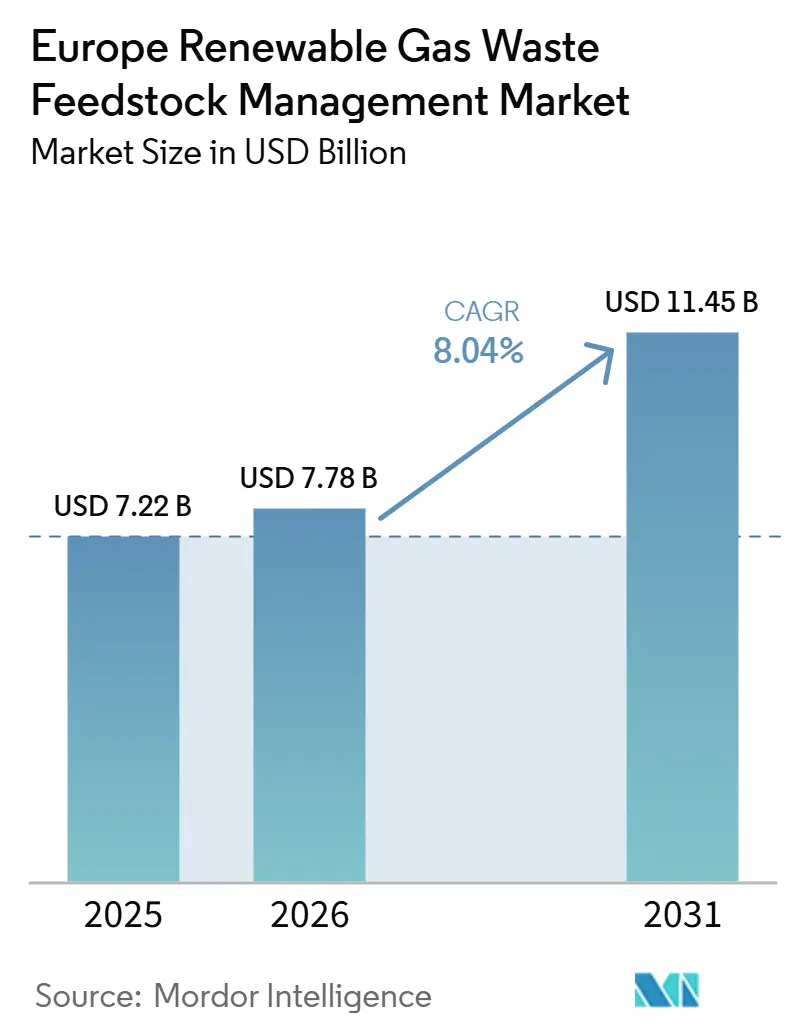
The Europe Renewable Gas Waste Feedstock Management Market size is expected to grow from USD 7.22 billion in 2025 to USD 7.78 billion in 2026 and is forecast to reach USD 11.45 billion by 2031 at 8.04% CAGR over 2026-2031.
The market is moving beyond basic waste collection toward services that provide reliable volumes, cleaner inputs, traceability, and better plant planning. Separate biowaste collection rules and tighter quality standards are making municipal organic waste more predictable for operators. The expansion of biomethane plants is increasing the need for dependable aggregation, pre-treatment, testing, and transport. Larger waste companies can use municipal contracts and existing routes to secure supply, while technology specialists focus on reducing contamination and improving yields. Investment in biomethane plants is also increasing the value of long-term feedstock arrangements, as the availability and quality of waste directly affect plant output.
Key Report Takeaways
- By feedstock type, municipal solid waste held 32.1% of the Europe renewable gas waste feedstock management market share in 2025, while food & beverage processing waste is forecast to expand at a 9.8% CAGR through 2031.
- By end-use facility type, anaerobic digestion (AD) plants accounted for 48.2% of the Europe renewable gas waste feedstock management market size in 2025, while gasification/thermal treatment facilities are projected to grow at a 10.9% CAGR through 2031.
- By service type, feedstock collection & transport accounted for 30.1% in 2025, while digital feedstock monitoring platforms are forecast to grow at a 14.1% CAGR through 2031.
Note: Market size and forecast figures in this report are generated using Mordor Intelligence’s proprietary estimation framework, updated with the latest available data and insights as of January 2026.
Europe Renewable Gas Waste Feedstock Management Market Trends and Insights
Drivers Impact Analysis*
| Driver | (~) % Impact on CAGR Forecast | Geographic Relevance | Impact Timeline |
|---|---|---|---|
| EU Landfill Diversion and Circular Economy Regulations Increase Organic Waste Collection | +2.3% | Europe, with concentrated gains in Italy, Spain, Poland, and Central and Eastern Europe | Short term (≤ 2 years) |
| Rapid Expansion of Biomethane Production Creates Strong Demand for Reliable Feedstock Supply Chains | +2.0% | France, Germany, Denmark, United Kingdom, and Netherlands | Medium term (2-4 years) |
| Public and Private Investment in Waste-to-Energy Infrastructure Accelerates Feedstock Management Modernization | +1.3% | Spain, Italy, United Kingdom, and Netherlands | Medium term (2-4 years) |
| Growing Industrial Food Waste Recovery Supports Commercial Feedstock Markets | +0.9% | United Kingdom, Germany, France, Benelux, and Nordics | Medium term (2-4 years) |
| Digital Feedstock Monitoring and AI-Based Feedstock Quality Management Improve Supply Chain Efficiency | +0.8% | United Kingdom, Germany, France, and Netherlands | Long term (≥ 4 years) |
| Increasing Agricultural Waste Utilization Improves Feedstock Diversification | +0.5% | Denmark, Germany, Sweden, France, and Netherlands | Long term (≥ 4 years) |
| Source: Mordor Intelligence | |||
EU Landfill Diversion and Circular Economy Regulations Increase Organic Waste Collection
Separate biowaste collection requirements have become a major source of new, organized feedstock volumes for the European renewable gas waste feedstock management market. Article 22 of the Waste Framework Directive has applied across EU member states since January 2024, supporting the collection of organic waste for digestion and other treatment routes. Directive (EU) 2025/1892 added food waste reduction requirements at processing and retail businesses, which can improve the quality of separated organic material. Germany’s amendment to the Bioabfallverordnung took effect in May 2025 and set a 1% limit on plastic in household biowaste, increasing the importance of sorting and pre-treatment. Countries that need stronger collection systems are likely to require new vehicles, processing capacity, and professional management services. This policy setting favors providers that can deliver consistent collection quality and volume.
Rapid Expansion of Biomethane Production Creates Strong Demand for Reliable Feedstock Supply Chains
The Europe renewable gas waste feedstock management market benefits from a rapid increase in biomethane capacity. Europe added 165 biomethane plants between 2024 and the first quarter of 2025, and installed capacity reached 8.2 bcm per year by June 2026. More plants create demand for aggregation systems that can provide stable volumes through seasonal changes. Biomethane production costs ranged from EUR 50/MWh (USD 56.43/MWh) to EUR 175/MWh (USD 197.51/MWh) in 2026, with feedstock quality, plant scale, and location shaping cost outcomes. Long-term supply contracts can reduce uncertainty for both plant owners and waste generators. Traceability requirements also make digital tracking and quality assurance more important across the supply chain.[1]
Public and Private Investment in Waste-to-Energy Infrastructure Accelerates Feedstock Management Modernization
Public finance and private capital are funding assets that depend on organized feedstock management. The European Investment Fund committed EUR 200 million (USD 225.73 million) to Copenhagen Infrastructure Partners’ Advanced Bioenergy Fund II in May 2026 for projects in Denmark, Ireland, Spain, Belgium, and Finland. The European Investment Bank also provided EUR 225 million (USD 253.95 million) to Iren in 2026 for municipal waste infrastructure, collection vehicles, and recycling centers in Italy. These projects increase the need for collection routes, transfer capacity, and dependable pre-treatment. The Netherlands’ EemsGas project combines EUR 149.8 million (USD 169.07 million) in SDE++ operating support with EUR 100 million (USD 112.86 million) in private investment for biomass gasification. Capital is therefore being deployed to both the biomethane plants and the upstream systems that prepare their inputs.
Growing Industrial Food Waste Recovery Supports Commercial Feedstock Markets
Commercial food processors are becoming more active suppliers to the Europe renewable gas waste feedstock management market. Food waste targets and disposal costs encourage businesses to separate materials with higher energy value, including fats, oils, grease, spent grains, and off-specification products. Bio Capital began using analytics with Entopy in May 2025 and reported 85% accuracy in biogas-yield prediction within 5 weeks. This information can help operators value waste streams according to expected yield rather than weight alone. Digital tools can also support better blending decisions and help prevent poor-quality material from reaching digesters. Agricultural residues offer additional supply options, especially when operators can build efficient manure and slurry collection networks.
Restraints Impact Analysis*
| Restraint | (~) % Impact on CAGR Forecast | Geographic Relevance | Impact Timeline |
|---|---|---|---|
| Feedstock Quality Variability Reduces Biomethane Yield and Process Stability | -1.8% | Germany, United Kingdom, France, Italy, and Poland | Short term (≤ 2 years) |
| Rising Collection, Transportation, and Logistics Costs Reduce Feedstock Margins | -1.4% | Nordic countries, Germany, United Kingdom, and Benelux | Medium term (2-4 years) |
| Competition for Organic Waste Feedstocks Intensifies Across Multiple End Markets | -0.8% | Netherlands, Germany, Denmark, and Sweden | Medium term (2-4 years) |
| Complex Cross-Border Waste Transport Regulations Limit Feedstock Optimization | -0.5% | Central and Eastern Europe and Nordic-to-continental flows | Short term (≤ 2 years) |
| Source: Mordor Intelligence | |||
Feedstock Quality Variability Reduces Biomethane Yield and Process Stability
Feedstock quality remains a key constraint for the European renewable gas waste feedstock management market. Municipal waste, manure, sewage sludge, and industrial residues differ in methane potential, moisture content, contaminants, and handling requirements. More facilities are blending several categories of waste, which can improve supply resilience but also increases the need for consistent testing and pre-treatment. Installed capacity utilization averaged 70% at existing facilities, with supply interruptions and inconsistent material quality contributing to the gap. Competition for high-yield organic material can further limit access for smaller operators. Operators without strong quality controls face higher treatment costs, lower yields, and less reliable gas output.
Rising Collection, Transportation, and Logistics Costs Reduce Feedstock Margins
Collection and transport costs can limit the economics of the Europe renewable gas waste feedstock management market, especially for low-density materials such as manure. Transport is one of the main drivers behind the EUR 50/MWh (USD 56.43/MWh) to EUR 175/MWh (USD 197.51/MWh) range of reported biomethane production costs in Europe. France’s Court of Auditors reported in 2025 that feedstock supply represented 1/6 of biomethane production costs in the country. Small rural operators face additional pressure because digestants often require a return journey after delivery. Cross-border shipments also require more notification and traceability under Regulation (EU) 2024/1157. These conditions favor dense regional networks and contracts that reduce the distance between waste sources and treatment facilities.
*Our forecasts treat driver/restraint impacts as directional, not additive. The impact forecasts reflect baseline growth, mix effects, and variable interactions.
Segment Analysis
By Feedstock Type: Organic Waste Complexity Reshapes Sourcing Priorities
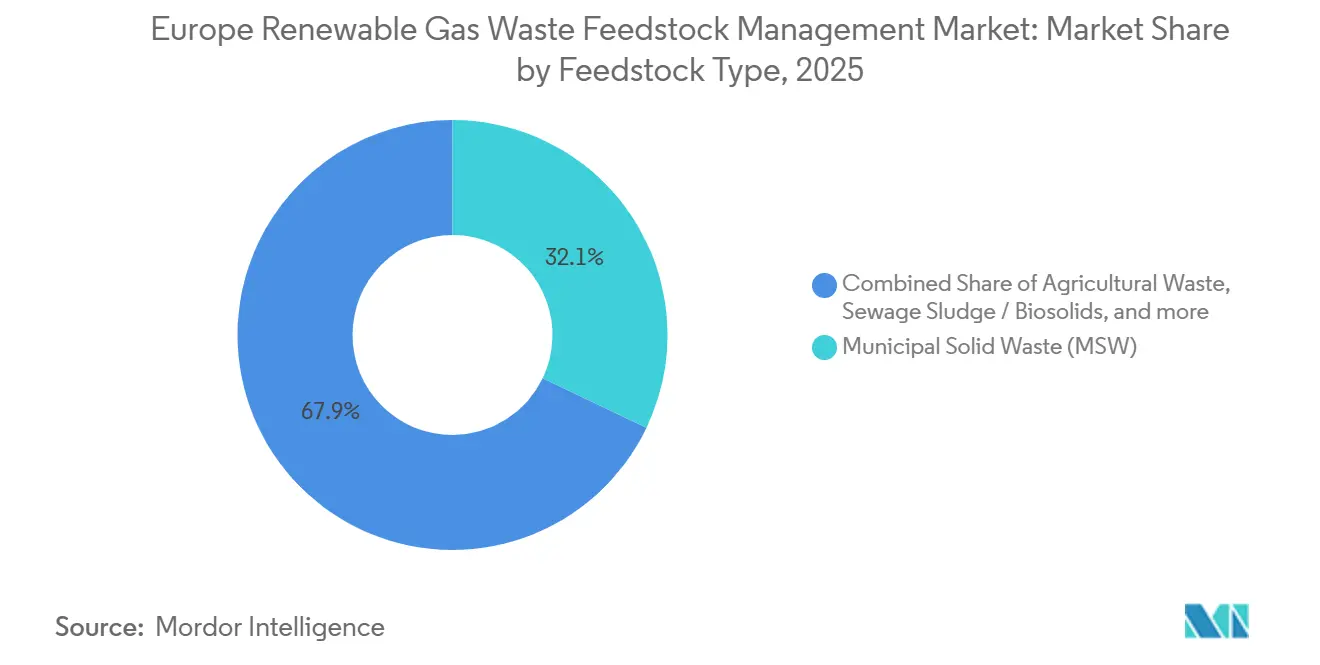
Municipal solid waste accounted for 32.1% of the Europe renewable gas waste feedstock management market because municipal systems provide consistent collection volumes. Publicly financed collection routes and transfer networks give this stream a reliable operating base. Tipping-fee income can help make municipal collection economically sustainable for service providers. Agricultural waste was the fastest-growing feedstock category, and manure and slurry accounted for 60% of the input materials processed at European anaerobic digestion plants in 2024. Policy support for waste and residue inputs has encouraged new plants to use agricultural residues and organic waste rather than energy crops. This change increases the need for farm-level aggregation, seasonal planning, and suitable transport arrangements. Sewage sludge and biosolids remain established feedstock streams because wastewater plants need to recover more energy from their operations. SUEZ built more than 85% of France’s sewage sludge anaerobic digestion capacity, and its Digelis Fast technology at Seine Aval reduced the number of digesters from 26 to 11 while maintaining equivalent biogas output.
Food and beverage processing waste emerged as the fastest-growing segment with 9.8% CAGR through 2031, offering strong biogas potential per ton, particularly for fats, oils, and grease. These materials can support long-term contracts because their composition is more predictable than mixed municipal waste. Industrial waste from breweries and paper mills is also commercially attractive, as high-purity organic loading reduces the need for pretreatment. The Europe renewable gas waste feedstock management industry is therefore moving toward diversified supply portfolios rather than reliance on a single waste stream.

By End-Use Facility Type: AD Infrastructure Anchors Demand While Gasification Scales
Anaerobic digestion plants held 48.2% of the Europe renewable gas waste feedstock management market because they accept a wide range of wet organic inputs. At least 86% of Europe’s 1,678 operational biomethane plants were connected to the gas grid by the first quarter of 2025. This installed base supports long-term demand for feedstock that has been collected, tested, and prepared. Digestate adds value because it can substitute for mineral fertilizer. Digestate replaced 17% of EU nitrogen fertilizer requirements in 2024, which improves the economics of organic waste management. The scale of the AD fleet also makes reliable feedstock supply a central operating requirement.[2]
Gasification and thermal treatment facilities were the fastest-growing segment, registering a 10.9% CAGR through 2031 because they can process dry residues, waste wood, and refuse-derived fractions. EemsGas in the Netherlands received EUR 149.8 million (USD 169.07 million) in operating support for a waste-wood biomethane facility planned to begin commercial operations in 2029. This project shows how thermochemical processes can extend use beyond feedstocks suited to wet digestion. Landfill gas recovery continues to serve existing sites where methane capture and asset economics support continued operations. Wastewater co-digestion is important in Norway, where 85% of biomethane plants use sewage sludge as the primary feedstock. The Europe renewable gas waste feedstock management industry must therefore support both mature digestion assets and newer thermal conversion routes.
By Service Type: Logistics Dominates Revenue While Digital Platforms Reshape Margins
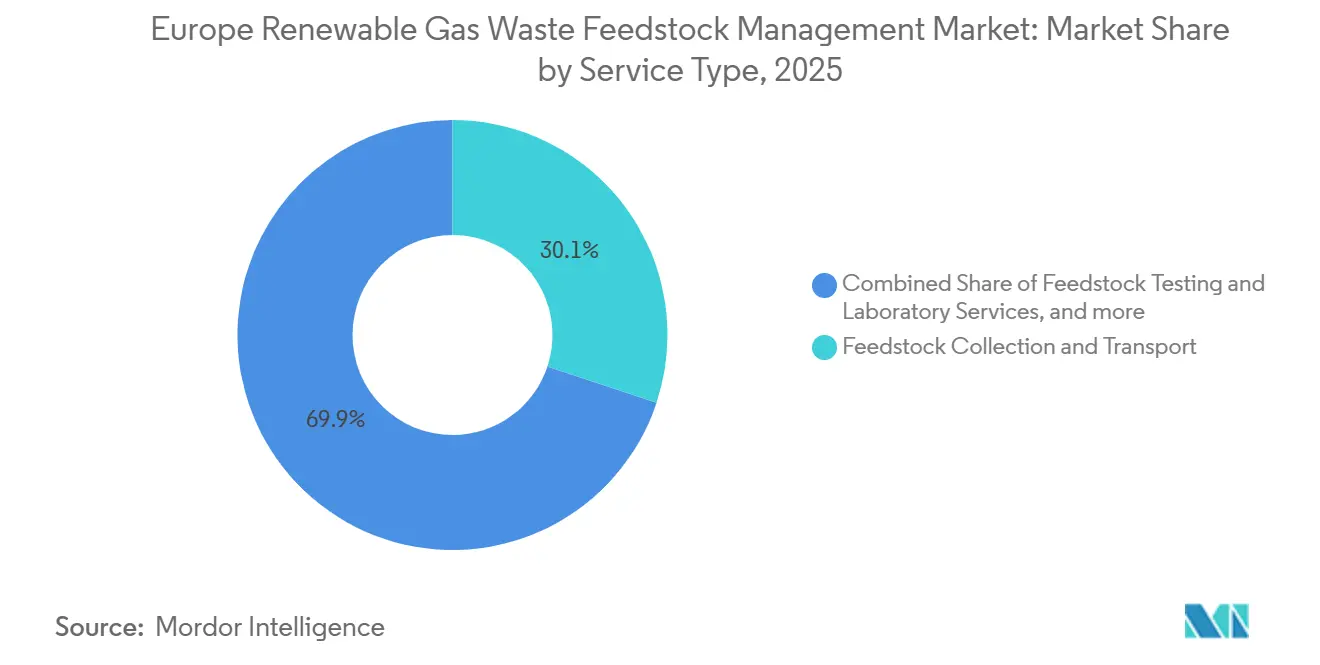
Feedstock collection and transport accounted for 30.1% of the Europe renewable gas waste feedstock management market because it requires fleets, transfer stations, and pre-treatment capacity. Companies with dense municipal routes can spread vehicle and labor costs across larger volumes. Their existing waste contracts also offer early access to organic material before it is available to independent operators. Testing and laboratory services support procurement decisions by measuring biochemical methane potential and contaminant levels. Quality assurance helps ensure feedstock consistency and regulatory compliance before processing. Supply chain management and consultancy are also needed by new biomethane investors who lack experience in sourcing organic waste.
Digital feedstock monitoring platforms were the fastest-growing service category, registering a 14.1% CAGR, because traceability is increasingly linked to certification and plant control. Carbon AMS reported that its live optimization deployment at an Irish anaerobic digestion facility could support annual operating value across Europe’s estimated 20,000 digesters if widely replicated. Real-time information helps operators compare material quality, manage blending, and plan deliveries. It can also reduce the risk of accepting inputs that lower gas yield or disrupt a digester. Smaller facilities may need to rely on external service providers because they lack internal monitoring capabilities. The Europe renewable gas waste feedstock management market therefore provides digital providers with an opportunity to improve compliance and operational performance without owning collection fleets.
Geography Analysis
Germany had the largest biogas production volume in Europe at 100 TWh, supporting substantial demand in the Europe renewable gas waste feedstock management market. Its agricultural feedstock system is concentrated in Bavaria, Lower Saxony, and North Rhine-Westphalia. France had Europe’s highest plant count, with 731 facilities in 2025, surpassing Germany’s. The French base is mainly composed of smaller agricultural facilities. The United Kingdom began mandatory household food and garden waste collection in March 2026, widening the available supply base for AD operators. Italy’s national support program is encouraging new AD capacity and supply agreements. At the same time, the Cobirgy project in Spain is designed to process up to 500,000 tons of agricultural and industrial organic waste each year at full capacity.
Spain, Benelux, and the Nordic countries form a second group of important locations for the Europe renewable gas waste feedstock management market. The European Investment Bank and Santander provided EUR 224 million (USD 252.82 million) to Greene in July 2025 for 5 Spanish waste-conversion plants that will be commissioned from 2026 to 2029. The Netherlands is developing the EemsGas project and has a national blending obligation that supports biomethane demand. Belgium benefits from dense population centers and industrial food-processing clusters. Denmark’s plants averaged 1,468 Nm³/h per site, compared with a European average of 483 Nm³/h, resulting in large feedstock requirements at individual facilities. Gasum’s Swedish construction program is increasing demand for logistics services for agricultural residues and manure in the region.
Poland’s Polska Grupa Biogazowa operated 20 units with a 450 GWh equivalent biomethane capacity following its September 2025 joint venture transaction. The company is targeting 2 TWh by 2030, which will require more structured collection and aggregation services. Poland injected its first biomethane into the grid in 2025.[3] Ireland, Portugal, and Central and Eastern European countries are developing collection regimes that could reward early infrastructure investment. These locations offer opportunities for operators that can build collection capacity before local markets become crowded.
Competitive Landscape
The Europe renewable gas waste feedstock management market exhibits a medium level of market concentration, with competition among integrated waste management companies, specialised feedstock technology providers, and energy companies investing in biomethane supply chains. Established waste management companies such as Veolia, SUEZ, and REMONDIS leverage extensive municipal collection networks, long-term public contracts, and pre-treatment infrastructure to secure reliable organic waste volumes. In parallel, specialised technology providers, including BTA International and Tiger Depack, differentiate themselves through advanced pre-treatment, contamination removal, and feedstock quality enhancement solutions. While energy companies such as ENGIE, TotalEnergies, Shell, and Eni (Plenitude) are not traditional feedstock management providers, they are strengthening competition through investments in biomethane production, feedstock sourcing, and long-term supply and off-take agreements. As a result, competition is increasingly driven by secure feedstock access, integrated service capabilities, and digital quality management rather than collection scale alone. Although the market demonstrates medium concentration, the combined market share of leading participants has not been disclosed.
Strategic investments continue to strengthen competitive positioning across the value chain. SUEZ acquired a 51% controlling stake in ARA Cursus in Poland and announced investments in biomethane infrastructure, expanding its presence in an emerging feedstock market. Gasum is investing more than EUR 1 billion in large-scale Swedish biogas plants, integrating feedstock sourcing, logistics, plant operations, and gas marketing to improve supply security. Similarly, ENGIE, TotalEnergies, and Shell continue to expand their biomethane portfolios through long-term feedstock partnerships and renewable gas projects, increasing competition for reliable organic waste streams.
Long-term commercial agreements are becoming an important competitive differentiator. For example, ENGIE's biomethane purchase agreement with PepsiCo UK supports investment in new anaerobic digestion capacity while securing long-term feedstock demand. TotalEnergies has also expanded its biomethane production footprint through new facilities in France. Meanwhile, smaller and regional service providers continue to compete by offering specialised capabilities such as co-digestion advisory, feedstock testing, laboratory services, digital monitoring, and quality assurance. As renewable gas capacity expands across Europe, providers with strong feedstock sourcing capabilities, integrated service offerings, and long-term contractual relationships are expected to maintain a competitive advantage.
Europe Renewable Gas Waste Feedstock Management Industry Leaders
-
Veolia Environnement S.A.
-
Shell plc, including Nature Energy
-
ENGIE SA
-
SUEZ S.A.
-
TotalEnergies SE
- *Disclaimer: Major Players sorted in no particular order
Recent Industry Developments
- July 2026: EBA and GIE release the European Biomethane Map 2026, reporting that installed biomethane production capacity reached 8.2 bcm/year by June 2026, a 17% increase over the prior-year period, with investment commitments rising to EUR 36 billion (USD 40.63 billion), signaling accelerating demand for feedstock supply chain services across Europe.
- May 2026: European Investment Fund commits EUR 200 million (USD 225.73 million) to Copenhagen Infrastructure Partners' Advanced Bioenergy Fund II, targeting greenfield biomethane projects in Denmark, Ireland, Spain, Belgium, and Finland, focused on transforming manure and agricultural residues into biomethane.
- May 2025: Bio Capital (UK) partners with Entopy to deploy AI-based feedstock analytics across its food waste AD sites, achieving 85% accuracy in biogas yield prediction within 5 weeks and targeting 95% accuracy, in what is described as a first for the United Kingdom’s AD sector.
Europe Renewable Gas Waste Feedstock Management Market Report Scope
The Europe Renewable Gas Waste Feedstock Management Market Report is Segmented by Feedstock Type (Municipal Solid Waste, Agricultural Waste, and More), by End-Use Facility Type (Anaerobic Digestion (AD) Plants, Landfill Gas Recovery Sites, and More), and by Service Type (Feedstock Collection & Transport, Feedstock Testing & Laboratory Services, and More). The Market Forecasts are Provided in Terms of Value (USD).
| Municipal Solid Waste (Organic Fraction / Source-Separated) |
| Agricultural Waste (Manure, Slurry, Crop Residues) |
| Sewage Sludge / Biosolids |
| Food & Beverage Processing Waste (FOG, Spent Grains, Off-Spec Product) |
| Industrial Organic Waste (Breweries, Paper Mills, Pharma Effluent) |
| Others |
| Anaerobic Digestion (AD) Plants |
| Landfill Gas Recovery Sites |
| Gasification / Thermal Treatment Facilities |
| Wastewater Treatment Plants (Co-Digestion) |
| Others (Pyrolysis, Hydrothermal) |
| Feedstock Collection & Transport |
| Feedstock Testing & Laboratory Services |
| Feedstock Quality Assurance |
| Digital Feedstock Monitoring Platforms |
| Feedstock Supply Chain Management & Consultancy |
| By Feedstock Type | Municipal Solid Waste (Organic Fraction / Source-Separated) |
| Agricultural Waste (Manure, Slurry, Crop Residues) | |
| Sewage Sludge / Biosolids | |
| Food & Beverage Processing Waste (FOG, Spent Grains, Off-Spec Product) | |
| Industrial Organic Waste (Breweries, Paper Mills, Pharma Effluent) | |
| Others | |
| By End-Use Facility Type | Anaerobic Digestion (AD) Plants |
| Landfill Gas Recovery Sites | |
| Gasification / Thermal Treatment Facilities | |
| Wastewater Treatment Plants (Co-Digestion) | |
| Others (Pyrolysis, Hydrothermal) | |
| By Service Type | Feedstock Collection & Transport |
| Feedstock Testing & Laboratory Services | |
| Feedstock Quality Assurance | |
| Digital Feedstock Monitoring Platforms | |
| Feedstock Supply Chain Management & Consultancy |
Key Questions Answered in the Report
How large is the Europe renewable gas waste feedstock management market?
The sector was valued at USD 7.22 billion in 2025 and is projected to reach USD 11.45 billion by 2031, growing at an 8.04% CAGR. The forecast reflects growing demand for reliable organic waste flows, operating services, and supply assurance.
What is driving demand for renewable gas waste feedstock management in Europe?
Separate biowaste collection rules, new biomethane capacity, and waste-to-energy investment are expanding demand for collection, testing, and pre-treatment. The need for reliable, traceable inputs also supports longer-term supplier arrangements.
Which feedstock is most important for European biomethane plants?
The organic fraction of municipal solid waste was the largest feedstock category, while agricultural waste was the fastest-growing category. Manure and slurry accounted for 60% of inputs at European AD plants in 2024, underlining their importance to new residue-based projects.
Why are digital monitoring platforms gaining adoption at AD facilities?
Digital platforms support traceability, quality assessment, material blending, and delivery planning, thereby improving plant reliability and compliance with certification requirements. They help operators identify lower-value inputs before those materials affect throughput or gas yield.
What limits the growth of feedstock management services in Europe?
Variability in waste quality, competition for high-yield inputs, transport costs, and cross-border waste rules can raise costs and reduce plant utilization. These factors are most difficult for smaller operators without dense collection networks or specialized pre-treatment capacity.
Which European countries offer the strongest opportunities for operators?
Germany, France, the United Kingdom, Italy, Spain, the Nordics, Poland, Ireland, and Portugal offer opportunities through plant capacity, collection mandates, or developing infrastructure. The most suitable approach depends on local waste availability, contract structures, and transport distances.