Renewable Gas From Waste Market Size and Share
Market Overview
| Study Period | 2020 - 2031 |
|---|---|
| Market Size (2026) | USD 20.34 Billion |
| Market Size (2031) | USD 31.42 Billion |
| Growth Rate (2026 - 2031) | 9.09% CAGR |
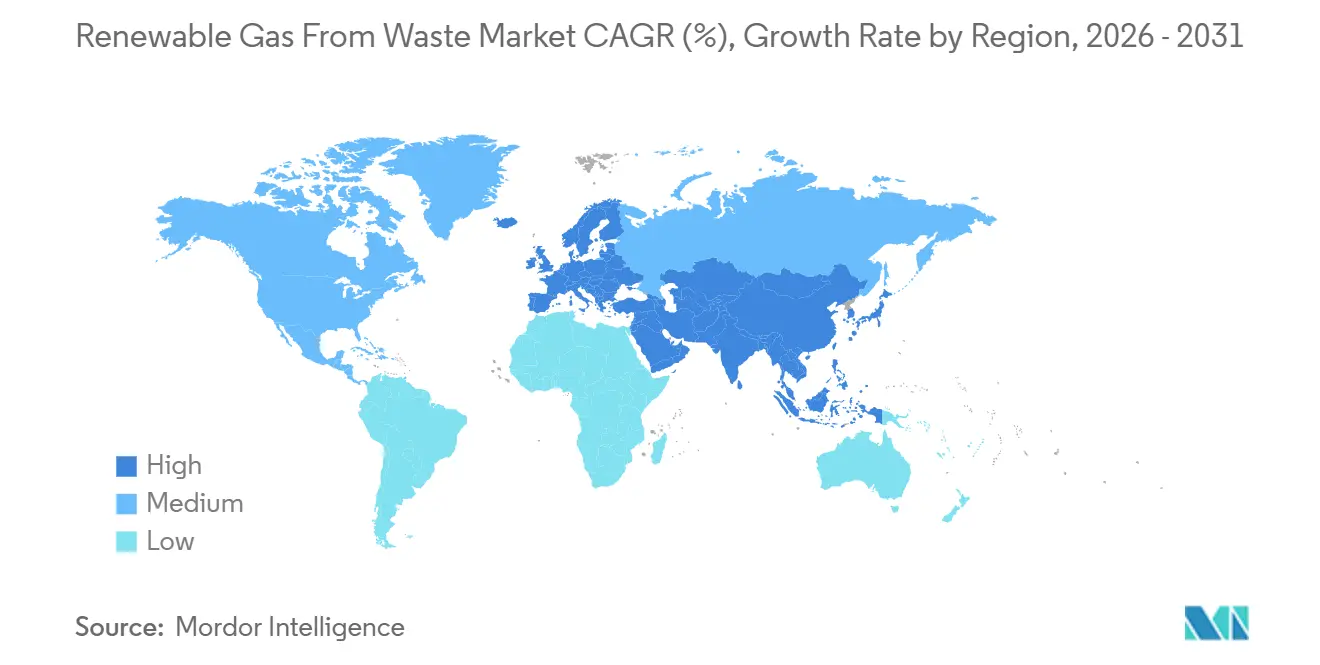
| Fastest Growing Market | Asia-Pacific |
| Largest Market | Europe |
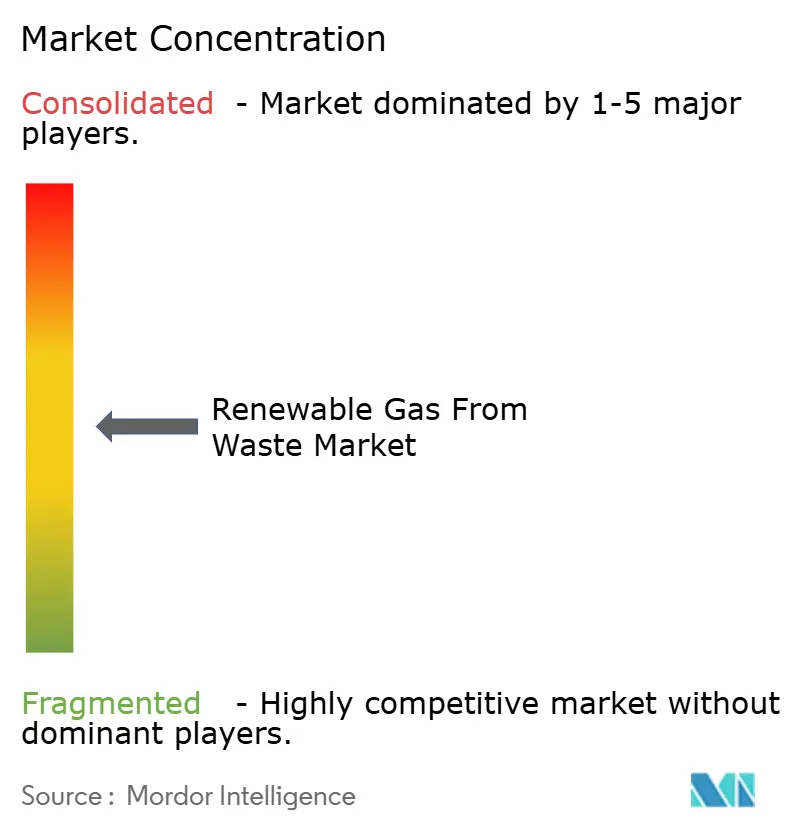
| Market Concentration | Medium |
Major Players *Disclaimer: Major Players sorted in no particular order Image © Mordor Intelligence. Reuse requires attribution under CC BY 4.0. | |
Renewable Gas From Waste Market Analysis by Mordor Intelligence
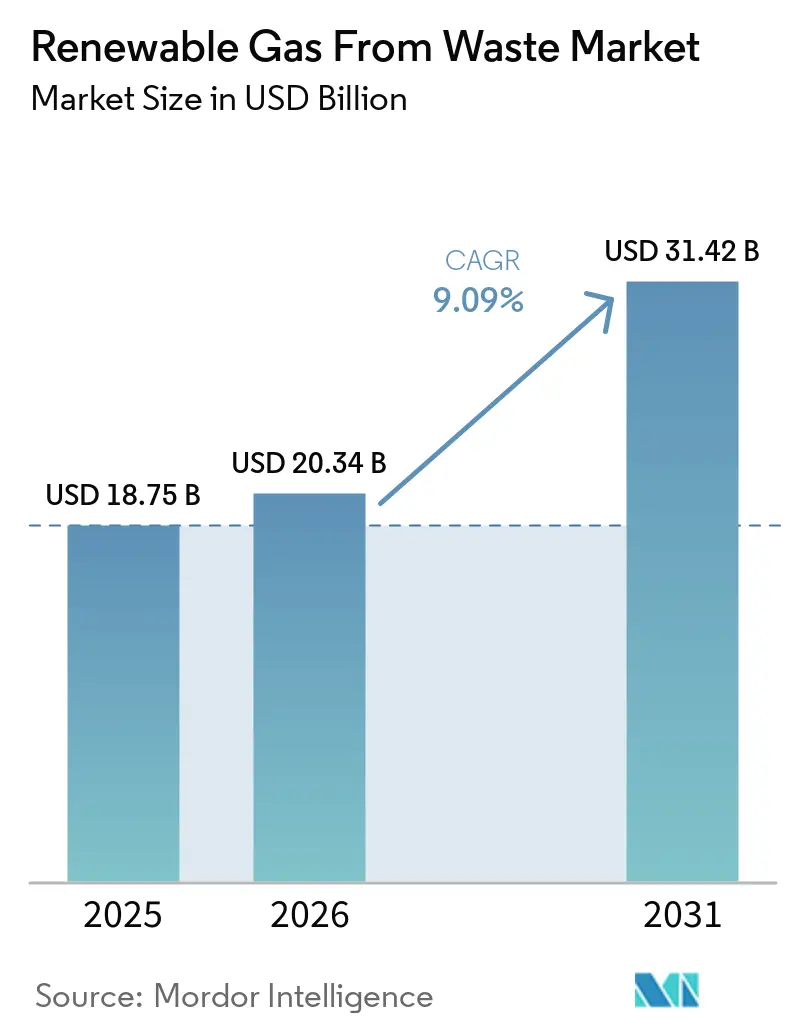
The Renewable Gas From Waste Market size was valued at USD 18.75 billion in 2025 and is estimated to grow from USD 20.34 billion in 2026 to reach USD 31.42 billion by 2031, at a CAGR of 9.09% during the forecast period (2026-2031).
The renewable gas from waste market is supported by tighter methane-emission rules, larger subsidy pools in the United States and the European Union, and stronger fuel demand from heavy-duty fleets moving away from diesel toward renewable natural gas. According to industry reports, biogas investments in the United States increased significantly in 2025, supported by landfill and agricultural RNG projects. Demand remains most concentrated in North America and Western Europe because policy frameworks there provide multi-year revenue clarity, while Asia-Pacific is moving faster as urban waste volumes rise with continued urbanization. The renewable gas from waste market also reflects a technology shift toward higher-value upgrading systems and a feedstock shift toward food waste and dairy manure, even as landfill feedstock pressure and uneven regulation raise execution risk for single-pathway developers.
Key Report Takeaways
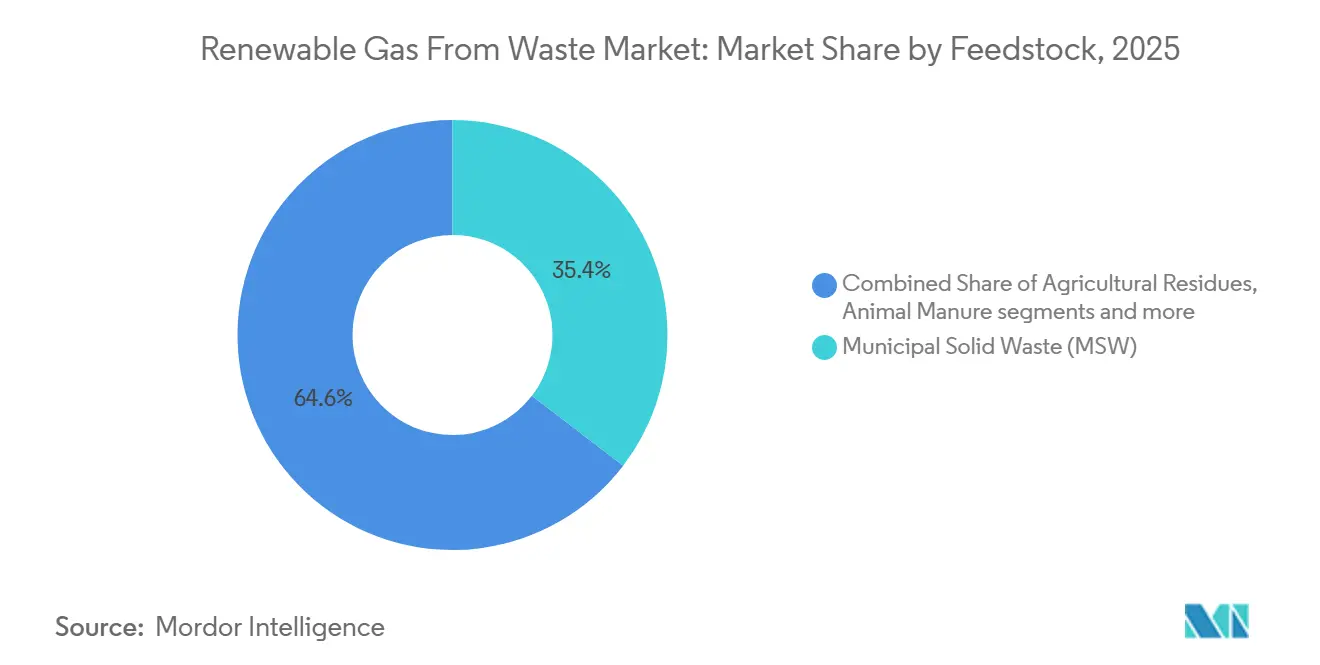
- By feedstock type, municipal solid waste held 35.4% of the renewable gas from waste market share in 2025, while food waste is forecast to expand at a 10.2% CAGR through 2031.
- By technology type, anaerobic digestion accounted for 44.1% of the renewable gas from waste market size in 2025, while biogas upgrading systems are projected to grow at an 11.1% CAGR through 2031.
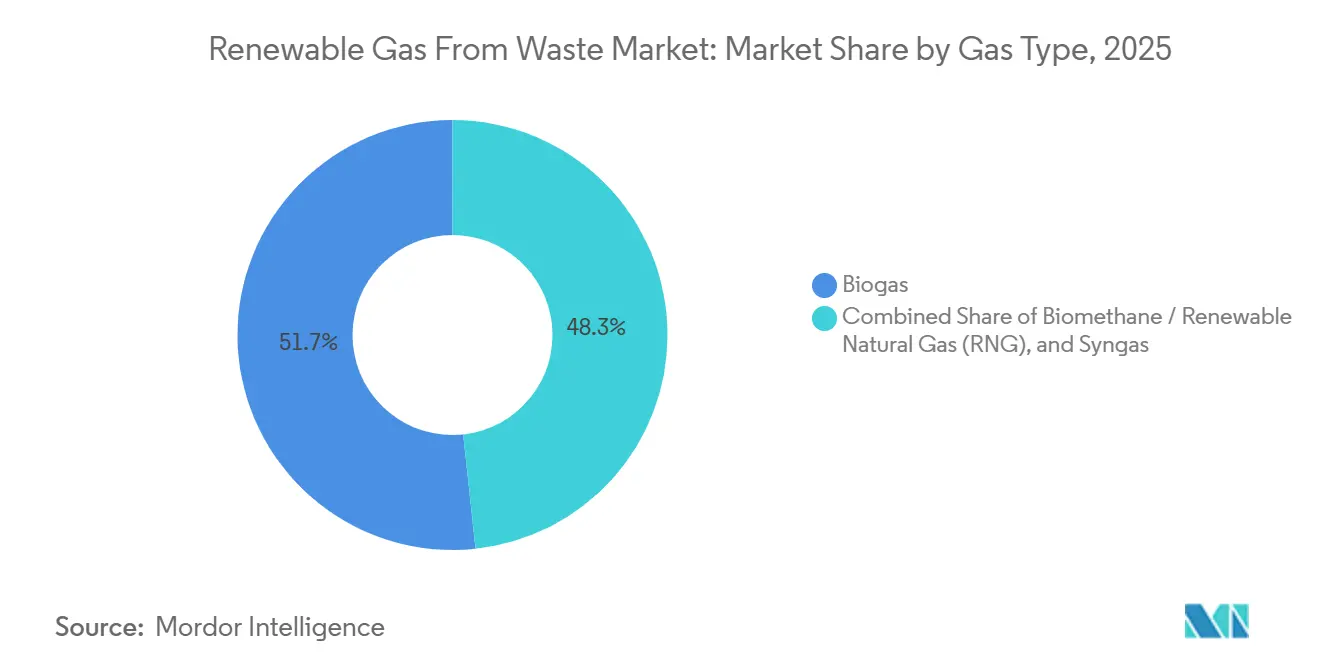
- By gas type, biogas accounted for 51.7% in 2025, while biomethane / renewable natural gas is forecast to grow at a 13.1% CAGR through 2031.
- By application type, electricity generation captured 34.8% of the application mix in 2025, while transportation fuel is projected to expand at a 12.6% CAGR through 2031.
- By component, gas processing and upgrading units held 30.75% of the renewable gas from waste market share in 2025, while monitoring and control systems are projected to expand at a 10.4% CAGR through 2031.
- By geography, Europe held 38.5% of the renewable gas from waste market share in 2025, while Asia-Pacific is projected to record the highest CAGR at 13.6% through 2031.
Note: Market size and forecast figures in this report are generated using Mordor Intelligence’s proprietary estimation framework, updated with the latest available data and insights as of January 2026.
Global Renewable Gas From Waste Market Trends and Insights
Drivers Impact Analysis*
| Driver | (~) % Impact on CAGR Forecast | Geographic Relevance | Impact Timeline |
|---|---|---|---|
| Government Incentives Like RFS, LCFS, and Biomethane Tariffs are Increasing | +2.0% | North America as the primary market, Europe as the secondary market, with spillover into Asia-Pacific | Short term (≤ 2 years) |
| Strict Methane-Emission Rules and Landfill-Gas Mandates Drive LFG-To-Energy Projects | +1.8% | Global, with the strongest enforcement in North America and Europe | Medium term (2-4 years) |
| Corporate Decarbonization Pledges Boost Demand for Low-Carbon RNG | +1.4% | Global, with early traction in Europe, the United Kingdom, and North America | Medium term (2-4 years) |
| The Heavy-Duty Transport Sector Shifts to CNG and LNG Fueled by Landfill RNG | +1.0% | North America is the dominant market, Europe is emerging market | Medium term (2-4 years) |
| Urbanization and Rising Food Waste Availability | +0.8% | Global, with the highest impact in Asia-Pacific and South America | Long term (≥ 4 years) |
| Advances in Biogas Upgrading Yield and Gas Quality | +0.6% | Global | Medium term (2-4 years) |
| Source: Mordor Intelligence | |||
Government Incentives Like RFS, LCFS, and Biomethane Tariffs are Increasing
Government policy remains the clearest form of commercial support for the renewable gas from waste market, as it provides developers with a revenue base that lenders can underwrite. The United States EPA finalized its Set 2 Renewable Fuel Standard rule in March 2026 and set cellulosic biofuel obligations at 1.36 billion Renewable Identification Numbers (RINs) for 2026 and 1.43 billion RINs for 2027, keeping regulatory focus on biogas-derived pathways.[1]Source: United States Environmental Protection Agency, “Set 2 Rule Detailed Fact Sheet,” United States Environmental Protection Agency, epa.gov That decision matters because renewable electricity was excluded from those qualifying volumes, which keeps D3 renewable identification number demand more concentrated on landfill-gas and anaerobic-digestion RNG projects. California also strengthened project visibility when its updated Low Carbon Fuel Standard (LCFS) rules took effect on July 1, 2025, and extended book-and-claim accounting for biomethane used in linear generators for EV charging through 2035.[2]California Air Resources Board, “2025 LCFS Amendment Implementation FAQ,” California Air Resources Board, arb.ca.gov In Europe, REPowerEU continues to support the 35 bcm annual biomethane target for 2030, and the European Commission estimates cumulative investment needs at EUR 37 billion (USD 40 billion), keeping the renewable gas from waste market aligned with a large public policy build-out agenda.[3]European Commission, “Biomethane,” European Commission Energy, energy.ec.europa.eu
Strict Methane-Emission Rules and Landfill-Gas Mandates Drive LFG-To-Energy Projects
Methane regulation is turning landfill gas capture from a voluntary environmental measure into a direct investment trigger in the renewable gas from waste market. The EPA Greenhouse Gas Reporting Program tracked 1,287 municipal solid waste and industrial waste landfills in 2023, and 83% of those sites were still actively receiving waste, leaving a large monitored base for further compliance activity. The American Biogas Council reported that 470 United States landfills are still flaring gas that could instead be converted into RNG, representing 1,322,000 scfm of untapped capture potential. As collection rules tighten, more operators are likely to favor RNG upgrades over simple flaring or direct combustion, since captured gas is more valuable when linked to transport and grid pathways.
Corporate Decarbonization Pledges Boost Demand for Low-Carbon RNG
Corporate off-take contracts are becoming a financing tool for the renewable gas from waste market, especially in Europe, where buyers are now signing long-duration biomethane purchase agreements. BASF and ENGIE signed a 7-year agreement in July 2024 covering 2.7 to 3.0 TWh of biomethane, one of the largest industrial biomethane transactions in the European chemical sector. Sanofi signed a 6-year agreement with ENGIE for 1.3 TWh, and ENGIE also signed a 10-year contract with PepsiCo UK for 60 GWh per year from a new anaerobic digestion plant backed by a GBP 70 million (USD 89 million) investment. Arkema added another example in March 2025 when it signed an 8-year biomethane supply agreement with ENGIE for 25 GWh per year across 4 French manufacturing sites. These agreements reduce demand risk for new projects by providing buyer commitment to debt financing before the facility reaches full output. The result is that corporate procurement is no longer only a sustainability signal; it is helping shape capacity expansion in the renewable gas from waste market.
The Heavy-Duty Transport Sector Shifts to CNG and LNG Fueled by Landfill RNG
Heavy-duty transportation is now one of the most important demand channels for the renewable gas from waste market in North America. The Transport Project reported in May 2026 that 94% of all on-road natural gas fuel used in the United States in 2025 was RNG, equal to 755 million gasoline-gallon equivalents. That volume was 13% higher than in 2024, confirming that fleets are using more renewable fuel rather than simply switching to engine technology. The transport pull matters because it gives upgraded gas a clearer price premium than many direct-combustion uses, especially where environmental credits can be stacked on top of fuel sales. As more freight operators adopt RNG-backed fueling strategies, the renewable gas from waste market gains a stronger commercial case for new upgrading systems tied to landfill and digestion assets.
Restraints Impact Analysis*
| Restraint | (~) % Impact on CAGR Forecast | Geographic Relevance | Impact Timeline |
|---|---|---|---|
| High Capital Requirements for LFG systems, Upgrading Plants, and Pipeline Connections | -1.8% | Global | Short term (≤ 2 years) |
| Inconsistent Regulations and Subsidies Create Market Fragmentation | -1.4% | Europe is the primary market, with wider global relevance | Medium term (2-4 years) |
| Declining Landfill Gas Yields as Diversion and Recycling Improve | -1.0% | North America and Northern Europe | Long term (≥ 4 years) |
| Technical issues, including Siloxane Contamination, Hydrogen Sulfide Removal, and Gas Variability | -0.7% | Global, especially in wastewater and municipal solid waste streams | Medium term (2-4 years) |
| Source: Mordor Intelligence | |||
High Capital is Required for LFG Systems, Upgrading Plants, and Pipeline Connections
Capital intensity remains a major barrier to the renewable gas from waste market, especially for projects that require new collection systems, gas-cleaning equipment, and pipeline connections. The American Biogas Council estimated that a full build-out of the United States biogas capture potential would require USD 450 billion in capital across candidate landfills, food waste facilities, farms, and wastewater sites. That scale of spending explains why developers continue to focus on sites with better existing infrastructure, stronger carbon-credit economics, or long-term off-take agreements. Pipeline interconnection also adds uncertainty because costs vary with distance from the network, utility gas specifications, and metering requirements, making site selection a financial issue from the start. This financing burden slows project formation in the renewable gas from waste market, particularly for independent developers without a large balance sheet or a portfolio partner.
Inconsistent Regulations and Subsidies Create Market Fragmentation
Regulatory fragmentation raises both compliance costs and execution risk in the renewable gas from waste market. Germany clearly shows the issue, as the proposed amendment to the EnWG would limit guaranteed gas network access for biomethane plants to 10 years, even though many projects require much longer payback periods. Dena reported in its Branchenbarometer Biomethan 2025 that market conditions fell to their lowest level since the survey began, with policy uncertainty, low gas prices, and distortions from insolvencies weighing on investment sentiment. The EU has moved to improve access through Directive 2024/1788, but implementation still varies across member states, leaving project developers to manage an uneven regulatory landscape. The IEA (International Energy Agency) also noted that the absence of harmonized biomethane sustainability certification continues to limit cross-border trading and keeps environmental attributes from moving easily between the United States RFS, California LCFS, and EU RED III systems.
*Our forecasts treat driver/restraint impacts as directional, not additive. The impact forecasts reflect baseline growth, mix effects, and variable interactions.
Segment Analysis
By Feedstock: MSW Anchors Installed Volumes, While Food Waste Attracts New Investment.
Municipal solid waste held the largest share at 35.4% in 2025, remaining at the core of the installed feedstock supply for the renewable gas from waste market. That position came from three durable advantages: regulated landfill infrastructure, predictable gas yield from mature waste cells, and the cellulosic qualification that supports D3 Renewable Identification Number generation under the United States RFS. Landfill projects also benefited from long operating histories in North America and Europe, which made them easier for lenders and developers to evaluate against newer waste pathways. Food waste is the fastest-growing feedstock segment and is projected to advance at a 10.2% CAGR from 2026 to 2031, reflecting state organics bans and the economics of diverting high-moisture organic material into anaerobic digestion. The American Biogas Council stated in February 2026 that food waste accounts for 15% of municipal solid waste streams in the United States and that more than 75% still ends up in landfills, leaving a large volume available for future diversion.
The same report counted only 124 standalone food waste anaerobic digestion facilities in the United States, with a combined capacity of 27.6 Bcf per year, versus a theoretical potential of 192 Bcf, underscoring how early this segment still is relative to its resource base. Agricultural residues and animal manure represent a distinct value pool in the renewable gas from waste industry, as dairy manure can earn very favorable lifecycle carbon scores under the LCFS and the federal RFS. That revenue stacking makes manure-based RNG especially attractive when carbon intensity is low enough to create value well above the gas's value. Industrial organic waste is also gaining ground because food processors, brewers, and pharmaceutical plants can combine gate-fee logic with long-term energy procurement. The Food and Agriculture Organization of the United Nations (FAO) and the Organization for Economic Co-operation and Development (OECD) outlook for 2025 to 2034 supports the long-term direction of this feedstock mix, as rising incomes and urbanization in middle-income countries are expected to lift food consumption and related waste volumes over time.


By Technology: Anaerobic Digestion Commands Share as Upgrading Systems Capture Growth Momentum.
Anaerobic digestion accounted for 44.1% of the technology mix in 2025, making it the largest base in the renewable gas from waste market. Its lead reflects broad feedstock flexibility, as the same process family can work across wastewater sludge, food waste, animal manure, and mixed organics, with far greater commercial maturity than newer alternatives. Anaerobic digestion also benefits from a long operating record, which reduces lender uncertainty and supports standardized plant configurations. Co-digestion strengthens this advantage by allowing operators to blend different organic streams and smooth feedstock seasonality, thereby improving utilization rates. Research published in 2025 reported that process interventions such as zerovalent iron nanoparticles, biochar, and bioaugmentation can increase biogas yield and methane content under controlled conditions, suggesting further performance gains at existing facilities.
Landfill gas recovery remains important because it is embedded in the waste management infrastructure of regulated sites. Yet its long-term share is likely to come under pressure as diversion rules remove organics from landfills. Biogas upgrading is the fastest-growing technology segment and is projected to grow at a 11.1% CAGR through 2031, reflecting the stronger economics available in transport fuel and grid-injection pathways. Recent technical work points to lower energy use and higher gas purity across new upgrading designs, including four-column Vacuum Pressure Swing Adsorption (VPSA) systems and nanobubble-enhanced membrane approaches. Those improvements matter because higher methane purity and lower processing energy directly improve plant margins in the renewable gas from waste market. Gasification and pyrolysis remain part of the landscape. However, they are still more niche than anaerobic digestion and upgrading because their commercial base is smaller and their feedstock fit is narrower.
By Gas Type: Biogas Leads Installed Base, While RNG Commands the Premium End of the Value Stack.
Biogas retained a 51.7% share of gas output in 2025, reflecting the large installed base of direct combustion and combined heat and power systems built before biomethane / RNG upgrading economics strengthened. Many on-farm digesters and wastewater facilities still stop at raw biogas because local off-take pricing, project size, or distance to a gas pipeline does not yet justify a full upgrading unit. This keeps biogas relevant across the renewable gas from waste market, even as higher-value gas forms expand faster.
Biomethane / renewable natural gas is the fastest-growing gas type, projected to grow at a 13.1% CAGR from 2026 to 2031, placing it at the premium end of the renewable gas from waste market. Biomethane is gaining support because connection rights are improving in Europe under Directive 2024/1788, which requires network operators to prioritize renewable gas connection requests over those for fossil gas production. This change addresses one of the main historical bottlenecks for upgraded gas projects: the difficulty of securing fair and timely network access. Germany also had 290 biomethane upgrading plants that produced 12.8 TWh in 2025, and the Fachverband Biogas noted that 14.5 TWh could already be achieved with the current asset base. The gap between technical potential and realized production shows that policy and commercial readiness still shape output just as much as plant capability. Syngas remains relevant for waste streams that are less suitable for digestion, but it still lags the more standardized biogas and RNG routes in terms of commercial depth.
By Application: Electricity Generation Leads by Installed Volume, While Transport Fuel Leads by Economic Value
Electricity generation accounted for the largest share at 34.8% in 2025, supported by the global installed base of biogas systems originally built for on-site power production. This base is especially visible in Europe and China, where many facilities were designed around electricity and CHP before upgraded gas pathways became more attractive. Combined Heat and Power (CHP) still fits sites with steady heat demand because it can raise total system efficiency into a stronger range than power-only assets. Grid injection is also expanding, but it remains more dependent on pipeline proximity, gas quality compliance, and operator scale. These conditions mean that larger developers and better-located assets still hold an advantage in moving from raw biogas to injected biomethane.
Transportation fuel is the fastest-growing application and is projected to expand at a 12.6% CAGR through 2031, making it one of the strongest demand channels for the renewable gas from waste market size. In the United States, 94% of on-road natural gas fuel used in 2025 was RNG, totaling 755 million GGE, indicating that the fuel pool is already heavily renewable in practical use. That pull from freight and other mobility users makes upgrading a more attractive choice than direct combustion for many new projects. Industrial and residential / commercial heating continue to grow as biomethane is injected into local networks, especially in countries with clearer decarbonization roadmaps. The application mix across the renewable gas from waste market is therefore moving toward higher-value gas sales, even though electricity retains the largest installed base.
By Component: Infrastructure Value Chain from Gas Collection to Intelligent Monitoring
Gas processing and upgrading units held 30.75% of the renewable gas from waste market share in 2025, making them the largest component category in the value chain. Their leading position reflects the central role of gas purification in moving raw biogas into higher-value end uses such as grid injection and transportation fuel. This part of the system includes membrane separators, water scrubbers, and VPSA systems that raise methane concentration and remove carbon dioxide and impurities. The commercial importance of these units has increased as developers prioritize renewable natural gas pathways that offer stronger pricing and better credit-linked returns than direct combustion. The renewable gas from waste market continues to allocate a large share of capital to this component because compliance with fuel specifications determines whether a project can access premium off-take channels.
Gas processing and upgrading units also shape project economics, as higher recovery rates and lower energy use can directly improve plant margins. Monitoring and control systems are the fastest-growing component segment, projected to expand at a 10.41% CAGR through 2031. Their growth reflects stricter gas quality standards, tighter reporting requirements, and the operational need to manage contaminants such as siloxanes and hydrogen sulfide in real time. As more projects target vehicle fuel and pipeline injection, continuous measurement and automated controls are becoming essential rather than optional. This trend is raising the strategic value of digital supervision and quality assurance across the renewable gas from waste market.
Geography Analysis
Europe held 38.5% of the renewable gas from waste market share in 2025, making it the largest regional market in the current cycle. The region’s lead comes from strong biomethane policy ambition, established digestion and upgrading assets, and broader gas network integration across multiple member states. REPowerEU’s target of 35 bcm of biomethane per year by 2030, along with the estimated EUR 37 billion (USD 40 billion) investment requirement, continues to support long-term project pipelines across the region. Germany had approximately 9,605 biogas plants operating, including 290 biomethane upgrading facilities, which produced 12.8 TWh in 2025, demonstrating the depth of installed infrastructure in the region. At the same time, uneven national implementation and regulatory uncertainty in markets such as Germany continue to raise financing and execution risk for developers.
North America remained one of the most commercially advanced regions in the renewable gas from waste market, supported by the federal RFS, California’s LCFS, state organics diversion rules, and a large installed base of landfill gas and anaerobic digestion projects. In 2025, USD 2.1 billion in new United States biogas investments came online, with landfill projects leading capital deployment and agriculture close behind, which shows that capital deployment is broadening across feedstock types. The United States also still has 470 landfills flaring gas that could be converted into RNG, preserving a visible near-term development pipeline for additional supply. Canada adds regional depth as provinces such as British Columbia and Ontario continue building biomethane procurement frameworks and municipal project support mechanisms.
Asia-Pacific is projected to expand at a 13.62% CAGR from 2026 to 2031, making it the fastest-growing region in the renewable gas from waste market. The region’s growth is tied to rapid urbanization, rising organic waste volumes, and increasing policy standardization led by China. China’s technical standard NB/T 11925-2025 took shape as part of a broader industrial push, while IEA (International Energy Agency) Bioenergy data show that current biomethane capacity remains far below the country’s long-term resource potential. India and Southeast Asia are emerging as secondary growth centers as waste volumes rise and local project frameworks improve. South America, led by Brazil, is advancing landfill-gas development. At the same time, the Middle East and Africa remain early-stage markets with sizable volumes of uncaptured organic waste and more limited infrastructure. This regional mix leaves Europe as the largest revenue center, North America as a highly developed commercial base, and Asia-Pacific as the main runway for expansion through 2031.

Competitive Landscape
The renewable gas from waste market shows moderate concentration. Large integrated energy companies and infrastructure-backed developers now control many of the largest project portfolios. However, regional specialists, waste managers, and equipment suppliers still make up a wide supplier base across countries. This mix means the renewable gas from waste market rewards both scale and local execution, because feedstock access, permitting, interconnection, and off-take structures are still highly site-specific. Strategic behavior at the top of the market increasingly centers on repeatable platform models rather than one-off plants. Developers are pairing waste access, upgrading technology, and long-term fuel or grid sales into project templates that can be deployed across multiple sites.
Montauk Renewables showed this financing pattern in March 2026 when it confirmed a USD 200 million senior credit facility with HASI to fund the first phase of its agricultural RNG project in North Carolina and support future project completion. Clean Energy Fuels and Maas Energy Works also expanded the build-out model in May 2025 by breaking ground on 3 dairy RNG production facilities across 6 dairy farms with a combined investment of USD 80 million. In Europe, EQT entered exclusive negotiations in June 2025 to acquire a 54.1% stake in Waga Energy at EUR 21.55 per share (USD 23.27), signaling continued confidence among infrastructure investors in landfill-gas-to-RNG assets. These moves show that capital providers increasingly prefer platforms with repeatable engineering and long asset lifespans over isolated development opportunities.
Competitive white space remains strongest at smaller landfills and at industrial food waste sites, where the project can solve both disposal and energy needs at the same location. Asset-light structures are becoming more relevant in that part of the renewable gas from waste market because they reduce the upfront burden on the feedstock owner and let the developer recover value over a long contract period. Corporate biomethane purchase agreements also support competition by giving new plants creditworthy demand anchors, as seen in the BASF, Sanofi, PepsiCo United Kingdom, and Arkema agreements with ENGIE. At the same time, gas quality management is becoming a clearer source of differentiation because grid and vehicle fuel markets require stable contaminant control and reliable specification compliance. The broader picture is that the renewable gas from waste market is consolidating around capital access and execution discipline, but it is not close to a winner-take-all structure.
Renewable Gas From Waste Industry Leaders
TotalEnergies SE
Storengy SAS (ENGIE Group)
Veolia Environnement S.A.
SUEZ S.A.
L'Air Liquide S.A.
- *Disclaimer: Major Players sorted in no particular order

Recent Industry Developments
- April 2026: Sagepoint Energy and its logistics subsidiary acquired 60 heavy-duty RNG-powered Freightliner trucks equipped with the Cummins X15N engine, positioning the company as a vertically integrated RNG producer and dedicated logistics carrier, a circular model in which the energy asset directly fuels the transport operation.
- March 2026: EPA finalized the RFS "Set 2" rule, establishing cellulosic biofuel RVO volumes at 1.36 billion RINs for 2026 and 1.43 billion RINs for 2027. The rule is projected to generate over USD 10 billion for rural economies, create over 100,000 jobs, and reduce the United States dependence on foreign oil by approximately 300,000 barrels per day.
- February 2026: Germany's Bundesnetzagentur set the ceiling price for the 2026 biomethane auction at EUR 23.13 cents per kWh (approximately USD 0.25 per kWh), with a total annual auction volume of 600 MW across 2 tender rounds, providing a pricing floor for German biomethane developers amid broader regulatory uncertainty.


Global Renewable Gas From Waste Market Report Scope
The Renewable Gas From Waste Market Report is Segmented by Feedstock (Food Waste, Animal Manure, and More), by Technology (Gasification, Pyrolysis, and More), by Gas Type (Biogas, Syngas, and More), by Application (Electricity Generation, and More), by Component (Gas Collection, Digesters & Fermentation and More), and by Geography (North America, Europe, and More). The Market Forecasts are Provided in Terms of Value (USD).
| Municipal Solid Waste (MSW) |
| Agricultural Residues |
| Animal Manure |
| Industrial Organic Waste |
| Sewage Sludge |
| Food Waste |
| Others |
| Anaerobic Digestion |
| Landfill Gas Recovery |
| Gasification |
| Pyrolysis |
| Biogas Upgrading Systems |
| Others |
| Biogas |
| Biomethane / Renewable Natural Gas (RNG) |
| Syngas |
| Electricity Generation |
| Combined Heat & Power (CHP) |
| Grid Injection |
| Transportation Fuel |
| Industrial Heating |
| Residential & Commercial Heating |
| Others |
| Gas Collection Systems |
| Digesters & Fermentation Systems |
| Gas Processing & Upgrading Units |
| Compressors & Storage Systems |
| Power Generation Equipment |
| Monitoring & Control Systems |
| Others |
| North America | United States |
| Canada | |
| Mexico | |
| South America | Brazil |
| Argentina | |
| Chile | |
| Rest of South America | |
| Europe | Germany |
| United Kingdom | |
| France | |
| Italy | |
| Spain | |
| Russia | |
| Benelux (Belgium, Netherlands, and Luxembourg) | |
| NORDICS (Denmark, Finland, Iceland, Norway, and Sweden) | |
| Rest of Europe | |
| Asia-Pacific | China |
| India | |
| Japan | |
| South Korea | |
| Australia | |
| Southeast Asia (Indonesia, Vietnam, Thailand, Malaysia, Philippines) | |
| Rest of Asia-Pacific | |
| Middle East & Africa | United Arab Emirates |
| Saudi Arabia | |
| South Africa | |
| Nigeria | |
| Rest of Middle East & Africa |
| By Feedstock | Municipal Solid Waste (MSW) | |
| Agricultural Residues | ||
| Animal Manure | ||
| Industrial Organic Waste | ||
| Sewage Sludge | ||
| Food Waste | ||
| Others | ||
| By Technology | Anaerobic Digestion | |
| Landfill Gas Recovery | ||
| Gasification | ||
| Pyrolysis | ||
| Biogas Upgrading Systems | ||
| Others | ||
| By Gas Type | Biogas | |
| Biomethane / Renewable Natural Gas (RNG) | ||
| Syngas | ||
| By Application | Electricity Generation | |
| Combined Heat & Power (CHP) | ||
| Grid Injection | ||
| Transportation Fuel | ||
| Industrial Heating | ||
| Residential & Commercial Heating | ||
| Others | ||
| By Component | Gas Collection Systems | |
| Digesters & Fermentation Systems | ||
| Gas Processing & Upgrading Units | ||
| Compressors & Storage Systems | ||
| Power Generation Equipment | ||
| Monitoring & Control Systems | ||
| Others | ||
| By Geography | North America | United States |
| Canada | ||
| Mexico | ||
| South America | Brazil | |
| Argentina | ||
| Chile | ||
| Rest of South America | ||
| Europe | Germany | |
| United Kingdom | ||
| France | ||
| Italy | ||
| Spain | ||
| Russia | ||
| Benelux (Belgium, Netherlands, and Luxembourg) | ||
| NORDICS (Denmark, Finland, Iceland, Norway, and Sweden) | ||
| Rest of Europe | ||
| Asia-Pacific | China | |
| India | ||
| Japan | ||
| South Korea | ||
| Australia | ||
| Southeast Asia (Indonesia, Vietnam, Thailand, Malaysia, Philippines) | ||
| Rest of Asia-Pacific | ||
| Middle East & Africa | United Arab Emirates | |
| Saudi Arabia | ||
| South Africa | ||
| Nigeria | ||
| Rest of Middle East & Africa | ||


Key Questions Answered in the Report
What is the renewable gas from waste market size in 2026?
The renewable gas from waste market size stands at USD 20.34 billion in 2026 and is forecast to reach USD 31.42 billion by 2031, growing at a 9.09% CAGR.
Which feedstock currently leads and which one is expanding fastest?
Municipal solid waste led with a 35.4% share in 2025 because of mature landfill infrastructure, while food waste is projected to grow fastest at a 10.2% CAGR as organics diversion rules expand.
Why is RNG growing faster than raw biogas?
RNG is tied to higher-value transport fuel and grid-injection pathways, and United States pipeline-quality RNG facilities reached 659 by December 2025, supporting a 13.1% forecast CAGR for the gas type.
Why does transportation matter so much for project economics?
In the United States, 94% of on-road natural gas fuel used in 2025 was RNG, which gives upgraded gas a stronger revenue path than many direct-combustion uses and supports more investment in upgrading systems.
Which region is growing fastest in this space?
Asia-Pacific is the fastest-growing regional bloc because urbanization and rising waste generation are expanding feedstock availability, while China still has a very large gap between current biomethane capacity and long-term potential.
What is the main risk for developers entering new projects?
The biggest challenge is capital intensity combined with uneven regulation, because projects often need expensive collection, upgrading, and interconnection assets while policy terms still vary sharply by jurisdiction.
Page last updated on:


