Network Switch Market Size and Share
Market Overview
| Study Period | 2020 - 2031 |
|---|---|
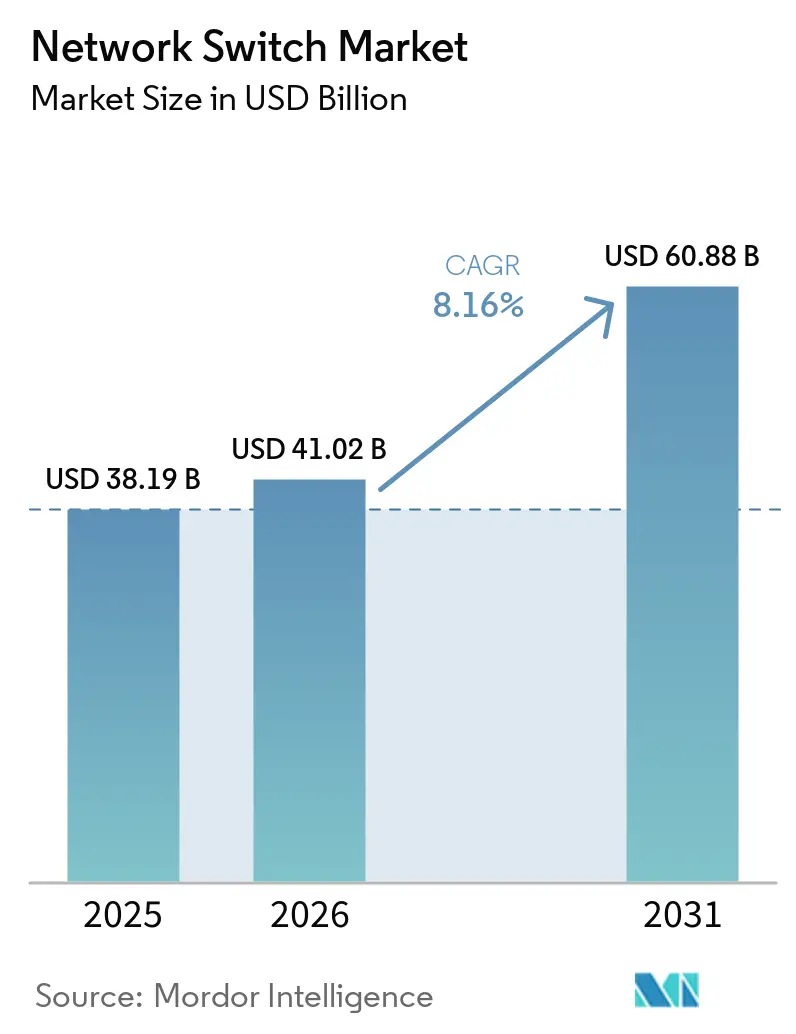
| Market Size (2026) | USD 41.02 Billion |
| Market Size (2031) | USD 60.88 Billion |
| Growth Rate (2026 - 2031) | 8.16% CAGR |
| Fastest Growing Market | Asia-Pacific |
| Largest Market | North America |
| Market Concentration | Medium |
Major Players *Disclaimer: Major Players sorted in no particular order Image © Mordor Intelligence. Reuse requires attribution under CC BY 4.0. | |
Network Switch Market Analysis by Mordor Intelligence
The network switch market size is projected to expand from USD 38.19 billion in 2025 and USD 41.02 billion in 2026 to USD 60.88 billion by 2031, registering a CAGR of 8.16% between 2026 to 2031. Surging artificial-intelligence workloads are reshaping data-center architectures, moving procurement decisions toward non-blocking Ethernet fabrics that keep GPU clusters fully utilized. Hyperscale operators are compressing refresh cycles as 800 GbE and 1.6 TbE line cards enter volume production, while campus upgrades focus on WiFi 7 access points that require IEEE 802.3bt PoE++. Telcos are modernizing transport layers for Open RAN and private 5G, and government broadband programs in the United States and India are stimulating aggregation-switch demand in fiber rollouts. Competitive intensity is rising as white-box vendors and NVIDIA’s Spectrum-X platform challenge incumbent switch suppliers.
Key Report Takeaways
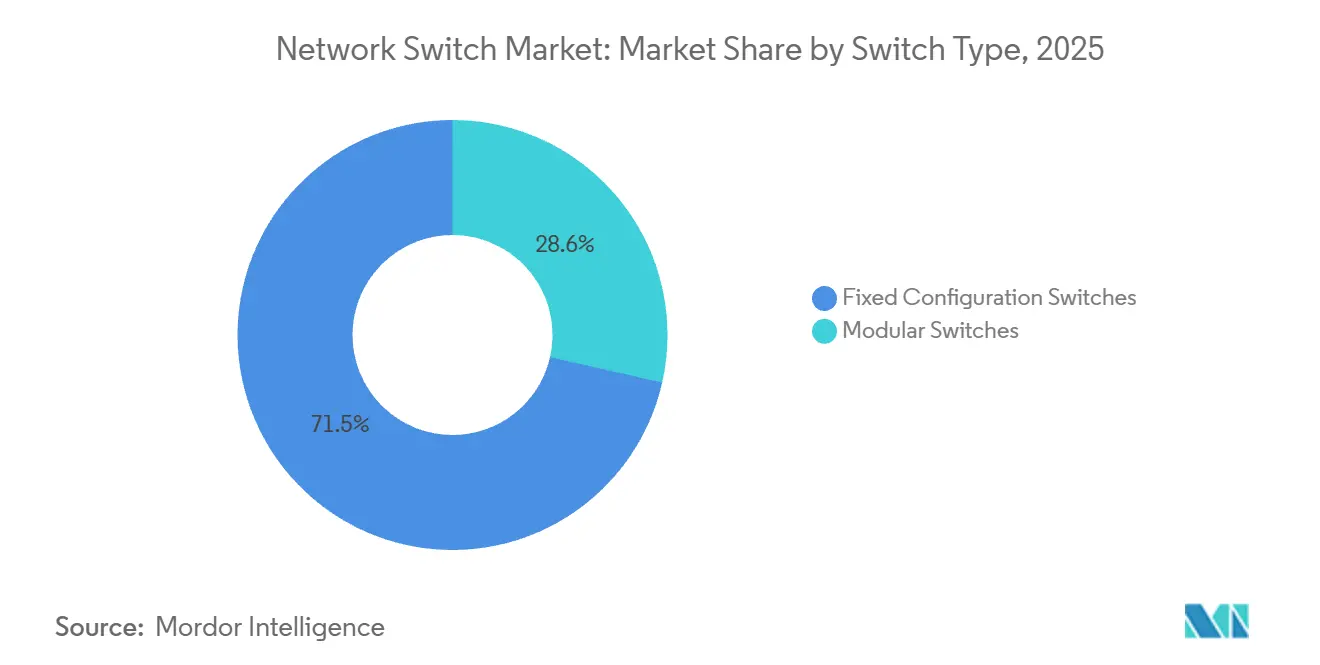
- By switch type, fixed-configuration platforms held 71.45% of the network switch market share in 2025, and modular systems are advancing at a 9.62% CAGR through 2031.
- By port speed, the 1 GbE-and-below tier led with a 32.40% share of the network switch market in 2025, whereas 400 GbE-and-above ports are forecast to expand at a 10.61% CAGR through 2031.
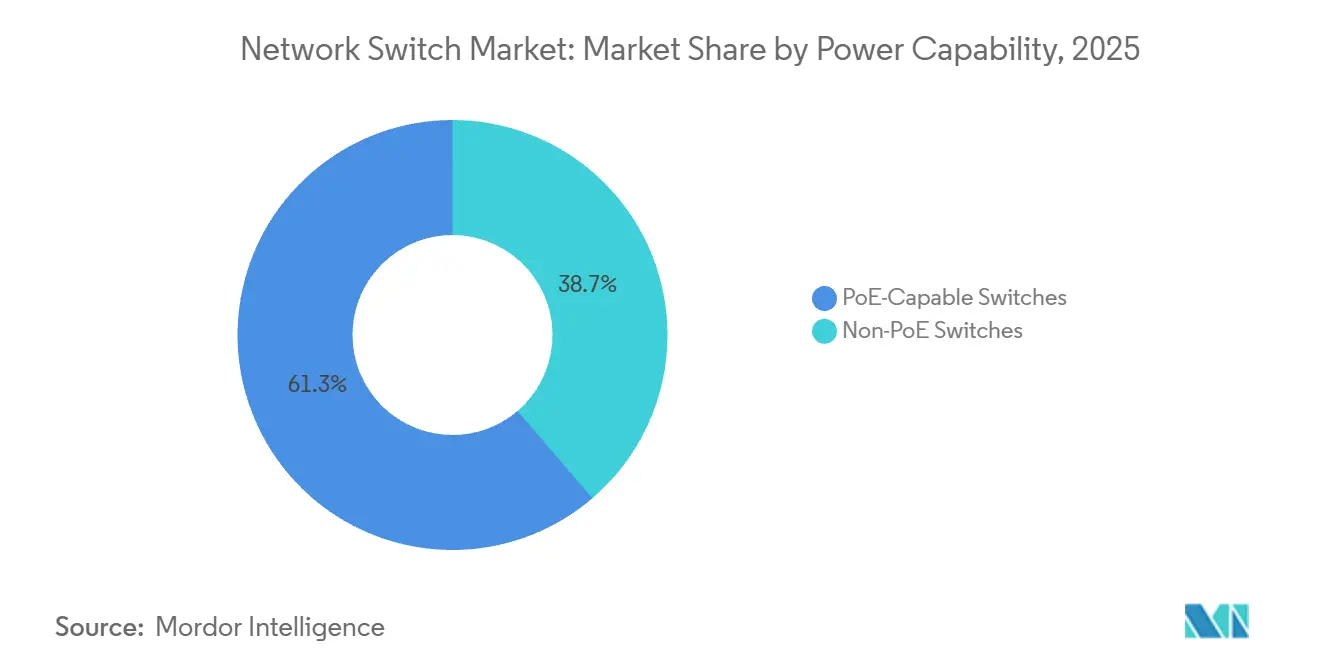
- By power capability, non-PoE switches accounted for 61.28% of the network switch market size in 2025, while PoE-capable models are growing at a 9.96% CAGR.
- By end-user, enterprises commanded 35.62% of the network switch market share in 2025, and telecommunication service providers are the fastest-growing cohort, with a 11.62% CAGR through 2031.
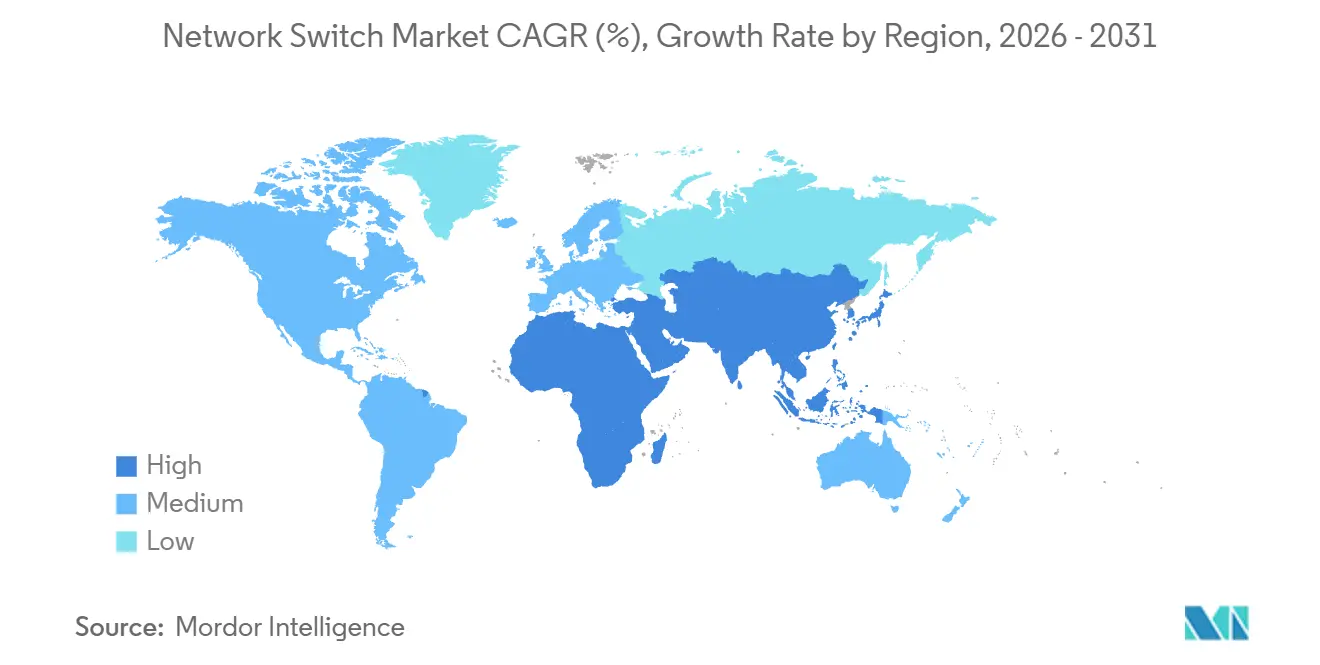
- By geography, North America led with 36.88% revenue share in 2025, whereas Asia-Pacific is tracking a 9.72% CAGR over 2026-2031.
Note: Market size and forecast figures in this report are generated using Mordor Intelligence’s proprietary estimation framework, updated with the latest available data and insights as of January 2026.
Global Network Switch Market Trends and Insights
Drivers Impact Analysis*
| Driver | (~) % Impact on CAGR Forecast | Geographic Relevance | Impact Timeline |
|---|---|---|---|
| Hyperscale Data Center Expansion | +2.50% | Global, concentrated in North America, Asia-Pacific (China, India, Singapore), and Western Europe | Medium term (2-4 years) |
| Migration to Higher Port Speeds | +1.80% | Global, led by North America and Asia-Pacific hyperscale hubs | Long term (≥ 4 years) |
| Integration of AI-Optimized Ethernet Fabrics | +1.50% | North America, Western Europe, select Asia-Pacific markets (Japan, South Korea) | Medium term (2-4 years) |
| Proliferation of Cloud-Managed Networking Platforms | +1.00% | Global, with strong adoption in North America, Europe, and urban Asia-Pacific | Short term (≤ 2 years) |
| Government Broadband Stimulus Funds | +0.80% | United States (BEAD), European Union (Digital Decade), India (BharatNet), select South America markets | Medium term (2-4 years) |
| Rise of Private 5G Campus Networks Requiring TSN | +0.60% | North America, Western Europe, Japan, South Korea, with emerging interest in Middle East and South America | Long term (≥ 4 years) |
| Source: Mordor Intelligence | |||
Hyperscale Data Center Expansion
Hyperscale operators continue to add 15-20 GW of capacity, yet transformer shortages keep new builds in regulatory queues, prompting operators to over-provision networking in existing halls to raise compute density per watt. Rising GPU counts require non-blocking 800 GbE fabrics, reversing the multi-year decline in revenue per port. NVIDIA’s Spectrum-X reached 95% network throughput in the xAI Colossus supercomputer by pairing Spectrum-4 switches with advanced congestion-control software.[1]NVIDIA Corporation, “Co-Packaged Optics for Spectrum-4,” nvidianews.nvidia.com As a result, merchant-silicon vendors that lack AI-specific telemetry risk design-win losses at the spine layer.
Migration to Higher Port Speeds
Global shipments of 800 GbE optical modules grew 60% in 2025 as organizations running large-language-model inference moved beyond 100 GbE backbones. Arista’s 7700R5 packs 32 800 GbE ports in one rack unit, enabling cloud operators to collapse three-tier fabrics into two tiers and cut latency by 30%.[2]Arista Networks, “7700R5 Launch Announcement,” arista.com Co-packaged optics introduced by NVIDIA eliminate electrical-optical conversion and may cut energy per terabit by 40%. Software complexity rises because legacy network operating systems assume symmetrical speeds, pushing demand for intent-based automation that abstracts mixed link rates.
Integration of AI-Optimized Ethernet Fabrics
The Ultra Ethernet Consortium’s Specification 1.0 added telemetry and congestion control, enabling Ethernet to match InfiniBand latency without proprietary protocols. NVIDIA’s Spectrum-X generated USD 1 billion in 2025 and targets USD 3-4 billion in 2026 as hyperscalers favor Ethernet fabrics that preserve interoperability. Cisco’s Silicon One G200 counters with on-chip encryption to address data-sovereignty mandates in the European Union and India. Arista embeds predictive analytics that warn of switch failures three days in advance, reducing costly GPU idleness.
Proliferation of Cloud-Managed Networking Platforms
Cisco Meraki surpassed 3.5 million devices under cloud management in 2025, while HPE Aruba Central crossed the 2 million mark. Zero-touch provisioning resonates with multi-site retailers that cannot justify the cost of on-site engineers. Subscription pricing smooths cash flow and locks customers into multi-year renewals, with renewal rates topping 90%. Georgetown University’s 10,000-access-point WiFi 7 rollout shows how a single dashboard can automate channel assignments across 104 buildings.
Restraints Impact Analysis*
| Restraint | (~) % Impact on CAGR Forecast | Geographic Relevance | Impact Timeline |
|---|---|---|---|
| Price Pressure from White-Box ODM Switches | -1.20% | Global, most acute in North America and Asia-Pacific hyperscale markets | Short term (≤ 2 years) |
| Semiconductor Supply-Chain Volatility | -0.80% | Global, with residual constraints in advanced nodes (5nm, 3nm) for high-end ASICs | Medium term (2-4 years) |
| Energy-Efficiency Regulations Raising Design Complexity | -0.50% | European Union (EcoDesign Directive), United States (DOE proposals), Japan, South Korea | Long term (≥ 4 years) |
| Skills Gap in High-Speed Optical Switching Technologies | -0.30% | Global, particularly acute in emerging markets and mid-tier enterprises | Long term (≥ 4 years) |
| Source: Mordor Intelligence | |||
Price Pressure from White-Box ODM Switches
Hyperscalers save 20-30% by loading SONiC on bare-metal switches from Edgecore or Celestica, and the November 2025 release added 800 GbE support.[3]SONiC Foundation, “800 GbE Support Release Notes,” sonicfoundation.dev Microsoft, Meta, and Google already run more than one million white-box devices, eroding gross margins for branded vendors. Juniper’s 2025 sale to Hewlett Packard Enterprise aimed to bundle AI-native software with servers to combat commoditization. As SONiC matures with enterprise features like role-based access control, mid-market customers may also defect, compressing addressable revenue for premium products.
Semiconductor Supply-Chain Volatility
Lead times for switch ASICs fell from 52-plus weeks in 2023 to 16-20 weeks by late 2025, yet Broadcom still commands roughly 70% merchant-silicon share, enabling pricing leverage. TSMC’s 3 nm capacity is tight as smartphone and AI accelerators vie for wafer starts. Cisco developed Silicon One to reduce reliance on Broadcom, and NVIDIA secured Mellanox’s ASIC pipeline, but smaller vendors remain exposed to allocation cuts during shortages. Continued volatility could accelerate industry consolidation, as cash-rich firms acquire rivals to secure silicon supplies.
*Our forecasts treat driver/restraint impacts as directional, not additive. The impact forecasts reflect baseline growth, mix effects, and variable interactions.
Segment Analysis
By Switch Type: Modular Designs Gain Favor for AI Scale
Fixed configuration switches held 71.45% of the network switch market share in 2025, as enterprises continue to prioritize simplicity, ease of deployment, and lower upfront capital expenditure. Their plug-and-play nature and reduced need for specialized management expertise make them especially attractive for campus and branch environments with predictable workloads. Modular switches, however, are projected to expand at a 9.62% CAGR as operators increasingly focus on long-term investment protection and scalability. Platforms such as the 7800R4 from Arista Networks allow customers to incrementally add 400 GbE and 800 GbE line cards, enabling capacity upgrades without costly forklift replacements.
The calculus shifts significantly in AI-driven data center environments, where bandwidth demands grow exponentially, requiring more flexible architectures. In such scenarios, NVIDIA Corporation’s Spectrum-X reference architecture emphasizes modular spine switches to efficiently support future scaling and east-west traffic expansion. Fixed-configuration switches still dominate top-of-rack deployments due to their cost efficiency and compact design, particularly in standardized rack environments.


By Port Speed: 400 GbE and 800 GbE Redefine Economics
Legacy 1 GbE-and-below accounted for 32.40% of the network switch market size in 2025, tied to campus endpoints. Ports rated 400 GbE and above are growing at a 10.61% CAGR, outpacing the network switch market by 245 basis points. Meanwhile, ports rated 400 GbE and above are expanding at a 10.61% CAGR, outpacing the overall market by 245 basis points, driven by hyperscale and AI-driven bandwidth requirements. The declining cost of optical transceivers has made the transition to higher speeds significantly more economical, accelerating enterprise willingness to adopt next-generation switching architectures.
Multi-gig 2.5/5 GbE uplinks are gaining traction in the WiFi 7 refresh cycle, where higher throughput and low latency are essential for supporting dense device environments and advanced applications. This trend is reflected in platforms like the Catalyst 9000X from Cisco Systems, Inc., which integrates 400 GbE uplinks alongside 48 multi-gig PoE++ ports to address evolving enterprise access needs. At the silicon level, innovations such as the Tomahawk 6 from Broadcom Inc. enable 800 GbE performance while maintaining power envelopes similar to those of earlier 400 GbE chips, thereby accelerating the obsolescence of slower switching tiers and pushing enterprises toward higher-capacity network infrastructure.
By Power Capability: PoE++ Demand Surges in Campus Upgrades
PoE-capable models are advancing at a 9.96% CAGR as the IEEE 802.3bt standard enables delivery of up to 90 W per port, supporting power-hungry devices such as WiFi 7 access points, smart lighting, and advanced IoT systems. Large-scale deployments highlight this shift, such as Georgetown University’s campus modernization project, which required switches with aggregate power budgets of up to 3,600 W to reliably support nearly 10,000 WiFi 7 access points across academic and administrative buildings. Despite this momentum, non-PoE switches still account for 61.28% of the market, primarily because they dominate data center environments where servers rely on independent power supplies and network design prioritizes higher port density and throughput efficiency over inline power delivery.
The increasing thermal load and power consumption associated with high PoE budgets are prompting enterprises to explore more energy-efficient alternatives, particularly in large campus networks. Optical LAN architectures are gaining traction as they eliminate the need for copper-based power delivery, reducing both heat generation and cabling complexity. Vendors such as Ruckus Networks and Nokia Corporation claim that fiber-based deployments can achieve up to 40% energy savings by removing PoE requirements entirely, while also extending network reach and improving long-term operational efficiency.
By End-User: Telcos Lead Growth with Open RAN
Telecommunications providers are expanding at an 11.62% CAGR as Open RAN architectures replace proprietary base-station controllers with disaggregated, merchant-silicon-based switching infrastructure, improving flexibility and reducing vendor lock-in. Operators such as AT&T are accelerating this transition through large-scale modernization initiatives, including a USD 14 billion partnership with Ericsson aimed at achieving roughly 20% annual energy efficiency improvements and 22–25% reductions in power consumption. Similarly, Vodafone Group is targeting 30% Open RAN penetration across its 170,000 sites, extending infrastructure investments and procurement cycles well beyond 2030 while reshaping vendor ecosystems.
Enterprises still account for 35.62% of the network switch market share, driven by ongoing campus network upgrades tied to WiFi 7 adoption and the implementation of zero-trust security frameworks that require more granular segmentation and control. At the same time, cloud service providers remain the largest contributors in absolute spending, as AI-driven data center clusters demand ultra-low latency and non-oversubscribed network architectures to maintain performance. Government agencies are also modernizing wide-area and secure networks under increasingly stringent data sovereignty and cybersecurity regulations, although their growth trajectory remains comparatively moderate in the mid-single-digit range due to budget cycles and procurement constraints.
Geography Analysis
North America maintained 36.88% of global revenue in 2025, lifted by hyperscale footprints in Virginia, Oregon, and Texas, and by the USD 42.45 billion BEAD program that underwrites fiber aggregation switches at neighborhood nodes.[4]NTIA, “BEAD State Allocation Table,” broadbandusa.ntia.doc.gov Federal incentives amplify private spending as cloud operators co-locate edge facilities near funded fiber routes to lower content-delivery latency. Canada follows similar patterns through provincial broadband grants, albeit at smaller scale.
Asia-Pacific is the fastest-growing region at a 9.72% CAGR. India’s planned USD 30-36 billion investment aims to lift tower fiberization toward 70%, triggering demand for aggregation switches in metro rings. China accelerates data-center construction in inland provinces as policy banks extend low-rate loans to AI start-ups that must keep their training data within national borders. Japan and South Korea deploy Time-Sensitive Networking for robotics, requiring deterministic Ethernet fabrics in private 5G campuses.
Europe is growing more slowly as the EcoDesign Directive forces costly ASIC redesigns to meet Tier 2 energy-efficiency targets. Germany and the Netherlands prioritize water-efficient cooling solutions, adding purchasing criteria that favor vendors with immersion-ready chassis. Southern European carriers focus on rural broadband, but macroeconomic headwinds curb capital intensity. In the Middle East, Saudi Arabia and the United Arab Emirates build AI-focused campuses with 800 GbE spines, while Africa upgrades mobile backhaul to 4G and early 5G, held back by unreliable grids and limited fiber.

Competitive Landscape
Cisco, Arista, and Juniper together control roughly a substantiaal portion of enterprise and data-center revenue, yet fragmentation is increasing as white-box suppliers undercut branded pricing. NVIDIA’s Spectrum-X captured about USD 1 billion in 2025 and is poised to reach USD 3-4 billion in 2026, forcing incumbents to ship AI-optimized silicon sooner. Cisco answers with Silicon One G200 encryption to comply with sovereign-AI rules, while Arista relies on CloudVision analytics to predict failures 72 hours in advance.[5]Cisco Systems, “Silicon One G200 Announcement,” newsroom.cisco.com
Hewlett Packard Enterprise’s USD 14 billion purchase of Juniper in 2025 forms a compute-plus-networking stack that aims at private-cloud customers who want on-premises AI capacity without public-cloud egress fees. The Ultra Ethernet Consortium may erode NVIDIA’s advantage by standardizing congestion-control extensions adopted by Broadcom and Arista, lowering switching costs across vendors. ODMs such as Edgecore and Celestica push SONiC-ready platforms at 20-30% discounts, prompting branded suppliers to unbundle software or accept margin compression.
Barriers to entry rise as IEEE 802.3bt PoE++ and EU energy mandates demand deep engineering budgets, yet those same rules stretch product cycles and slow feature velocity. Strategic footholds emerge in private 5G, where Ericsson and Nokia bundle Ethernet switches with radios, and in cloud-managed networks, where Cisco Meraki and Aruba Central monetize software subscriptions with 90% renewal rates. Vendors that balance merchant-silicon agility with differentiated software are best positioned to capture the most lucrative AI fabrics while defending legacy enterprise footprints.
Network Switch Industry Leaders
Cisco Systems, Inc.
NVIDIA Corporation
Arista Networks, Inc.
Huawei Technologies Co., Ltd.
Hewlett Packard Enterprise Development LP
- *Disclaimer: Major Players sorted in no particular order

Recent Industry Developments
- March 2026: Cisco launched the Catalyst 9000X series with 400 GbE uplinks and multi-gig PoE++, integrating Silicon One G200 and real-time anomaly detection.
- February 2026: Vodafone and Dell Technologies launched a five-year Open RAN program covering 170,000 radio sites, aiming to achieve 30% penetration by 2030.
- December 2025: NVIDIA disclosed USD 1 billion in Spectrum-X revenue for 2025 and projected USD 3-4 billion for 2026 deployments.
- November 2025: AT&T and Ericsson expanded their USD 14 billion modernization agreement to include 50,000 Open RAN cell sites.


Global Network Switch Market Report Scope
The network switch market is the global industry that designs, manufactures, distributes, and sells network switches for local area networks (LANs), using MAC addresses to efficiently forward data packets only to the intended recipient. The market is driven by growing demand for high-bandwidth, low-latency, and secure networking solutions fueled by cloud computing, 5G, AI, and digital transformation.
The Network Switch Market Report is Segmented by Switch Type (Fixed Configuration Switches, and Modular Switches), Port Speed (1 GbE and Below, 2.5/5 GbE Multi-Gig, 10 GbE, 25/40 GbE, 100 GbE, and 400 GbE and Above), Power Capability (Non-PoE Switches, and PoE-Capable Switches), End-User (Cloud and Data Center Providers, Enterprise, Telecommunication Service Providers, Government and Defense, and Other End Users), and Geography. The Market Forecasts are Provided in Terms of Value (USD).
| Fixed Configuration Switches |
| Modular Switches |
| 1 GbE and Below |
| 2.5/5 GbE Multi-Gig |
| 10 GbE |
| 25/40 GbE |
| 100 GbE |
| 400 GbE and Above |
| Non-PoE Switches |
| PoE-Capable Switches |
| Cloud and Data Center Providers |
| Enterprise (Commercial Offices & Campuses) |
| Telecommunication Service Providers |
| Government and Defense |
| Other End Users |
| North America | United States |
| Canada | |
| Mexico | |
| South America | Brazil |
| Argentina | |
| Rest of South America | |
| Europe | Germany |
| United Kingdom | |
| France | |
| Italy | |
| Russia | |
| Spain | |
| Rest of Europe | |
| Asia-Pacific | China |
| Japan | |
| India | |
| South Korea | |
| Australia and New Zealand | |
| Rest of Asia-Pacific | |
| Middle East | Saudi Arabia |
| United Arab Emirates | |
| Turkey | |
| Rest of Middle East | |
| Africa | South Africa |
| Nigeria | |
| Rest of Africa |
| By Switch Type | Fixed Configuration Switches | |
| Modular Switches | ||
| By Port Speed | 1 GbE and Below | |
| 2.5/5 GbE Multi-Gig | ||
| 10 GbE | ||
| 25/40 GbE | ||
| 100 GbE | ||
| 400 GbE and Above | ||
| By Power Capability | Non-PoE Switches | |
| PoE-Capable Switches | ||
| By End-User | Cloud and Data Center Providers | |
| Enterprise (Commercial Offices & Campuses) | ||
| Telecommunication Service Providers | ||
| Government and Defense | ||
| Other End Users | ||
| By Geography | North America | United States |
| Canada | ||
| Mexico | ||
| South America | Brazil | |
| Argentina | ||
| Rest of South America | ||
| Europe | Germany | |
| United Kingdom | ||
| France | ||
| Italy | ||
| Russia | ||
| Spain | ||
| Rest of Europe | ||
| Asia-Pacific | China | |
| Japan | ||
| India | ||
| South Korea | ||
| Australia and New Zealand | ||
| Rest of Asia-Pacific | ||
| Middle East | Saudi Arabia | |
| United Arab Emirates | ||
| Turkey | ||
| Rest of Middle East | ||
| Africa | South Africa | |
| Nigeria | ||
| Rest of Africa | ||


Key Questions Answered in the Report
What is the current value of the network switch market and how fast is it growing?
The network switch market size stood at USD 41.02 billion in 2026 and is projected to reach USD 60.88 billion by 2031, reflecting an 8.16% CAGR according to Mordor Intelligence.
How are 400 GbE and 800 GbE ports affecting procurement decisions?
Falling transceiver prices and AI workloads that require non-blocking fabrics are driving a 10.61% CAGR for 400 GbE-and-above ports, outpacing slower tiers.
Why are telecommunications providers increasing their switch budgets?
Open RAN and private 5G deployments use merchant-silicon Ethernet switches for fronthaul, midhaul, and backhaul, leading to an 11.62% CAGR in telco demand.
What role does PoE++ play in campus network refreshes?
IEEE 802.3bt PoE++ supports up to 90 W per port, enabling WiFi 7 access points and IoT devices and propelling PoE-capable switches to a 9.96% CAGR.
Which regions are expected to generate the fastest growth?
Asia-Pacific leads with a 9.72% CAGR, fueled by India’s fiberization drive and China’s sovereign-AI data centers, while North America remains the largest revenue contributor.
Page last updated on:


