Open Networking Switch Market Size and Share
Market Overview
| Study Period | 2020 - 2031 |
|---|---|
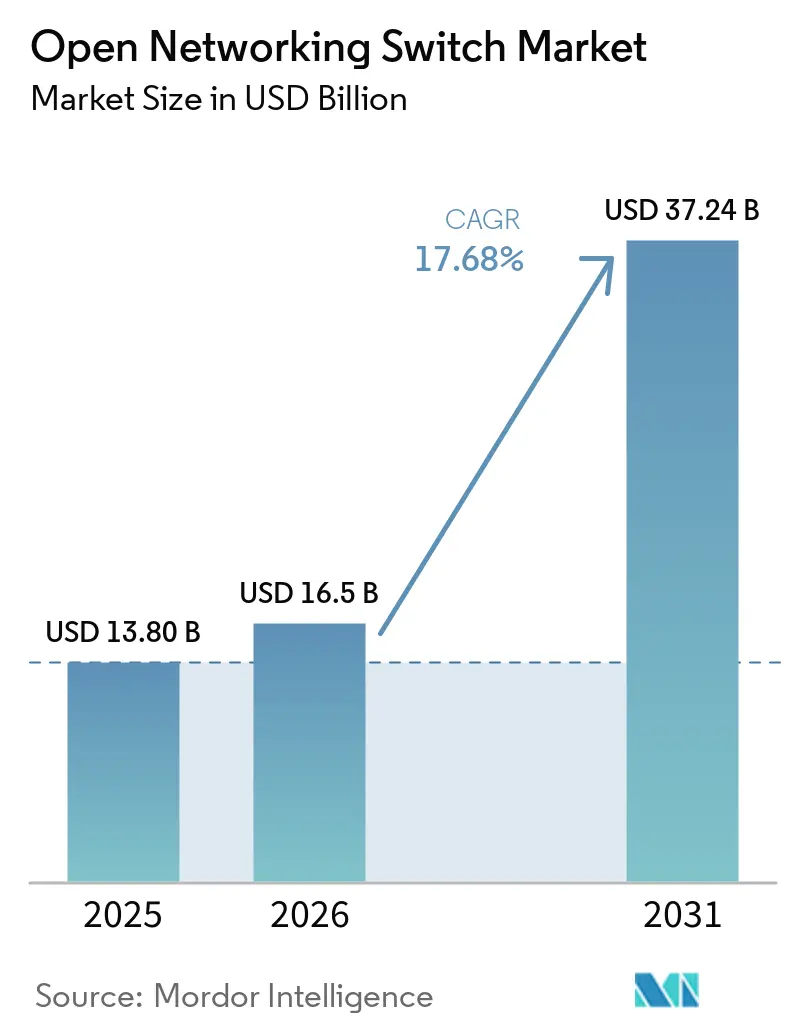
| Market Size (2026) | USD 16.5 Billion |
| Market Size (2031) | USD 37.24 Billion |
| Growth Rate (2026 - 2031) | 17.68% CAGR |
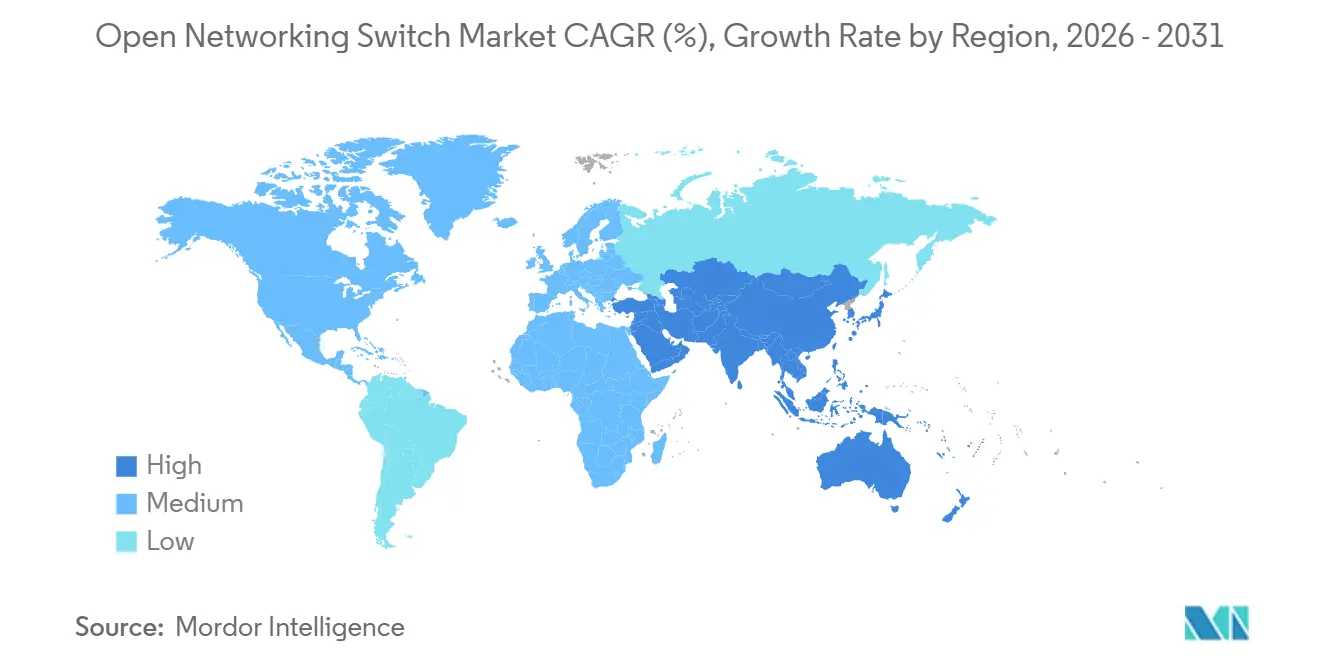
| Fastest Growing Market | Asia-Pacific |
| Largest Market | North America |
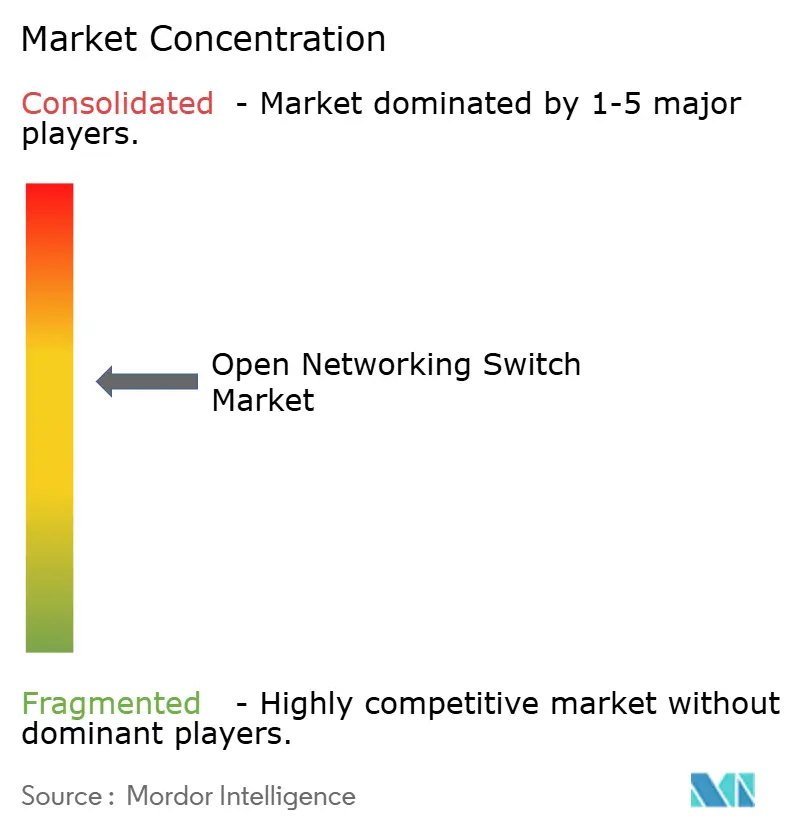
| Market Concentration | Medium |
Major Players *Disclaimer: Major Players sorted in no particular order Image © Mordor Intelligence. Reuse requires attribution under CC BY 4.0. | |
Open Networking Switch Market Analysis by Mordor Intelligence
The open networking switch market size is projected to expand from USD 13.8 billion in 2025 and USD 16.5 billion in 2026 to USD 37.24 billion by 2031, registering a CAGR of 17.68% between 2026 and 2031. Hyperscale cloud providers are accelerating fabric upgrades to 800 GbE and beyond, compressing historical seven-year port-speed transitions into barely three years. As generative AI clusters pivot to all-to-all GPU traffic, non-blocking Clos architectures built on disaggregated white-box hardware have become the default for new builds. Rapid silicon refresh cycles led by Broadcom Tomahawk 6 and Marvell Teralynx 10 enable 102.4 Tbps throughput in a single rack unit, while open-source network operating systems such as SONiC now match proprietary feature sets for telemetry and automation. Gross margins on commodity 100 GbE hardware have fallen below 25% as original design manufacturers sell directly to hyperscalers, yet margins on 800 GbE AI fabric switches remain near 40% due to the complexity of co-packaged optics integration. Supply-chain exposure to single-vendor ASIC dominance and Ethernet PHY power density above 1.6 Tbps per port remains the principal near-term risk to the open networking switch market.
Key Report Takeaways
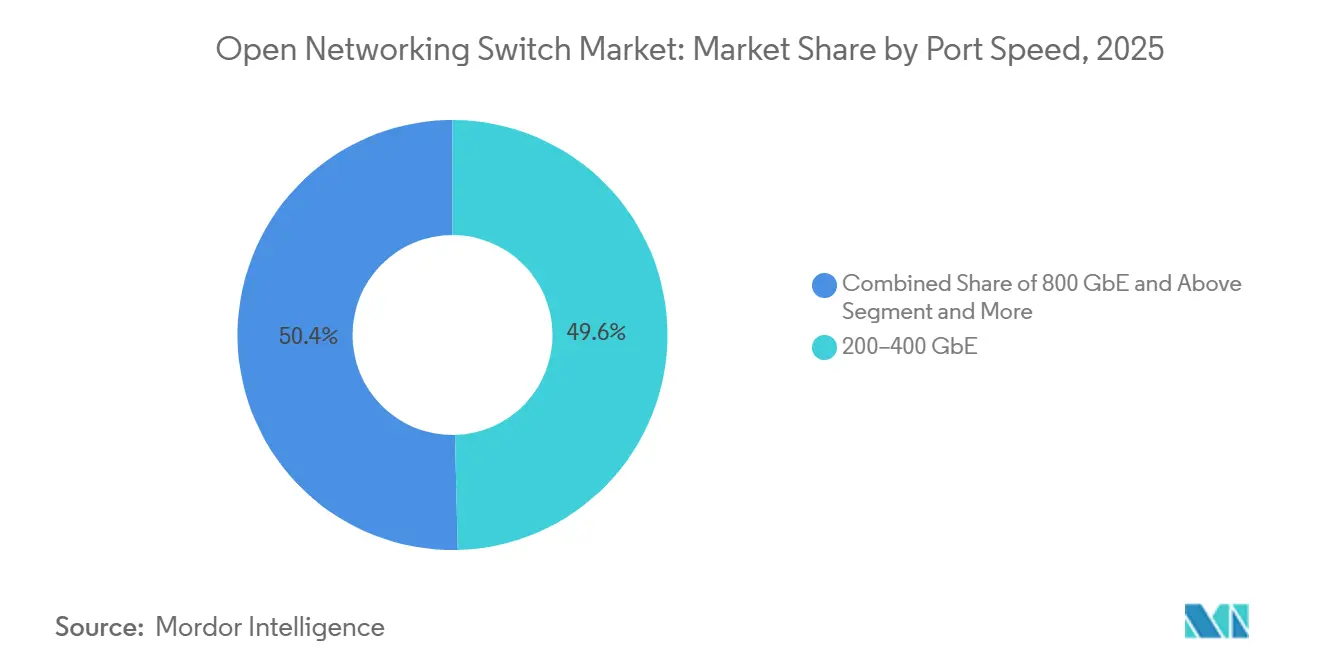
- By port speed, the 200 to 400 GbE tier commanded 49.62% of the open networking switch market share in 2025, while the 800 GbE and above tier is forecast to post a 24.62% CAGR through 2031.
- By form factor, fixed configuration platforms held 57.39% revenue share in 2025; high-density AI fabric switches are advancing at a 22.34% CAGR to 2031.
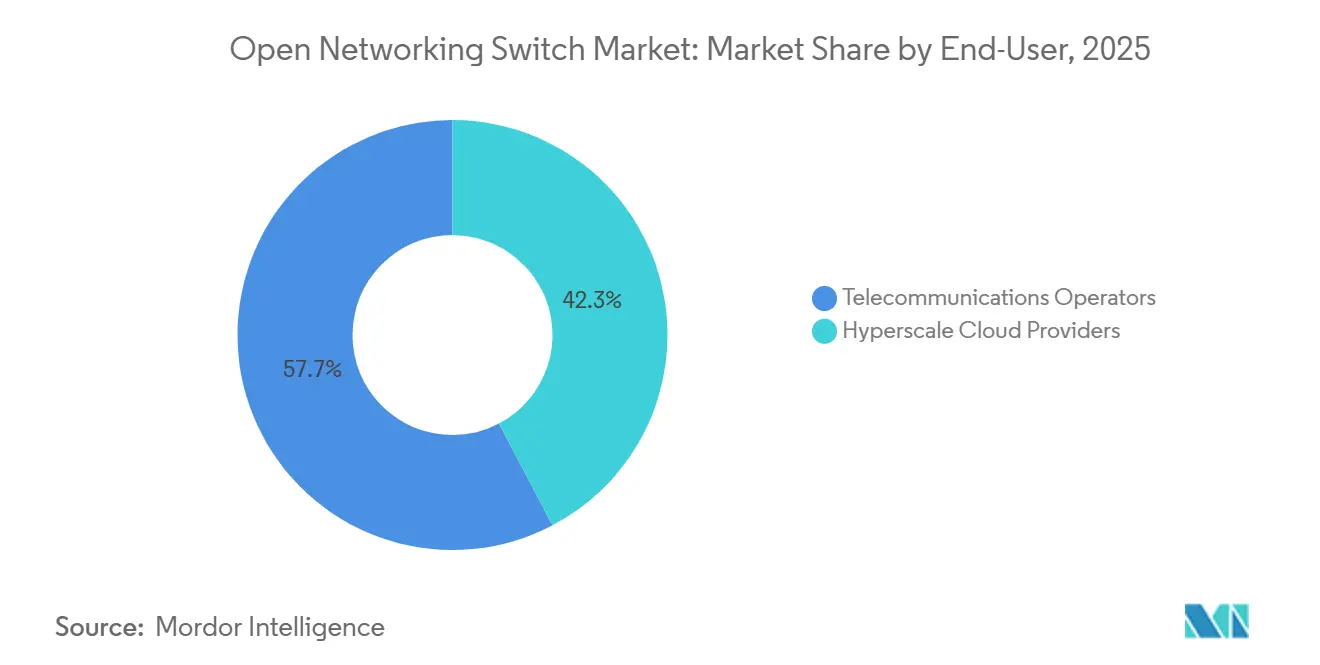
- By end user, hyperscale cloud providers accounted for 42.32% of 2025 revenue and are projected to grow at an 18.92% CAGR, outpacing telecommunications operators.
- By network operating system, proprietary commercial NOS retained 54.12% share in 2025, while SONiC-based platforms are on track for a 22.50% CAGR.
- By geography, North America captured 41.34% of 2025 revenue, whereas Asia-Pacific is set to expand at an 18.32% CAGR during 2026-2031.
Note: Market size and forecast figures in this report are generated using Mordor Intelligence’s proprietary estimation framework, updated with the latest available data and insights as of January 2026.
Global Open Networking Switch Market Trends and Insights
Drivers Impact Analysis*
| Driver | (~) % Impact on CAGR Forecast | Geographic Relevance | Impact Timeline |
|---|---|---|---|
| Hyperscaler Build-Outs for GenAI Clusters | 5.80% | Global, concentrated in North America and Asia-Pacific | Short term (≤ 2 years) |
| Surge in 400 G and 800 G Port Deployments | 4.20% | North America, Europe, Asia-Pacific | Medium term (2-4 years) |
| Accelerated Adoption of Disaggregated Architectures | 3.50% | Global, led by hyperscale providers | Medium term (2-4 years) |
| Open-Source NOS Maturity (SONiC) | 2.90% | Global, enterprise adoption lagging | Long term (≥ 4 years) |
| Vendor-Neutral Silicon Roadmaps | 2.10% | Global, Asia-Pacific ODM hubs | Long term (≥ 4 years) |
| Energy-Efficient Chiplets and Liquid Cooling | 1.60% | North America and Europe data centers | Medium term (2-4 years) |
| Source: Mordor Intelligence | |||
Hyperscaler Build-outs for GenAI Clusters
Generative AI training workloads are reshaping data center network design, increasing demand for switches that support all-to-all GPU communication without latency bottlenecks. Large-scale deployments in 2025 used hundreds of thousands of AI accelerators, each requiring dual 800 GbE uplinks to sustain sub-millisecond collective communication across clusters with more than 16,000 nodes. This shift favors non-blocking Clos topologies with high-radix spine switches, which scale more efficiently using white-box hardware and disaggregated operating systems. Parallel deployments in 2026 scaled toward 100,000 AI chips interconnected via SONiC-based switches, enabling faster hardware refresh cycles. The resulting capital intensity is driving market concentration, as hyperscalers amortize infrastructure costs, while smaller providers face margin compression or potential exit from AI infrastructure.[1]Microsoft Corporation, “Azure AI Infrastructure Project Rainier,” microsoft.com
Surge in 400G and 800G Port Deployments
The transition from 100 GbE to 400 GbE and 800 GbE Ethernet marks the fastest port-speed upgrade cycle in data center history, compressing adoption timelines from 7 years to nearly 3 years. The IEEE 802.3df-2024 standard established interoperability for 400 Gbps and 800 Gbps layers, accelerating the maturity of the multi-vendor ecosystem. New switch silicon integrates up to 64 800 GbE ports on a single advanced-node die, reducing per-port power consumption to roughly 8.5 watts, down from 12 watts in prior 400 GbE designs. Parallel silicon platforms delivering 51.2 Tbps throughput are targeting telco edge deployments where hyperscaler-focused vendors have limited presence. The economic viability of 800 GbE depends on optics pricing declining from USD 3,500 in 2025 to below USD 1,500 by 2028 to reach total cost parity.[2] Institute of Electrical and Electronics Engineers, “IEEE 802.3df-2024 Standard,” ieee.org
Accelerated Adoption of Disaggregated Hardware-Software Architectures
Disaggregation separates switching silicon from network operating systems, allowing operators to optimize hardware refresh cycles independently from software innovation. This model has moved into production scale; by 2025, more than 52% of core network traffic in large carrier environments was routed through disaggregated platforms combining bare-metal hardware with third-party operating systems, supporting revenue-critical workloads. Open networking is also extending into radio access networks, where deployments using SONiC-based switches interconnect multi-vendor radio units on commercial-off-the-shelf servers, meeting latency budgets of around 160 microseconds. This shift enables original design manufacturers to capture 30–40% gross margins by engaging directly with operators. However, supply chain dependencies remain a structural risk, where delays in switching silicon availability can disrupt multiple downstream deployments simultaneously.[3]Linux Foundation, “SONiC Ecosystem Growth,” linuxfoundation.org
Open-Source NOS Maturity (SONiC, Open-NOS)
SONiC’s transition from an internal project to a Linux Foundation–governed initiative in 2022 accelerated ecosystem maturity and narrowed the feature gap with proprietary network operating systems. The platform now includes more than 4,250 contributors across 520 organizations, with large-scale deployments enabling automated fabric provisioning that reduced mean time to service from 6 hours to 14 minutes. Telecom operators deploying SONiC-based switches reported up to 60% lower software licensing costs and faster security patch cycles within 48 hours, compared with the typical 90-day vendor timelines. Enterprise-grade distributions achieved FIPS 140-2 and USGv6 compliance in 2025, removing regulatory barriers. The remaining friction lies in fragmented operational tooling, which increases incident resolution time by 30% to 50%.[4]Alpha Networks Inc., “Liquid-Cooled 1.6 Tbps Switch Demonstration,” alphanetworks.com
Restraints Impact Analysis*
| Restraint | (~) % Impact on CAGR Forecast | Geographic Relevance | Impact Timeline |
|---|---|---|---|
| Ethernet PHY Power Density Bottlenecks above 1.6 Tbps | -2.80% | Global, acute in high-density AI clusters | Short term (≤ 2 years) |
| Fragmented NOS Certification and Support | -1.90% | Europe and North America enterprises | Medium term (2-4 years) |
| Supply-Chain Exposure to Single-Vendor ASICs | -1.50% | Global, Asia-Pacific ODM hubs | Long term (≥ 4 years) |
| Security Hardening Gaps in Open Stacks | -1.20% | North America and Europe regulated sectors | Medium term (2-4 years) |
| Source: Mordor Intelligence | |||
Ethernet PHY Power Density Bottlenecks above 1.6 T
Physical-layer signaling at 1.6 Tbps and beyond is constrained by thermal dissipation limits that conventional air cooling cannot address, forcing architectural changes that increase system complexity and cost. Emerging standards under development for 200 Gbps to 1.6 Tbps reveal that electrical SerDes power consumption scales non-linearly, already reaching about 18 watts per 800 GbE port and projected to exceed 35 watts at 1.6 Tbps without optical integration. Early deployments of liquid-cooled switch systems demonstrate the ability to dissipate over 1.8 kilowatts per board, but require chilled-water infrastructure that is available in fewer than 15% of current data centers, limiting near-term scalability.
Co-packaged optics offer a structural efficiency gain by reducing optical module power consumption by nearly 70% through the elimination of electrical retimers, but manufacturing constraints remain a barrier. Advanced photonics packaging yields are below 60%, preventing cost competitiveness with pluggable optics before 2028. This bottleneck is most acute in AI fabric switches, where high-density configurations such as 64 ports of 800 GbE or 32 ports of 1.6 Tbps are required. As a result, operators may delay next-generation upgrades, extending the lifecycle of 400 GbE platforms by 18 to 24 months while awaiting improvements in thermal management and production yields.
Fragmented NOS Certification and Support Ecosystem
Open-source network operating systems lack unified conformance testing and vendor-grade support, creating friction for enterprise deployment beyond hyperscale environments. No standardized certification suite validates interoperability across major silicon families, forcing operators to conduct bespoke qualification cycles lasting 12 to 18 months and requiring specialized expertise available in fewer than 5% of enterprise IT teams. Security governance is another constraint; critical vulnerabilities disclosed in 2024, including high-severity remote code execution risks, highlight that community-driven patching can lag commercial vendor response cycles by 30 to 60 days, increasing exposure in production environments handling sensitive workloads.
Vendors are attempting to bridge this gap by offering enterprise-hardened distributions with integrated orchestration layers, delivering 60% to 70% cost reductions compared to proprietary platforms. However, these solutions introduce a trade-off by reintroducing vendor lock-in, undermining the core value proposition of open networking. In telecom environments, integration complexity is amplified; deployments of SONiC-based switches have required extensive customization with legacy operations support systems, with implementation timelines extending to 14 months and resource consumption equivalent to deploying multiple times the number of traditional switches.
*Our forecasts treat driver/restraint impacts as directional, not additive. The impact forecasts reflect baseline growth, mix effects, and variable interactions.
Segment Analysis
By Port Speed: 800 GbE Ascent Reshapes Fabric Economics
The 200 to 400 GbE tier accounted for 49.62% of the open networking switch market in 2025, reflecting rapid migration from legacy 100 GbE as data center traffic intensified with cloud-native and AI workloads. This band remains the volume anchor due to balanced cost, power efficiency, and ecosystem maturity across optics and switching silicon. However, the 800 GbE and above tier is projected to grow at a 24.62% CAGR, driven by GPU clusters requiring sub-250 ns spine latency and high-radix, non-blocking architectures. Large-scale deployments have validated radix-64 fabrics as the preferred topology for sustaining east-west traffic without oversubscription penalties.
The economic inflection point for 800 GbE adoption is closely linked to the trajectories of optics costs and power-efficiency improvements. Co-packaged optics architectures integrated into next-generation switch silicon reduce per-port power consumption from 8.5 W to approximately 5.2 W, while enabling dense 64-port 800 GbE configurations within standard thermal envelopes. These gains also free faceplate capacity, improving rack-level throughput density. However, widespread adoption depends on optical module pricing declining below USD 1,500 by 2028, a threshold required to achieve total cost parity with pluggable alternatives and unlock large-scale enterprise and hyperscale deployment cycles.


By Form Factor: AI Fabric Switches Challenge Modular Chassis
Fixed configuration switches accounted for 57.39% of revenue in 2025, reflecting their cost efficiency, ease of deployment, and suitability for mainstream cloud and enterprise workloads. However, AI fabric appliances are expanding at a 22.34% CAGR as infrastructure requirements shift toward high-density, low-latency GPU interconnects. Emerging specifications such as NVLink-over-Ethernet require 102.4 Tbps radix-64 spine architectures that exceed the physical and thermal limits of 1RU fixed systems. Early 1.6 Tbps liquid-cooled prototypes demonstrate heat dissipation levels near 1.8 kW per board, underscoring why traditional air-cooled modular chassis designs face scaling constraints in next-generation AI environments.
The disaggregated modular segment is positioning itself as a hybrid model, combining chassis-level flexibility with white-box cost structures. Platforms built on advanced routing silicon deliver up to 14.4 Tbps throughput, addressing mid-tier telecom operators that prioritize long lifecycle infrastructure spanning 15 years. This approach enables incremental slot-level upgrades while maintaining compatibility with open networking operating systems. Despite increasing competition, AI fabric switches are expected to sustain gross margins near 40% in the near term due to limited supplier availability and high performance requirements, although standardization initiatives are likely to compress pricing over time.
By End-User: Hyperscalers Outpace Telcos in Deployment Velocity
Hyperscale cloud providers accounted for 42.32% of the open networking switch market in 2025 and are projected to grow at an 18.92% CAGR through 2031, driven by concentrated capital expenditure in AI infrastructure. Large-scale investments include multi-billion-dollar data center expansions and deployments of hundreds of thousands of AI accelerators, each requiring dual 800 GbE connectivity to sustain high-performance training clusters. This segment is structurally advantaged by rapid infrastructure refresh cycles of approximately 24 months, enabling faster adoption of next-generation networking technologies. In contrast, telecommunications operators are modernizing networks more gradually, despite routing a majority of production traffic through disaggregated architectures, due to longer upgrade cycles and operational constraints.
Telecommunications adoption remains constrained by integration complexity, even as operators deploy multi-vendor architectures and AI-driven network control systems. Core network transformation timelines extend through 2028, reflecting the difficulty of integrating open networking with legacy operational systems. Small and medium enterprises face an acute capability gap, with fewer than 5% possessing the expertise required to deploy SONiC-based networks, creating a service opportunity for managed providers. Government and public sector adoption is improving following compliance certifications achieved in 2025, although budget cycles of approximately 7 years limit deployment speed. Targeted public funding initiatives are expected to partially offset these constraints and accelerate adoption in telecom environments.
By Network Operating System: SONiC Gains as Proprietary Platforms Defend Installed Base
Proprietary commercial network operating systems held 54.12% market share in 2025, reflecting enterprise reliance on vendor-supported platforms with integrated management, telemetry, and lifecycle tooling. However, SONiC-based distributions are projected to grow at a 22.50% CAGR through 2031 as ecosystem maturity improves and feature gaps narrow. The contributor scale has expanded to over 4,250 individuals across 520 organizations, accelerating development velocity to near parity with proprietary platforms. Large-scale deployments have demonstrated operational benefits, including a reduction in mean time to service from 6 hours to 14 minutes through automated provisioning. Compliance barriers have also declined, with enterprise distributions achieving FIPS 140-2 and USGv6 certifications, enabling adoption in regulated sectors previously dependent on proprietary systems.
In parallel, hyperscalers are developing in-house network operating systems to eliminate vendor dependency and optimize performance at scale, leveraging white-box hardware ecosystems. Telecom adoption is progressing but remains constrained by integration complexity; deployments of SONiC-based infrastructure have required up to 14 months to integrate with legacy operational support systems, significantly longer than with proprietary alternatives. Security remains a material risk factor, as critical vulnerabilities with high severity scores have exposed gaps in patching timelines compared to those of commercial vendors. Industry collaboration initiatives are working to address these limitations by integrating low-latency transport protocols and enhancing operational tooling, positioning open-source platforms for broader adoption across AI and high-performance networking environments.
Geography Analysis
North America accounted for 41.34% of 2025 revenue, driven by hyperscaler concentration in major data center hubs across Virginia, Oregon, and Texas. The region benefits from accelerated 24-month infrastructure refresh cycles and early adoption of 800 GbE, enabling rapid scaling of AI and cloud workloads. High-density AI fabric deployments sustain demand despite component cost inflation, as operators prioritize performance and latency over near-term cost efficiency. This dynamic reinforces North America’s structural leadership, with hyperscalers dictating technology transitions, influencing vendor roadmaps, and accelerating the commercialization of next-generation switching architectures ahead of global peers.
Asia-Pacific is projected to grow at an 18.32% CAGR through 2031, supported by large-scale investments in AI-ready infrastructure and hyperscale expansion. Deployments are scaling toward clusters of up to 100,000 accelerators interconnected via SONiC-based switches, indicating strong adoption of disaggregated networking models. Government-led supply chain localization in China and India is expected to stimulate domestic ASIC development, potentially reducing dependence on incumbent silicon providers. This regional shift introduces competitive pressure on established suppliers while strengthening local ecosystems, particularly as sovereign cloud initiatives and data localization requirements continue to influence infrastructure investment strategies.
Europe faces structural constraints from elevated energy costs and regulatory complexity, limiting hyperscale expansion relative to North America and Asia-Pacific. However, telecom-driven deployments in 5G transport networks provide stable demand for open networking solutions, partially offsetting enterprise slowdown. The Middle East and Africa remain early-stage markets, primarily driven by hyperscaler entry points in select countries, with limited enterprise adoption. South America shows localized growth in Brazil, where latency-sensitive fintech workloads are driving demand for higher-speed switching, though broader regional expansion remains contingent on macroeconomic stability and infrastructure investment capacity.

Competitive Landscape
Original design manufacturers account for more than 60% of hyperscale white-box switch shipments, reflecting a structural shift toward disaggregated supply chains. Vendors such as Edgecore, Accton, and Quanta Cloud Technology leverage Taiwan’s contract manufacturing ecosystem to deliver lead times near 8 weeks while sustaining gross margins of 30% to 40% on 800 GbE platforms. Merchant silicon supply remains highly concentrated, with a dominant share fabricated through a single advanced foundry partner. This creates systemic supply chain risk, as any disruption in wafer production or packaging capacity can propagate across multiple OEM and ODM customers simultaneously.
Alternative silicon platforms from other vendors provide diversification but lack comparable ecosystem maturity, particularly in software compatibility and deployment tooling. Enterprise-focused distributions of open networking operating systems have achieved regulatory certifications such as FIPS 140-2, enabling adoption in compliance-sensitive sectors. However, operational complexity remains a barrier, with fewer than 5% of enterprises possessing the internal expertise required to manage fully disaggregated stacks. Vendors offering integrated SONiC-based solutions with orchestration layers are attempting to bridge this gap by simplifying deployment and lifecycle management, albeit at the cost of partial reintroduction of vendor dependency.
Competitive dynamics are shifting away from hardware differentiation toward software, services, and ecosystem integration. Partnerships between hardware vendors and network software providers are enabling specialized use cases such as AI-optimized routing and photonics-based interconnects for long-distance data transfer. The market structure remains moderately concentrated, with the top five vendors accounting for approximately 65% of total revenue, indicating a controlled but competitive environment. As standardization initiatives progress and multi-vendor interoperability improves, pricing pressure is expected to increase, gradually compressing margins while expanding total addressable adoption.
Open Networking Switch Industry Leaders
Cisco Systems, Inc.
NVIDIA Corporation
Arista Networks, Inc.
Huawei Technologies Co., Ltd.
Hewlett Packard Enterprise Company
- *Disclaimer: Major Players sorted in no particular order

Recent Industry Developments
- February 2026: Edgecore launched AIS1600-64O and AIS800-128O switches powered by Broadcom Tomahawk 6, offering 102.4 Tbps throughput.
- March 2026: Arrcus and UfiSpace announced joint AI-optimized switching solutions that pair ArcOS with 800 GbE white-box hardware.
- April 2026: Alibaba Cloud and China Telecom started rolling out 10,000 Zhenwu AI chips in Shaoguan, scaling toward 100,000 units with SONiC-based fabrics.
- April 2026: Edgecore and NTT began deploying IOWN all-photonics interconnects between Taiwan and Japan using disaggregated switches for cross-regional AI training.


Global Open Networking Switch Market Report Scope
The Open Networking Switch Market refers to Ethernet switching infrastructure built on disaggregated architectures where switching hardware (bare-metal or white-box) is decoupled from the network operating system and control software. These switches typically use merchant silicon and support open or third-party network operating systems such as SONiC, enabling operators to customize features, accelerate innovation cycles, and reduce total cost of ownership compared to proprietary, vertically integrated solutions. The market includes fixed and modular switches deployed across data centers, telecom networks, and enterprise environments, supporting high-speed connectivity from 100 GbE to 800 GbE and beyond. Growth is driven by hyperscale cloud demand, software-defined networking adoption, and the need for scalable, vendor-agnostic infrastructure aligned with AI and high-performance computing workloads.
The Open Networking Switch Market Report is Segmented by Port Speed (1 GbE and Below, 10 to 25 GbE, 40 to 100 GbE, 200 to 400 GbE, 800 GbE and Above), Form Factor (Fixed Configuration, Modular Chassis, Disaggregated Modular Platforms, and High-Density AI Fabric Switches), End-User (Hyperscale Cloud Providers, Telecommunications Operators, Large Enterprises, Small and Medium Enterprises, and Government and Public Sector), Network Operating System (Proprietary Commercial NOS, SONiC-based NOS, Cumulus Linux-based NOS, P4-Programmable or SDN NOS, and In-house Developed NOS), and Geography (North America, South America, Europe, Asia-Pacific, Middle East, Africa). The Market Forecasts are Provided in Terms of Value (USD).
| 1 GbE and Below |
| 10–25 GbE |
| 40–100 GbE |
| 200–400 GbE |
| 800 GbE and Above |
| Fixed Configuration Switches |
| Modular Chassis Switches |
| Disaggregated Modular Platforms |
| High-Density AI Fabric Switches |
| Hyperscale Cloud Providers |
| Telecommunications Operators |
| Large Enterprises |
| Small and Medium Enterprises |
| Government and Public Sector |
| Proprietary Commercial NOS |
| SONiC-based NOS |
| Cumulus Linux-based NOS |
| P4-Programmable / SDN NOS |
| In-house Developed NOS |
| North America | United States |
| Canada | |
| Mexico | |
| South America | Brazil |
| Argentina | |
| Rest of South America | |
| Europe | United Kingdom |
| Germany | |
| France | |
| Italy | |
| Spain | |
| Russia | |
| Rest of Europe | |
| Asia-Pacific | China |
| Japan | |
| India | |
| South Korea | |
| Australia | |
| Singapore | |
| Rest of Asia-Pacific | |
| Middle East | Saudi Arabia |
| United Arab Emirates | |
| Israel | |
| Turkey | |
| Rest of Middle East | |
| Africa | South Africa |
| Nigeria | |
| Kenya | |
| Egypt | |
| Rest of Africa |
| By Port Speed | 1 GbE and Below | |
| 10–25 GbE | ||
| 40–100 GbE | ||
| 200–400 GbE | ||
| 800 GbE and Above | ||
| By Form Factor | Fixed Configuration Switches | |
| Modular Chassis Switches | ||
| Disaggregated Modular Platforms | ||
| High-Density AI Fabric Switches | ||
| By End-User | Hyperscale Cloud Providers | |
| Telecommunications Operators | ||
| Large Enterprises | ||
| Small and Medium Enterprises | ||
| Government and Public Sector | ||
| By Network Operating System | Proprietary Commercial NOS | |
| SONiC-based NOS | ||
| Cumulus Linux-based NOS | ||
| P4-Programmable / SDN NOS | ||
| In-house Developed NOS | ||
| By Geography | North America | United States |
| Canada | ||
| Mexico | ||
| South America | Brazil | |
| Argentina | ||
| Rest of South America | ||
| Europe | United Kingdom | |
| Germany | ||
| France | ||
| Italy | ||
| Spain | ||
| Russia | ||
| Rest of Europe | ||
| Asia-Pacific | China | |
| Japan | ||
| India | ||
| South Korea | ||
| Australia | ||
| Singapore | ||
| Rest of Asia-Pacific | ||
| Middle East | Saudi Arabia | |
| United Arab Emirates | ||
| Israel | ||
| Turkey | ||
| Rest of Middle East | ||
| Africa | South Africa | |
| Nigeria | ||
| Kenya | ||
| Egypt | ||
| Rest of Africa | ||


Key Questions Answered in the Report
How big is the open networking switch market today, and how fast is it growing?
The sector reached USD 13.8 billion in 2025 and is expected to grow to USD 16.5 billion in 2026. It is projected to hit USD 37.24 billion by 2031, reflecting a 17.68% CAGR (2026–2031), driven primarily by hyperscaler investment in generative AI infrastructure and terabit-scale networking.
Which port-speed tier is expanding the quickest, and what is driving it?
800 GbE and higher-speed switches are projected to grow at a 24.62% CAGR (2026–2031), outpacing all other tiers. Demand is driven by GPU-dense AI clusters requiring lossless, non-blocking fabrics. Microsoft’s Fairwater campus adopted 800 GbE in 2025 to maintain ~250 ns spine latency. Broadcom’s 102.4-Tbps Tomahawk 6 ASIC, launched in mid-2025, underpins the required port density and throughput.
Where are the brakes on growth?
Growth faces constraints: thermal limits above 1.6 Tbps per port reduce CAGR by ~2.8 points, as liquid-cooled prototypes require ~1.8 kW per board, a capacity available in <15% of data centers; fragmented open NOS certification cycles cut ~1.9 points due to year-long enterprise validation; and Broadcom’s reliance on a single TSMC source creates a supply bottleneck, trimming another ~1.5 points.
Which region is set to grow the fastest?
Asia-Pacific leads with an expected 18.32% CAGR through 2031. India’s Reliance and Adani each earmarked more than USD 100 billion for AI-ready data centers, while Alibaba Cloud began wiring 10,000 Zhenwu AI chips into a new Shaoguan site in 2026—all connected by SONiC-based white-box switches.
Page last updated on:


