Enterprise Network Switch Market Size and Share
Market Overview
| Study Period | 2020 - 2031 |
|---|---|
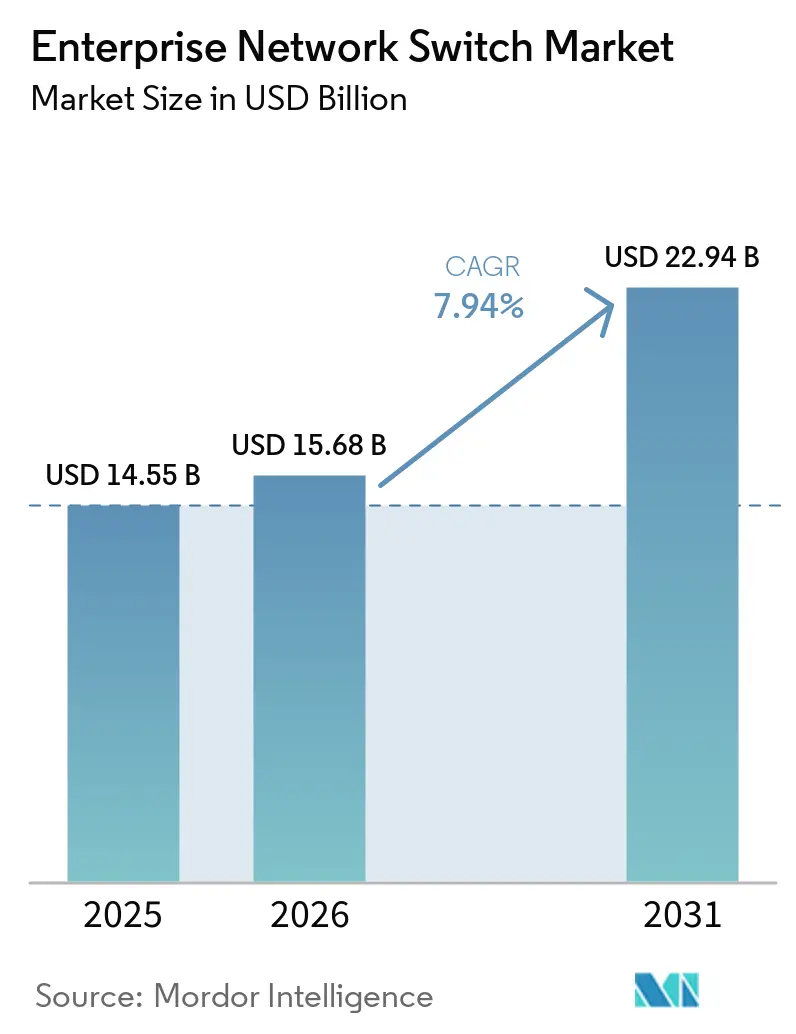
| Market Size (2026) | USD 15.68 Billion |
| Market Size (2031) | USD 22.94 Billion |
| Growth Rate (2025 - 2030) | 7.94% CAGR |
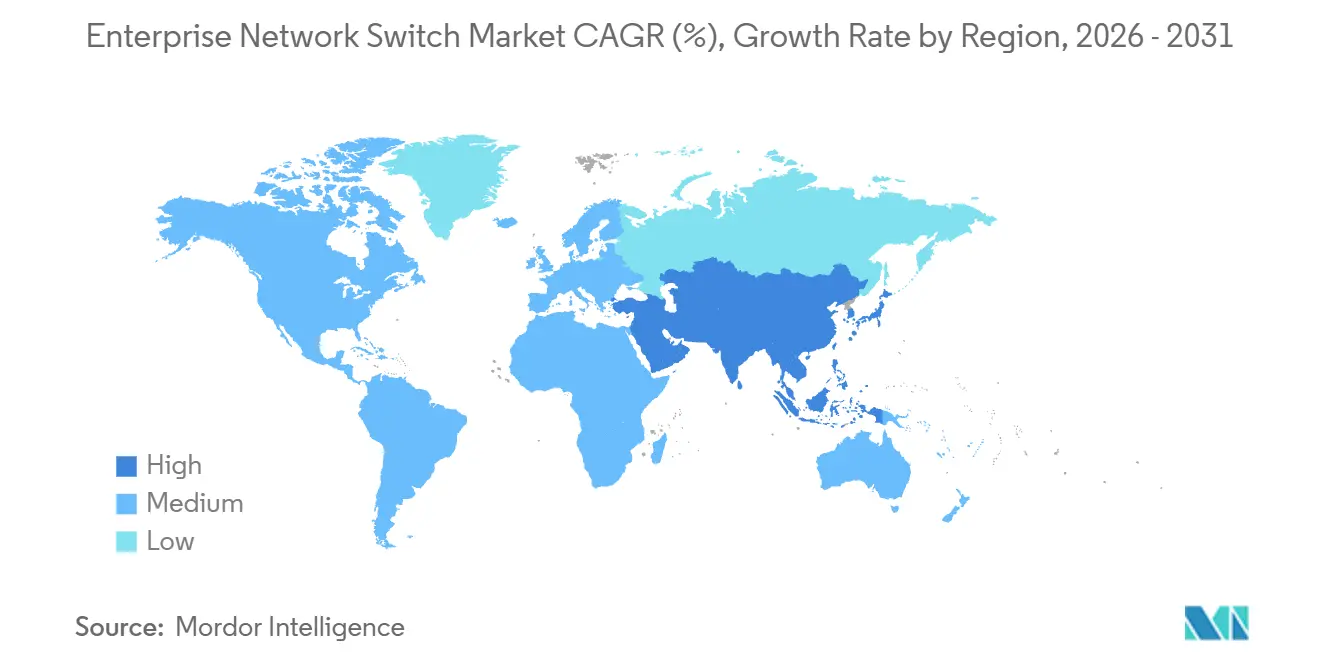
| Fastest Growing Market | Asia Pacific |
| Largest Market | North America |
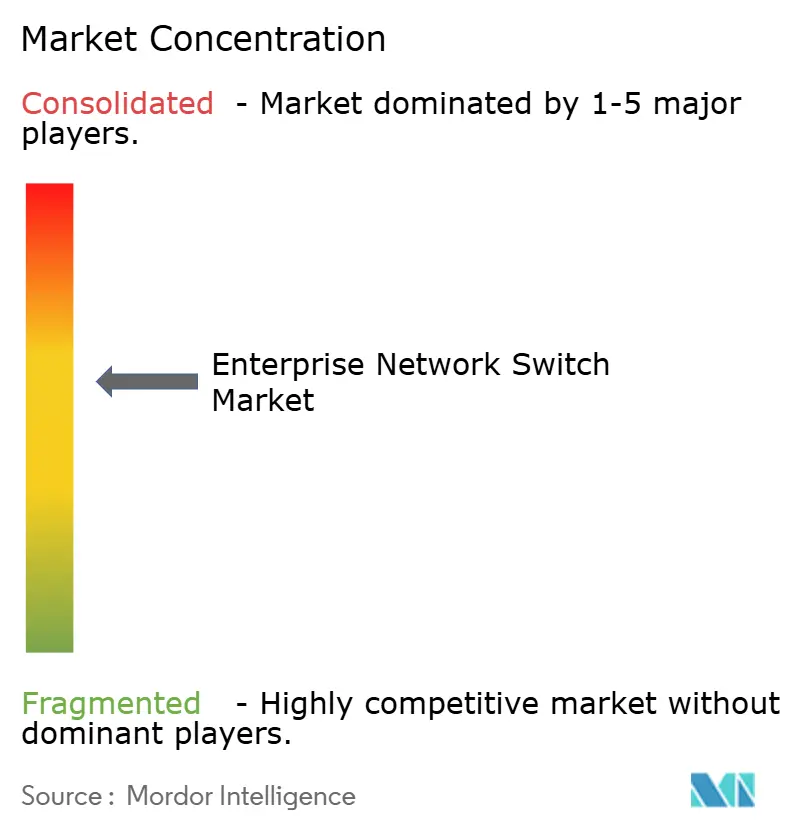
| Market Concentration | Medium |
Major Players *Disclaimer: Major Players sorted in no particular order Image © Mordor Intelligence. Reuse requires attribution under CC BY 4.0. | |
Enterprise Network Switch Market Analysis by Mordor Intelligence
The enterprise network switch market size is expected to be USD 14.55 billion in 2025, USD 15.68 billion in 2026, and reach USD 22.94 billion by 2031, growing at a CAGR of 7.94% from 2026 to 2031. Robust hyperscaler buildouts continue to absorb switching capacity, but power-grid constraints are steering buyers toward high-density 400 GbE and 800 GbE fabrics that maximize every rack unit. Geopolitical fragmentation, including the December 2024 revocation of licenses for select Chinese vendors, is accelerating diversification to Cisco Systems, Arista Networks, and Juniper Networks. Modular chassis demand is rising as data center operators favor pay-as-you-grow architectures, while campus and branch sites keep fixed switches dominant. Semiconductor lead-time volatility remains a structural risk that forces original equipment manufacturers to pre-commit wafer allocations and limits the agility of smaller challengers.
Key Report Takeaways
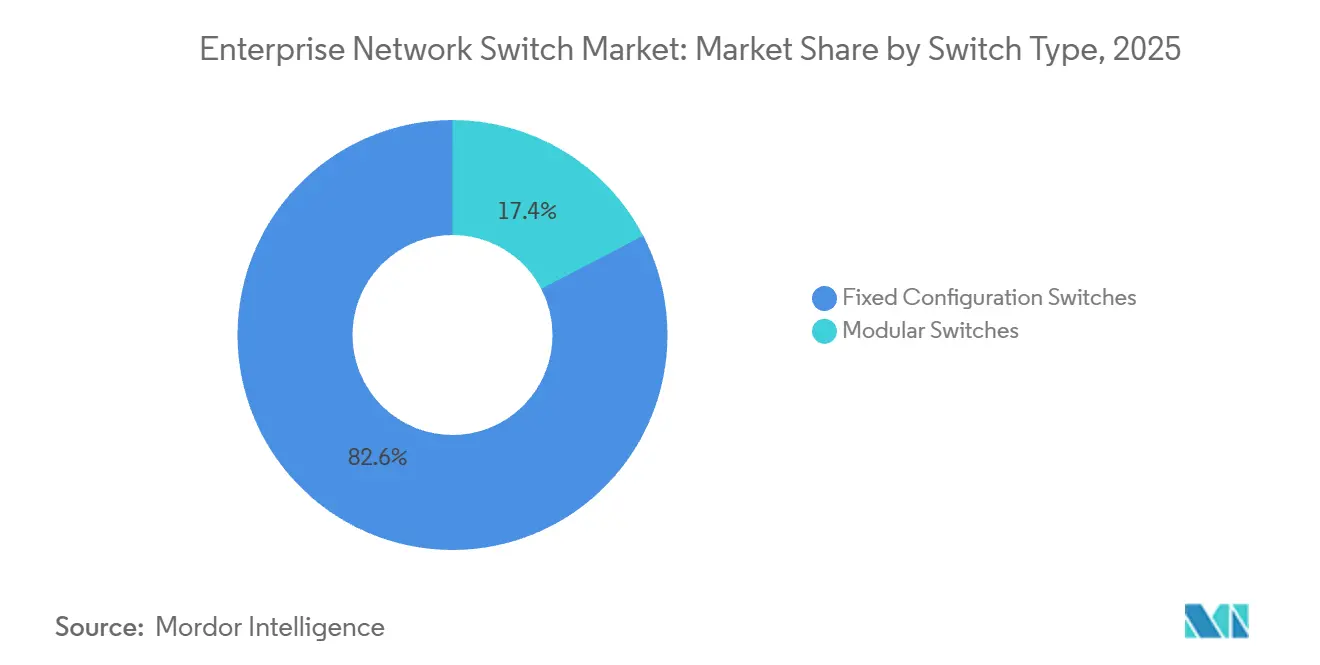
- By switch type, fixed configuration switches held 82.64% of the enterprise network switch market share in 2025, while modular switches are advancing at a 9.26% CAGR through 2031.
- By port speed, legacy 1 GbE and below ports accounted for 41.72% of the enterprise network switch market size in 2025, and 2.5 GbE and 5 GbE multi-gigabit ports are expanding at an 11.48% CAGR to 2031.
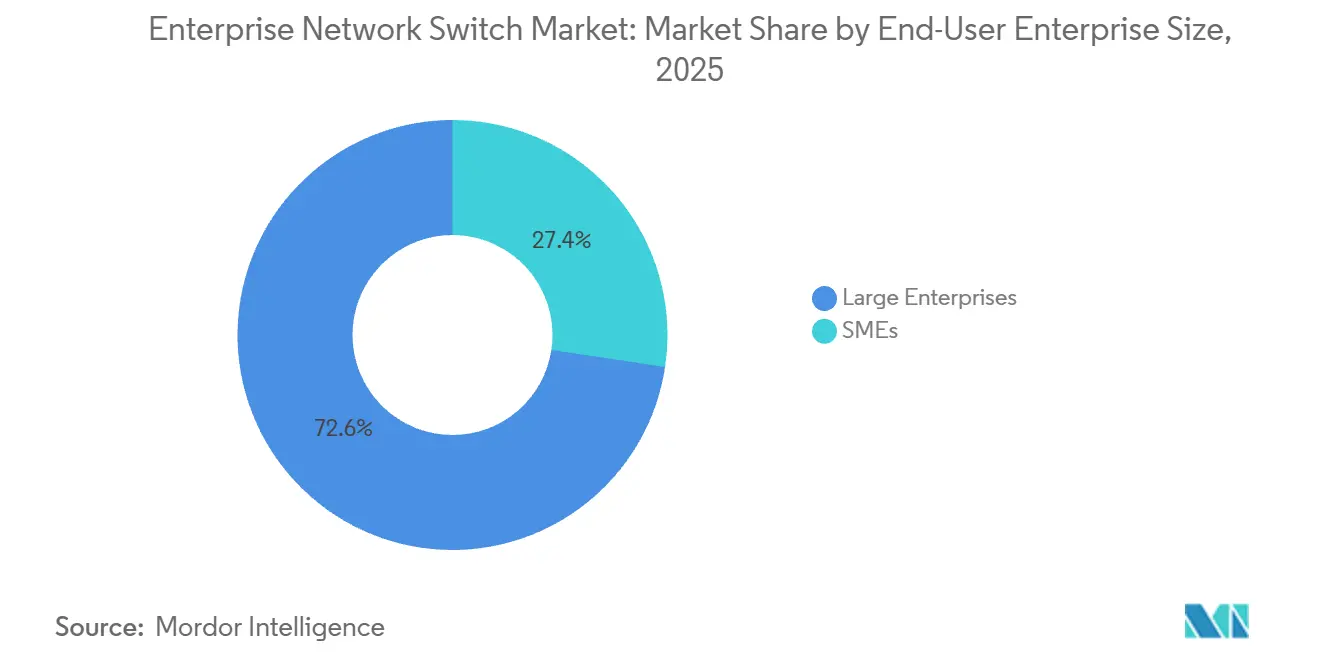
- By end-user enterprise size, large enterprises captured 72.62% revenue in 2025, yet the small and medium-sized enterprise segment is projected to register a 10.12% CAGR through 2031.
- By end-user industry, IT and telecommunications commanded 24.72% revenue share in 2025, whereas manufacturing is forecast to grow at a 9.04% CAGR between 2026 and 2031.
- By geography, North America retained 36.44% geographic revenue in 2025, while Asia-Pacific is poised to post the fastest 9.52% CAGR over the forecast period.
Note: Market size and forecast figures in this report are generated using Mordor Intelligence’s proprietary estimation framework, updated with the latest available data and insights as of January 2026.
Global Enterprise Network Switch Market Trends and Insights
Drivers Impact Analysis*
| Driver | (~) % Impact on CAGR Forecast | Geographic Relevance | Impact Timeline |
|---|---|---|---|
| Surge in Cloud Data Center Expansions | +2.10% | Global, concentrated in North America, Asia-Pacific core markets | Medium term (2-4 years) |
| Increasing Enterprise Adoption of IoT Devices | +1.80% | Global, with accelerated uptake in Asia-Pacific manufacturing hubs and North America smart buildings | Long term (≥ 4 years) |
| Migration to Higher Port Speeds (25/40/100 GbE) | +2.30% | Global, led by North America and Europe hyperscale data centers, spillover to Asia-Pacific | Short term (≤ 2 years) |
| Growing Demand for Network Security Segmentation | +1.60% | North America and Europe driven by regulatory mandates, expanding to Asia-Pacific financial services | Medium term (2-4 years) |
| Integration of Network Telemetry and AI-Driven Switch ASICs | +1.40% | North America and Europe early adopters, Asia-Pacific following in telecommunications and cloud sectors | Long term (≥ 4 years) |
| Open-Source NOS Accelerating White-Box Switch Adoption | +1.20% | Global hyperscale data centers, North America and Asia-Pacific leading, limited Europe penetration | Medium term (2-4 years) |
| Source: Mordor Intelligence | |||
Surge in Cloud Data Center Expansions
Hyperscalers booked cumulative capital expenditure of USD 690 billion across 2024-2026, and switching infrastructure consistently captures close to 10% of that outlay. Operators face grid-supply delays that push them to double bandwidth per rack unit using 400 GbE and 800 GbE fabrics, a trend underlined by Microsoft’s disclosed USD 80 billion construction backlog. Google plans to install native 800 GbE switches in new availability zones during 2026 to cut switch count by 40%.[1]Cisco Systems Inc., “Product Documentation and Investor Updates,” CISCO.COM Arista Networks, in turn, released 51.2 Tbps chassis switches in late 2025 to win these refresh cycles. The density imperative drives incremental orders for modular switches that allow line-card swaps without forklift upgrades, reinforcing the uptick in modular CAGR.
Increasing Enterprise Adoption of IoT Devices
Enterprise connected-device counts exceeded 15 billion units by end-2025, spanning industrial sensors, medical telemetry, and smart-building controllers. Healthcare facilities alone operate more than 1 billion networked medical devices that demand strict virtual LAN isolation. Manufacturers rolling out Industry 4.0 initiatives turned to time-sensitive networking switches certified under the IEEE 802.1 profile finalized in 2024.[2]IEEE Standards Association, “802.11be WiFi 7 and 802.1 TSN Profiles,” STANDARDS.IEEE.ORG Retail chains and campuses are upgrading edge switches to support WiFi 6E and WiFi 7 access points that require multi-gig uplinks exceeding 60 W per port. This sprawling device footprint inflates attack surfaces, which prompts investment in switches with hardware-accelerated access-control lists and cloud-managed onboarding, fueling the driver’s long-term influence.
Migration to Higher Port Speeds (25 / 40 / 100 GbE)
Enterprises compressed speed transitions as optics prices fell; 25 GbE single-lane transceivers now cost under USD 50, displacing 10 GbE in many server closets. Ethernet Alliance data show 100 GbE switch shipments overtook 10 GbE units in 2025. Arista reported that 400 GbE platforms already account for 30% of its data center revenue, and first-wave 800 GbE deployments support artificial-intelligence clusters. At the campus edge, multi-gig switches allow the reuse of existing Cat 5e and Cat 6 cabling, accelerating the fastest-growing segment. Broadcom’s end-to-end ASIC portfolio, from 1 GbE to 800 GbE, enables vendors to deliver consistent management across heterogeneous speeds.
Growing Demand for Network Security Segmentation
United States federal guidance updated in 2024 endorsed zero-trust architecture, triggering an enterprise rush toward micro segmentation. Banking institutions must isolate cardholder data networks in accordance with the Payment Card Industry Data Security Standard version 4.0, effective March 2024. Healthcare audits found 60% of breaches in 2025 leveraged flat network paths, spurring virtual LAN separation mandates. High-scale access-control list processing favors platforms with ternary content-addressable memory with more than 128k entries. Cisco TrustSec tagging and Arista’s macro-segmentation services simplify policy enforcement and firmly embed segmentation in mainstream purchase criteria.
Restraints Impact Analysis*
| Restraint | (~) % Impact on CAGR Forecast | Geographic Relevance | Impact Timeline |
|---|---|---|---|
| High Capital Expenditure Requirements | -1.90% | Global, acute in Europe and South America due to budget constraints, moderate in North America | Medium term (2-4 years) |
| Semiconductor Supply Chain Constraints | -1.70% | Global, most severe in North America and Europe dependent on Taiwan Semiconductor Manufacturing Company and Broadcom supply | Short term (≤ 2 years) |
| Flattening Enterprise Campus Refresh Cycles From WFH Efficiencies | -1.30% | North America and Europe, limited impact in Asia-Pacific where return-to-office mandates stronger | Medium term (2-4 years) |
| Geo-political Export Restrictions on Advanced Switch Chipsets | -1.10% | Asia-Pacific, Middle East, and Africa markets reliant on Huawei and ZTE, spillover to global supply chains | Long term (≥ 4 years) |
| Source: Mordor Intelligence | |||
High Capital Expenditure Requirements
A fully populated modular chassis with 400 GbE uplinks can exceed USD 150 000 before optics, a cost that translates to 15%-25% of annual information-technology budgets for many mid-market firms. Vendors are countering with hardware-as-a-service models such as Cisco Plus and HPE GreenLake, yet monthly subscriptions still force multi-year commitments. Limited vendor financing in South America and tighter monetary policy in Europe keep this restraint prominent through 2028.
Semiconductor Supply Chain Constraints
Advanced switch ASICs rely on concentrated 5 nm and 7 nm production at Taiwan Semiconductor Manufacturing Company. Broadcom’s Tomahawk 5 lead times stretched past 40 weeks in fiscal 2025 because wafer capacity was diverted to artificial-intelligence accelerators.[3]Broadcom Inc., “FY 2025 Results and Tomahawk 5 Roadmap,” BROADCOM.COM Marvell faced comparable delays for its Teralynx line. December 2024 export-control rules further restricted shipments of high-end networking silicon to China, disrupting global allocation patterns. Original equipment manufacturers must now pre-order wafers up to 18 months ahead, inflating inventory risk and reducing the flexibility to chase upside demand.
*Our forecasts treat driver/restraint impacts as directional, not additive. The impact forecasts reflect baseline growth, mix effects, and variable interactions.
Segment Analysis
By Switch Type: Modularity Strengthens Investment Protection
Fixed models kept an 82.64% enterprise network switch market share in 2025, but modular units are forecast to post a 9.26% CAGR to 2031. Modular switches captured a rising slice of the enterprise network switch market in data center and campus-core layers as operators valued in-chassis line-card upgrades over forklift replacements. Chassis such as Cisco Catalyst 9600 allow a 2024 buyer to migrate from 10 GbE to 100 GbE simply by sliding new cards, extending asset life, and curbing electronic waste. Hyperscalers also rely on 51.2 Tbps and 102.4 Tbps modular spines to interconnect hundreds of leaf switches in Clos fabrics.
Fixed switches remain dominant at the branch and access layers because 24 or 48-port density, integrated power-over-Ethernet, and sub-USD 500 entry points match small site economics. Cloud-managed variants from Cisco Meraki, Aruba Instant On, and NETGEAR Insight remove command-line complexity, letting small and medium-sized enterprises spin up networks in hours. The duality underscores divergent buyer priorities: data centers need scale and line-rate flexibility, while smaller footprints favor plug-and-play simplicity.


By Port Speed: Multi-Gigabit Surge Under WiFi 7 Rollout
The multi-gig category, already the fastest-growing segment, is set for an 11.48% CAGR through 2031, while 1 GbE and below still accounted for 41.72% of revenue in 2025. WiFi 7, certified under IEEE 802.11be, delivers a theoretical throughput of 46 Gbps, saturating 1 GbE uplinks and driving demand for 2.5 GbE and 5 GbE ports. Cisco Systems reported that 40% of Catalyst 9300 shipments now include multi-gig modules, underscoring the accelerating enterprise transition toward higher-speed access layers.
Higher in the stack, 100 GbE shipments surpassed 10 GbE for the first time in 2025, propelled by server upgrades and storage-area network refreshes. 400 GbE and early 800 GbE are taking hold in artificial-intelligence clusters, and white-box vendors are bundling Software for Open Networking in the Cloud on these ports to trim cost. Between access and core layers, the market therefore features a barbell of multi-gig upgrades on existing cabling and ultra-high-speed rollouts in data-intensive workloads.
By End-User Enterprise Size: SMEs Accelerate Cloud-Managed Adoption
Large organizations accounted for 72.62% of revenue in 2025, yet the small and medium-sized enterprise cohort is on track for a 10.12% CAGR through 2031. Remote work shifted large-enterprise spend toward WiFi and security rather than wholesale switch upgrades, lengthening refresh cycles from five to seven years. Conversely, SMEs are leaning on managed service providers that bundle hardware, software, and support into monthly subscriptions, removing upfront hurdles.
Entry-level cloud-managed switches now retail for less than USD 500, a price that puts enterprise features such as zero-touch provisioning within reach of firms with fewer than 50 employees. A 2025 Spiceworks survey found that 35% of United Kingdom SMEs outsource network management, up from 22% two years earlier. The resulting demand lifts volume for fixed and multi-gig switches that can be configured from simple web dashboards.
By End-User Industry: Manufacturing Leads OT-IT Convergence
Information technology and telecommunications accounted for 24.72% of the market in 2025 because service providers are both consumers and suppliers of switching gear. Manufacturing, however, is the fastest climber, with a forecast 9.04% CAGR, as Industry 4.0 retrofits swap proprietary fieldbus for deterministic Ethernet. IEEE-defined time-sensitive networking enables sub-1 ms latency, which German automotive plants credit for a 30% reduction in welding cell downtime.
Financial institutions are segmenting payment networks to comply with the Payment Card Industry Data Security Standard 4.0, while hospitals are adding isolated medical device VLANs to curb ransomware spread. Retail and e-commerce chains refresh access switches to power 8K surveillance and WiFi 6E guest networks. Government and defense agencies prioritize domestic sources under trusted-foundry rules, reinforcing spend with Cisco and select Juniper platforms. These sector-specific imperatives collectively diversify the enterprise network switch market demand profile.
Geography Analysis
North America accounted for 36.44% revenue in 2025 and remains the largest buyer as hyperscalers push high-density fabrics and federal zero-trust mandates widen segmentation rollouts. Microsoft’s USD 80 billion backlog highlights grid-supply bottlenecks that convert port-count growth into port-density optimization. Canada delivers moderate upside through banking and healthcare segmentation programs, though many mid-market refreshes now extend past six years.
Asia-Pacific is projected to register a 9.52% CAGR through 2031, outpacing all other regions. India’s National Infrastructure Pipeline earmarked USD 1.3 trillion for digital infrastructure and seeded metro Ethernet and smart-city contracts in second-tier cities.[4]Government of India, “National Infrastructure Pipeline Dashboard,” INDIA.GOV.IN China’s dual-circulation policy diverts demand to domestic vendors, but advanced ASIC export restrictions constrain access to cutting-edge silicon. Japan’s 2025 roadmap to achieve full Internet Protocol penetration in factories by 2027 propels time-sensitive networking investments, while Australia and South Korea expand 5G backhaul that rides on carrier-grade Ethernet switches.
Europe faces energy-cost inflation and macroeconomic uncertainty that stretches refresh cycles from 5 to 7 years, yet regulatory frameworks such as the Network and Information Security Directive 2 sustain security-driven replacements in banking and healthcare. South America and the Middle East and Africa remain nascent slices of the enterprise network switch market, but localized catalysts exist. Brazil’s Pix instant-payment rails require low-latency core switches, and Saudi Arabia’s Vision 2030 smart-city budgets fund campus-scale equipment in NEOM and Riyadh.

Competitive Landscape
Cisco Systems, Arista Networks, and Hewlett Packard Enterprise together accounted for the majority of 2025 revenue, resulting in moderate concentration in the enterprise network switch industry. Cisco safeguards its campus franchise through Catalyst software subscriptions and, with the 2025 completion of the Splunk acquisition, bundles observability that links network telemetry with application performance. Arista grew by double digits by leaning into 400 GbE leadership and embedding its extensible operating system across Amazon Web Services, Microsoft Azure, and Google Cloud fabrics.
White-box penetration surpassed 15% in hyperscale data centers during 2025 as Software for Open Networking in the Cloud matured. Microsoft publicly disclosed that more than 80% of Azure fabrics run the open network operating system, while Meta Platforms similarly standardized, pressuring traditional vendors to unbundle software. Cisco now offers IOS XR on a subscription basis for its 8000 series, and Arista licenses its operating system on third-party hardware.
Incumbents and challengers are converging on AIOps. Juniper integrated Mist AI across EX series to correlate wired and wireless telemetry, Hewlett Packard Enterprise embedded autonomous operations in Aruba CX 10000, and Dell positions PowerSwitch products around hyper-converged infrastructure niches. Industrial automation creates a white-space opportunity that Siemens and Rockwell address via joint certifications with Cisco. Fortinet leverages its security franchise to cross-sell FortiSwitch models, while Extreme Networks allies with Siemens for time-sensitive networking in automotive plants. Vendor strategies therefore range from silicon co-design to software-defined differentiation, intensifying the race for margin resilience.
Enterprise Network Switch Industry Leaders
Cisco Systems, Inc.
Arista Networks, Inc.
Hewlett Packard Enterprise Company
Huawei Technologies Co., Ltd.
Extreme Networks, Inc.
- *Disclaimer: Major Players sorted in no particular order

Recent Industry Developments
- January 2026: Arista Networks released the 7800R4 modular switch with 102.4 Tbps capacity and native 800 GbE ports, targeting hyperscale and artificial-intelligence clusters.
- December 2025: Cisco Systems completed its USD 28 billion Splunk acquisition and integrated network telemetry with application observability to deliver unified monitoring.
- November 2025: Hewlett Packard Enterprise launched the Aruba CX 10000 modular chassis with 51.2 Tbps switching fabric and embedded AIOps for automated remediation.
- September 2025: Extreme Networks partnered with Siemens to co-develop time-sensitive networking-certified switches for industrial automation.


Global Enterprise Network Switch Market Report Scope
The enterprise network switches market is the segment of the networking industry that designs, manufactures, and deploys switches for use in enterprise environments, such as corporate offices, campuses, and branch locations. These switches connect devices like computers, servers, Wi-Fi access points, and IoT systems, enabling secure, high-speed data communication and network management.
The Enterprise Network Switch Market Report is Segmented by Switch Type (Fixed Configuration Switches, and Modular Switches), Port Speed (1 GbE and Below, 2.5/5 GbE Multi-Gig, 10 GbE, 25/40 GbE, 100 GbE, and 400 GbE and Above), End-User Enterprise Size (Large Enterprises, and SMEs), End-User Industry (IT and Telecom, BFSI, Healthcare and Life Sciences, Manufacturing, Government and Defense, Education, Retail and E-commerce, and Other End-User Industries), and Geography (North America, South America, Europe, Asia-Pacific, Middle East, and Africa). The Market Forecasts are Provided in Terms of Value (USD).
| Fixed Configuration Switches |
| Modular Switches |
| 1 GbE and Below |
| 2.5/5 GbE Multi-Gig |
| 10 GbE |
| 25/40 GbE |
| 100 GbE |
| 400 GbE and Above |
| Large Enterprises |
| SMEs |
| IT and Telecom |
| BFSI |
| Healthcare and Lifesciences |
| Manufacturing |
| Government and Defense |
| Education |
| Retail and E-commerce |
| Other End-User Industries |
| North America | United States |
| Canada | |
| Mexico | |
| South America | Brazil |
| Argentina | |
| Rest of South America | |
| Europe | Germany |
| United Kingdom | |
| France | |
| Italy | |
| Spain | |
| Russia | |
| Rest of Europe | |
| Asia-Pacific | China |
| Japan | |
| India | |
| South Korea | |
| Australia and New Zealand | |
| Rest of Asia-Pacific | |
| Middle East | Saudi Arabia |
| United Arab Emirates | |
| Turkey | |
| Rest of Middle East | |
| Africa | South Africa |
| Nigeria | |
| Rest of Africa |
| By Switch Type | Fixed Configuration Switches | |
| Modular Switches | ||
| By Port Speed | 1 GbE and Below | |
| 2.5/5 GbE Multi-Gig | ||
| 10 GbE | ||
| 25/40 GbE | ||
| 100 GbE | ||
| 400 GbE and Above | ||
| By End-user Enterprise Size | Large Enterprises | |
| SMEs | ||
| By End-User Industry | IT and Telecom | |
| BFSI | ||
| Healthcare and Lifesciences | ||
| Manufacturing | ||
| Government and Defense | ||
| Education | ||
| Retail and E-commerce | ||
| Other End-User Industries | ||
| By Geography | North America | United States |
| Canada | ||
| Mexico | ||
| South America | Brazil | |
| Argentina | ||
| Rest of South America | ||
| Europe | Germany | |
| United Kingdom | ||
| France | ||
| Italy | ||
| Spain | ||
| Russia | ||
| Rest of Europe | ||
| Asia-Pacific | China | |
| Japan | ||
| India | ||
| South Korea | ||
| Australia and New Zealand | ||
| Rest of Asia-Pacific | ||
| Middle East | Saudi Arabia | |
| United Arab Emirates | ||
| Turkey | ||
| Rest of Middle East | ||
| Africa | South Africa | |
| Nigeria | ||
| Rest of Africa | ||


Key Questions Answered in the Report
What is the projected value of the enterprise network switch market by 2031?
The enterprise network switch market size is forecast to reach USD 22.94 billion by 2031, according to Mordor Intelligence.
Which region is expected to grow the fastest through 2031?
Asia-Pacific is projected to expand at a 9.52% CAGR between 2026 and 2031, driven by large-scale government digital infrastructure programs.
Which switch type shows the highest growth momentum?
Modular switches are forecast to grow at a 9.26% CAGR through 2031 as data center operators favor pay-as-you-grow upgrades.
Why are multi-gigabit ports gaining traction?
WiFi 6E and WiFi 7 access points can exceed 10 Gbps aggregate throughput, requiring 2.5 GbE and 5 GbE backhaul that drives the fastest 11.48% port-speed segment growth.
Which industry vertical is expected to post the strongest growth?
Manufacturing is anticipated to register a 9.04% CAGR through 2031 as time-sensitive networking underpins smart-factory rollouts.
Page last updated on:


