Access Layer Switch Market Size and Share
Market Overview
| Study Period | 2020 - 2031 |
|---|---|
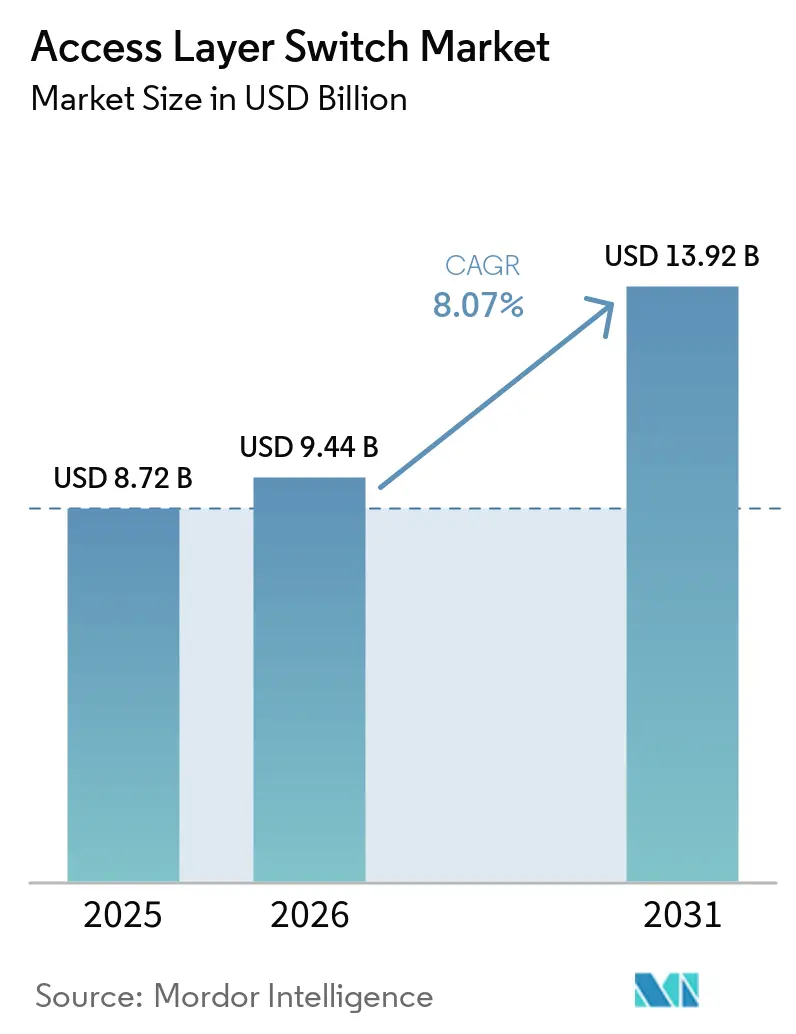
| Market Size (2026) | USD 9.44 Billion |
| Market Size (2031) | USD 13.92 Billion |
| Growth Rate (2026 - 2031) | 8.07% CAGR |
| Fastest Growing Market | Asia-Pacific |
| Largest Market | North America |
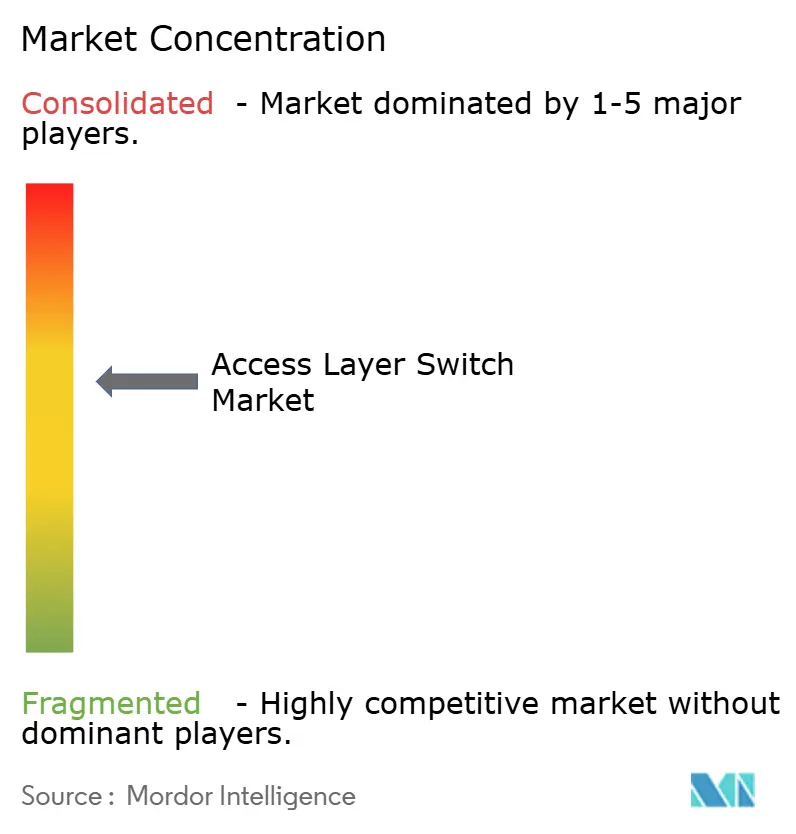
| Market Concentration | Medium |
Major Players *Disclaimer: Major Players sorted in no particular order Image © Mordor Intelligence. Reuse requires attribution under CC BY 4.0. | |
Access Layer Switch Market Analysis by Mordor Intelligence
The access layer switch market size is projected to expand from USD 8.72 billion in 2025 and USD 9.44 billion in 2026 to USD 13.92 billion by 2031, registering a CAGR of 8.07% between 2026 and 2031. Mandatory network-access-control roll-outs, the physical backhaul demands of Wi-Fi 6 and Wi-Fi 7, and the densification of edge-computing workloads inside branch sites are the three converging forces behind this trajectory. The 2.5/5 GbE multi-gig segment is replacing legacy 1 GbE ports at double-digit annual rates, while large enterprises anchor refresh revenue as they migrate toward policy-driven fabrics with zero-trust segmentation. Meanwhile, open networking challengers are eroding hardware margins by decoupling software velocity from silicon cycles through disaggregated operating systems.
Key Report Takeaways
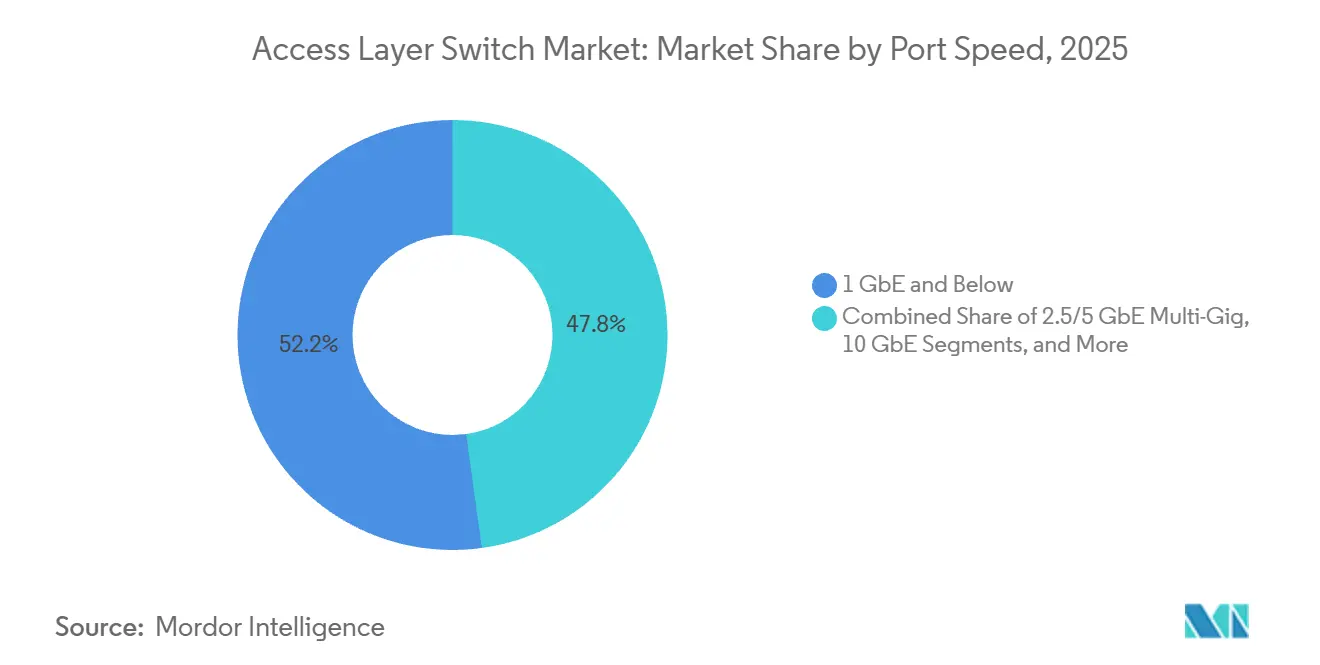
- By port speed, 1 GbE commanded 52.18% of the access layer switch market share in 2025, whereas 2.5/5 GbE is set to advance at a 12.84% CAGR through 2031.
- By port density, mid-range 24-48-port platforms held 42.36 % revenue share in 2025, while high-density 48-96-port switches are on track for a 9.26 % CAGR between 2026 and 2031.
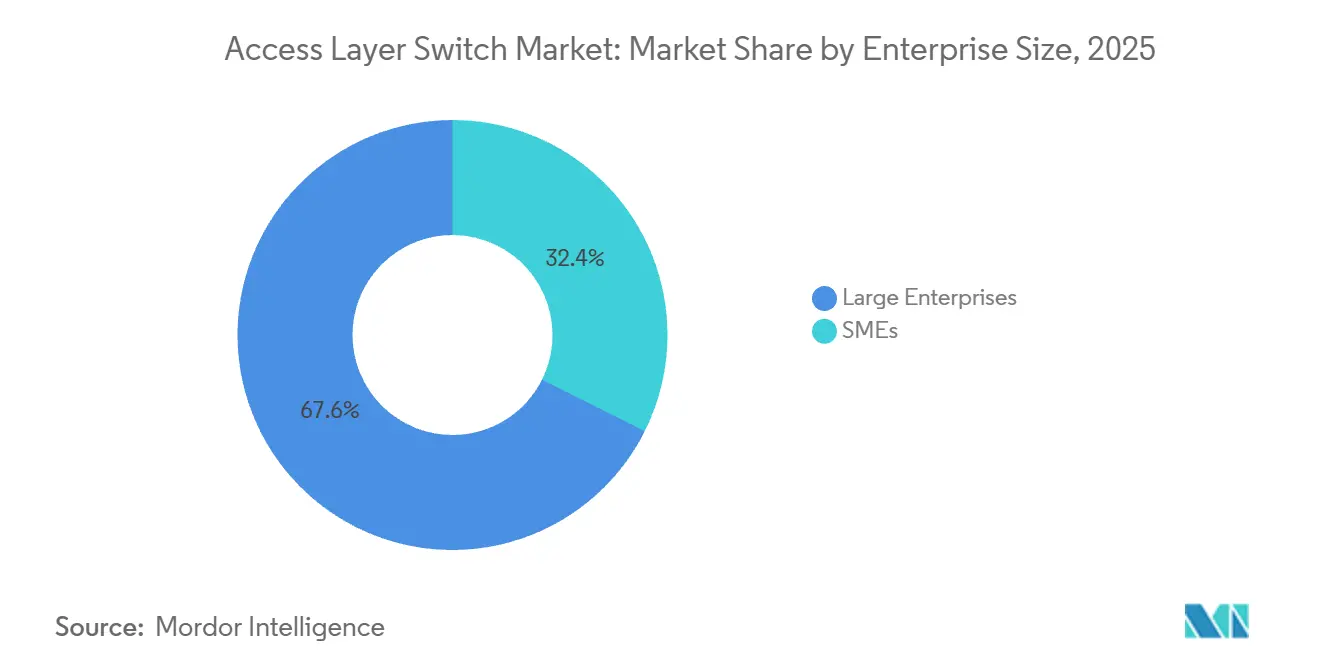
- By end-user enterprise size, large enterprises accounted for 67.62% of 2025 deployments, yet small and medium enterprises are forecast to grow at an 8.88% CAGR on the strength of cloud-managed offerings.
- By end-user industry, IT and telecom retained a 38.42% share in 2025, and manufacturing is the fastest-growing vertical, with a 9.12% CAGR to 2031.
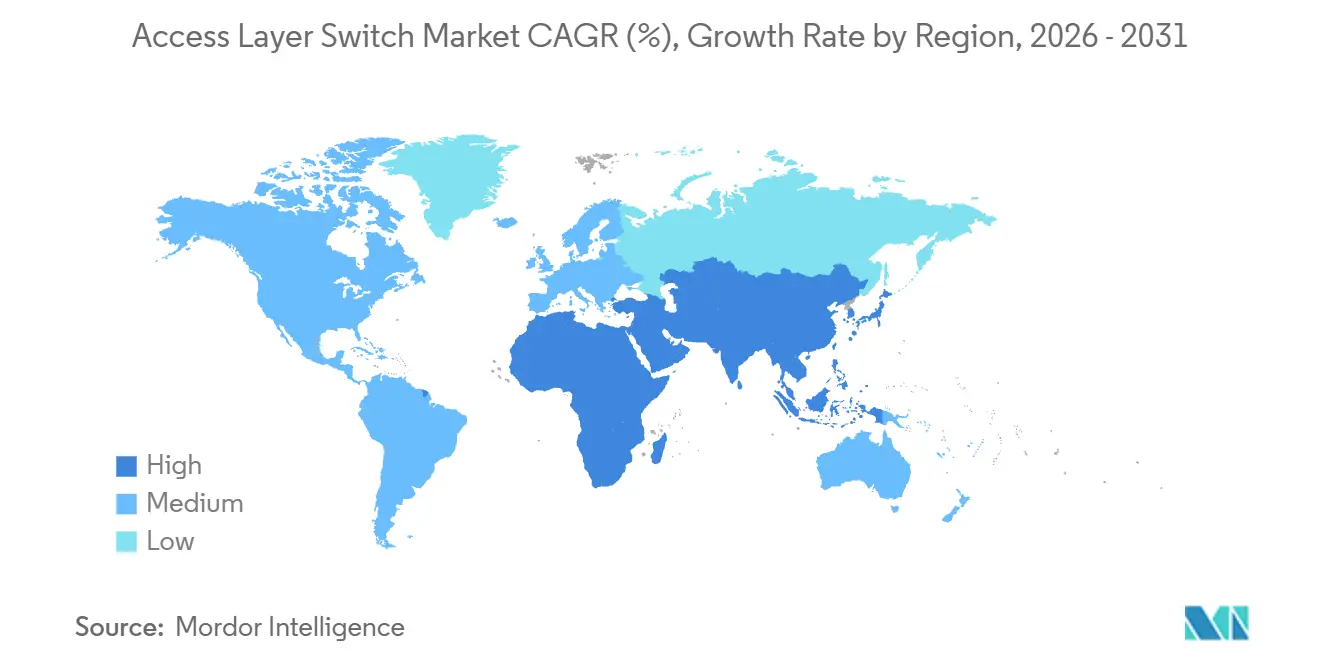
- By geography, North America led with 38.46 % share in 2025, while Asia-Pacific is poised to record a 9.54 % CAGR through 2031.
Note: Market size and forecast figures in this report are generated using Mordor Intelligence’s proprietary estimation framework, updated with the latest available data and insights as of January 2026.
Global Access Layer Switch Market Trends and Insights
Drivers Impact Analysis*
| Driver | (~) % Impact on CAGR Forecast | Geographic Relevance | Impact Timeline |
|---|---|---|---|
| Accelerated Campus Digitalization in Education Vertical | +1.8% | North America and Europe, emerging Asia-Pacific urban centers | Medium term (2-4 years) |
| Surge in Wi-Fi 6 and Wi-Fi 7 Access Point Roll-outs | +2.1% | Global, concentrated in North America, Europe, Asia-Pacific | Short term (≤ 2 years) |
| Edge Computing Workload Densification at Branch Sites | +1.5% | Global, led by North America and Europe, rising in Asia-Pacific | Medium term (2-4 years) |
| Mandatory Network Access Control Compliance in Regulated Industries | +1.3% | North America and Europe, expanding in Asia-Pacific | Long term (≥ 4 years) |
| Open-Networking Disaggregation Momentum in Telecom Access | +0.9% | Global telecom operators | Long term (≥ 4 years) |
| Energy-Efficient Ethernet Adoption Targets under Net-Zero Mandates | +0.6% | Europe and North America, gradual Asia-Pacific uptake | Long term (≥ 4 years) |
| Source: Mordor Intelligence | |||
Accelerated Campus Digitalization in the Education Vertical
Universities are replacing legacy switches to power hybrid learning, IoT-enabled campuses, and research clusters that depend on multi-gigabit throughput. A 2025 survey of United States higher-education IT leaders found that 60% planned network upgrades within 2 years.[1]EDUCAUSE, “2025 Higher Education IT Landscape Survey,” Educause.edu UCLA deployed 2.5 GbE-enabled Catalyst 9000 switches across 419 buildings to support Wi-Fi 6E services for 45,000 students CISCO.COM. Washington University adopted HPE Aruba CX switches to enforce role-based segmentation at scale. Dynamic provisioning and cloud orchestration shorten refresh cycles, making academia a steady growth pocket for the access layer switch market.
Surge in Wi-Fi 6 and Wi-Fi 7 Access Point Roll-outs
Wi-Fi 7 reached mainstream status by late 2025 and now represents a sizable share of enterprise wireless spend. IEEE 802.11be radios demand multi-gig uplinks, and the IEEE 802.3bz standard lets enterprises reuse existing Cat 5e and Cat 6 cabling without disruptive rewiring.[2]IEEE Standards Association, “IEEE 802.3 Ethernet Working Group,” IEEE.org Arista and Dell introduced 2.5/5 GbE-ready campus switches that integrate wireless telemetry under a single software plane. Power-over-Ethernet budgets rose to 90 W per port under IEEE 802.3bt, further accelerating the retirement of 1 GbE-only platforms.
Edge Computing Workload Densification at Branch Sites
Retail, manufacturing, and financial-service firms are hosting compute nodes at branch locations to cut latency for analytics, video, and transaction processing. Juniper’s AI-Native Networking Platform embeds anomaly detection inside access switches to automate distributed-edge fabrics. Time-Sensitive Networking extensions, such as IEEE 802.1AS, guarantee sub-millisecond delivery for industrial control loops, transforming the branch switch into an edge-fabric anchor. The convergence of compute and connectivity expands the addressable footprint of the access layer switch market.
Mandatory Network Access Control Compliance in Regulated Industries
Regulations like HIPAA, GDPR, and India’s Digital Personal Data Protection Act require device authentication and micro-segmentation. The European Union’s NIS2 Directive compels critical-infrastructure operators to upgrade switches that lack policy enforcement. Extreme Networks embedded NAC engines directly into universal platforms to streamline compliance in 2025. As zero-trust frameworks mature, the access layer becomes an active enforcement node, driving premium refresh opportunities.
Restraints Impact Analysis*
| Restraint | (~) % Impact on CAGR Forecast | Geographic Relevance | Impact Timeline |
|---|---|---|---|
| Supply Chain Volatility of Merchant Switch ASICs | -1.2% | Global, heightened in North America and Europe | Short term (≤ 2 years) |
| Skills Gap in Managing Policy-Driven Fabric Architectures | -0.8% | Global, most acute in emerging markets and mid-market enterprises | Medium term (2-4 years) |
| Rising Substitution by High-End WLAN for SMB Segments | -0.5% | Global, branch offices with fewer than 50 wired endpoints | Medium term (2-4 years) |
| Prolonged Capex Cycles in Public Sector Networks | -0.7% | North America and Europe, Asia-Pacific government programs | Long term (≥ 4 years) |
| Source: Mordor Intelligence | |||
Supply Chain Volatility of Merchant Switch ASICs
Broadcom’s near-monopoly in Tomahawk, Trident, and Jericho chips concentrates risk. TSMC lead times for advanced nodes stretched from six weeks in early 2024 to six months by late 2025, forcing vendors to ration inventory. Export-control uncertainty and multilayer PCB bottlenecks further strain availability. Alternative silicon from Marvell or Intel exists, yet redesign cycles exceed two years, maintaining dependency on Broadcom in the near term.
Skills Gap in Managing Policy-Driven Fabric Architectures
EVPN-VXLAN overlays, SD-Access, and intent-based networking require expertise that few campus engineers possess. Surveys of practitioners in 2025 found that 68 % lacked hands-on VXLAN experience. Cisco DNA Center and Arista CloudVision abstract complexity, but administrators still must interpret telemetry and remediate anomalies. Scarcity of qualified staff slows fabric adoption, particularly in cost-sensitive regions, limiting immediate growth for the access layer switch market.
*Our forecasts treat driver/restraint impacts as directional, not additive. The impact forecasts reflect baseline growth, mix effects, and variable interactions.
Segment Analysis
By Port Speed: Multi-Gig Backhaul Reshapes Campus Economics
Traditional 1 GbE and below ports held 52.18% market share in 2025, sustained by the installed base of legacy endpoints and the economic inertia of organizations deferring infrastructure refresh until end-of-support deadlines force action. The 2.5/5 GbE tier, anchored in IEEE 802.3bz, is forecast to outpace every other speed class with a 12.84 % CAGR through 2031. Enterprises treat multi-gig as a bridge between legacy 1 GbE endpoints and future 10 GbE fiber, preserving existing copper runs while meeting Wi-Fi 7 backhaul needs. Vendor roadmaps now default to multi-gig plus IEEE 802.3bt power budgets, signaling that 1 GbE will gradually enter maintenance mode.
Mature 10 GbE optics support uplinks and server access at falling price points, while 25/40 GbE and above remain concentrated in data-center racks that require east-west throughput. The access layer switch market size for multi-gig is projected to reach meaningful parity with 1 GbE by 2028, solidifying its role as the new default. At the same time, improved interoperability and vendor standardization are reducing deployment friction, accelerating enterprise-wide adoption of multi-gig infrastructure.


By Port Density: Consolidation Favors High-Density Platforms
Mid-range 24-48-port devices dominated the market with 42.26% market share in 2025 wiring closets due to legacy device counts, yet refresh budgets increasingly tilt toward larger fixed-form-factor models that cut per-port power consumption. High-density 48-96-port switches are expected to grow at 9.26 % CAGR, benefiting from campus-aggregation consolidation and data-center top-of-rack designs that minimize cabling. This shift is also driven by the need to simplify network architecture and reduce the number of physical devices per site.
Extreme Networks and Arista offer modular port groups that mix 1 GbE, multi-gig, and 25 GbE in one chassis, enabling phased migrations without forklift upgrades. The access layer switch market share for high-density platforms is set to climb as organizations rationalize closets and seek operational economies of scale. Additionally, higher-density configurations help optimize rack space and support automation-driven network designs, making them increasingly attractive for modern campus deployments.
By Enterprise Size: SMEs Embrace Cloud-Managed Simplicity
Large enterprises, with 67.62 % revenue share in 2025, maintain steady replacement cycles tied to security mandates and multi-site governance. However, SMEs are expanding at an 8.88 % CAGR on the back of subscription pricing and zero-touch provisioning. Cloud dashboards from Cisco Meraki, HPE Aruba Instant On, and TP-Link Omada remove command-line complexity, allowing non-specialists to roll out segmented networks.
This democratization of management lowers barriers to refresh, positioning SMEs as a durable growth pocket. The access layer switch market size attributable to SME buyers is slated to double by 2031 as hardware-subscription bundles displace capital-heavy procurement models. Furthermore, the increasing availability of bundled solutions combining switching, security, and wireless management is accelerating adoption across distributed and retail-heavy SME environments.
By End-User Industry: Manufacturing Accelerates with Deterministic Ethernet
IT and telecom led spending in 2025 with 38.42% share, yet manufacturing’s 9.12 % CAGR makes it the standout vertical. Industry 4.0 plants deploy Time-Sensitive Networking-enabled switches for closed-loop motion control and predictive-maintenance analytics. Siemens, ABB, and Rockwell now bundle TSN-capable access gear into automation portfolios, validating Ethernet’s ascendancy over proprietary fieldbuses.
Healthcare, BFSI, government, and education each present unique compliance or service-quality drivers, but none match the pace at which factories retrofit for deterministic Ethernet. As industrial platforms proliferate, the access layer switch industry must balance ruggedized hardware with IT-grade automation toolchains. The growing need for real-time data processing and low-latency communication further reinforces manufacturing’s role as a key growth engine within the market.
Geography Analysis
North America held 38.46 % of 2025 revenue due to entrenched campus modernizations, higher-education refreshes, and early zero-trust adoption across healthcare and federal agencies. Budget certainty and mature partner ecosystems underpin a predictable refresh cadence, although slowing replacement in small branches caps upside. In addition, widespread adoption of cloud-managed networking and advanced security frameworks continues to reinforce steady demand across enterprise campuses.
Europe follows closely, propelled by NIS2 and DORA mandates that require authenticated device access and continuous monitoring. Energy-efficient Ethernet goals tied to net-zero pledges spur PoE switch upgrades in corporate campuses, while public-sector approvals prolong deal cycles. Eastern European manufacturing corridors add incremental demand as industrial IoT pilots scale, further supported by EU funding programs aimed at digital infrastructure modernization.
Asia-Pacific is the fastest-growing geography at 9.54 % CAGR. India’s Digital India program earmarked INR 1.5 trillion (USD 18 billion) for smart-city and broadband projects, while China’s 14th Five-Year Plan prioritizes industrial internet build-outs.[3]Government of India, “Digital India Infrastructure Allocation,” Digitalindia.gov.in ASEAN’s Smart Cities Network and Japan’s Society 5.0 schemes likewise elevate regional spending. These multi-year directives ensure sustained momentum for the access layer switch market in the region, with greenfield deployments and rapid enterprise expansion driving incremental growth.

Competitive Landscape
The top five vendors accounted for the vast majority of 2025 revenue, indicating a moderately concentrated yet still contestable arena. Cisco, Huawei, and HPE Aruba leverage installed bases, subscription licensing, and professional services to elevate switching costs for defections. Arista and Juniper extend data-center pedigrees into campuses with telemetry-rich operating systems that promise consistent policies across edge and core. Their continued investment in software-driven networking platforms is also strengthening customer lock-in and long-term revenue visibility.
Extreme Networks, Dell, and Fortinet differentiate through integrated security engines, while TP-Link, D-Link, Ubiquiti, and Ruijie undercut on price in emerging markets. Open networking momentum favors Edgecore and Delta Electronics, whose bare-metal hardware pairs with SONiC to court telecom and hyperscale buyers looking to decouple software from silicon.[4]SONiC Community, “Software for Open Networking in the Cloud,” Sonic-net.github.io This shift toward disaggregation is gradually reshaping competitive dynamics, particularly in cost-sensitive and large-scale deployments.
AI-driven operations represent the next battleground. Cisco’s 2024 purchase of Splunk embeds observability into Catalyst switches, Arista’s CloudVision employs predictive algorithms for remediation, and Juniper’s Mist AI applies natural-language playbooks to campus troubleshooting. With silicon supply uncertainty persisting, vendors that secure diversified ASIC pipelines and embed intelligence at the edge stand to outpace the broader access layer switch market. As automation and analytics become core differentiators, vendors are increasingly competing on software capabilities rather than hardware alone.
Access Layer Switch Industry Leaders
Cisco Systems, Inc.
Huawei Technologies Co., Ltd.
Hewlett Packard Enterprise Company
Arista Networks, Inc.
Extreme Networks, Inc.
- *Disclaimer: Major Players sorted in no particular order

Recent Industry Developments
- April 2026: Cisco and Microsoft announced the integration of Azure AI services into Catalyst 9000 switches to provide on-device anomaly detection for zero-trust campuses.
- February 2026: Arista launched the 7060X6 series with 800 GbE ports and CloudVision telemetry to support AI/ML clusters in campus aggregates.
- January 2026: HPE Aruba released CX 10000 modular switches featuring embedded Wi-Fi 7 controllers for unified wired-wireless management.
- November 2025: Juniper finalized the WiteSand acquisition for USD 150 million to strengthen intent-based automation in its AI-Native Networking Platform.


Global Access Layer Switch Market Report Scope
The access layer switch market refers to the market for network switches deployed at the edge of a network, where end-user devices such as computers, wireless access points, IP phones, and IoT devices connect to the network. These switches primarily provide last-mile connectivity, basic traffic forwarding, and power delivery via technologies such as Power over Ethernet (PoE).
The Access Layer Switch Market Report is Segmented by Port Speed (1 GbE and Below, 2.5/5 GbE Multi-Gig, 10 GbE, 25/40 GbE, 100 GbE, and 400 GbE and Above), Port Density (Small Form Factor, Mid-Range, High-Density, Ultra-High-Density), End-User Enterprise Size (Large Enterprises, and SMEs), End-User Industry (IT and Telecom, BFSI, Healthcare and Lifesciences, Manufacturing, Government and Defense, Education, Retail and E-commerce, and Other End User Industries), and Geography (North America, South America, Europe, Asia-Pacific, Middle East, and Africa). The Market Forecasts are Provided in Terms of Value (USD).
| 1 GbE and Below |
| 2.5/5 GbE Multi-Gig |
| 10 GbE |
| 25/40 GbE |
| 100 GbE |
| 400 GbE and Above |
| Small Form Factor (8-24 ports) |
| Mid-Range (24-48 ports) |
| High-Density (48-96 ports) |
| Ultra-High-Density (100+ ports) |
| Large Enterprises |
| SMEs |
| IT and Telecom |
| BFSI |
| Healthcare and Lifesciences |
| Manufacturing |
| Government and Defense |
| Education |
| Retail and E-commerce |
| Other End User Industries |
| North America | United States |
| Canada | |
| Mexico | |
| South America | Brazil |
| Argentina | |
| Rest of South America | |
| Europe | Germany |
| United Kingdom | |
| France | |
| Italy | |
| Spain | |
| Russia | |
| Rest of Europe | |
| Asia-Pacific | China |
| Japan | |
| India | |
| South Korea | |
| Australia and New Zealand | |
| Rest of Asia-Pacific | |
| Middle East | Saudi Arabia |
| United Arab Emirates | |
| Turkey | |
| Rest of Middle East | |
| Africa | South Africa |
| Nigeria | |
| Rest of Africa |
| By Port Speed | 1 GbE and Below | |
| 2.5/5 GbE Multi-Gig | ||
| 10 GbE | ||
| 25/40 GbE | ||
| 100 GbE | ||
| 400 GbE and Above | ||
| By Port Density | Small Form Factor (8-24 ports) | |
| Mid-Range (24-48 ports) | ||
| High-Density (48-96 ports) | ||
| Ultra-High-Density (100+ ports) | ||
| By End-user Enterprise Size | Large Enterprises | |
| SMEs | ||
| By End-User Industry | IT and Telecom | |
| BFSI | ||
| Healthcare and Lifesciences | ||
| Manufacturing | ||
| Government and Defense | ||
| Education | ||
| Retail and E-commerce | ||
| Other End User Industries | ||
| By Geography | North America | United States |
| Canada | ||
| Mexico | ||
| South America | Brazil | |
| Argentina | ||
| Rest of South America | ||
| Europe | Germany | |
| United Kingdom | ||
| France | ||
| Italy | ||
| Spain | ||
| Russia | ||
| Rest of Europe | ||
| Asia-Pacific | China | |
| Japan | ||
| India | ||
| South Korea | ||
| Australia and New Zealand | ||
| Rest of Asia-Pacific | ||
| Middle East | Saudi Arabia | |
| United Arab Emirates | ||
| Turkey | ||
| Rest of Middle East | ||
| Africa | South Africa | |
| Nigeria | ||
| Rest of Africa | ||


Key Questions Answered in the Report
How large is the access layer switch market in 2026?
The access layer switch market size stands at USD 9.44 billion in 2026, based on Mordor Intelligence data.
What is the forecast CAGR for access layer switches between 2026 and 2031?
The market is projected to advance at an 8.07 % CAGR over the 2026-2031 period, according to Mordor Intelligence.
Which port speed segment is growing fastest?
The 2.5/5 GbE multi-gig segment is expected to post a 12.84 % CAGR, driven by Wi-Fi 6E and Wi-Fi 7 backhaul requirements.
Which region will see the highest growth through 2031?
Asia-Pacific is forecast to record a 9.54 % CAGR through 2031 on the back of government digital-infrastructure mandates.
Why are SMEs adopting access layer switches at a rising rate?
Cloud-managed dashboards, subscription pricing, and zero-touch provisioning lower complexity and cost, helping SME deployments grow at an 8.88 % CAGR.
Page last updated on:


