Managed Switch Market Size and Share
Market Overview
| Study Period | 2020 - 2031 |
|---|---|
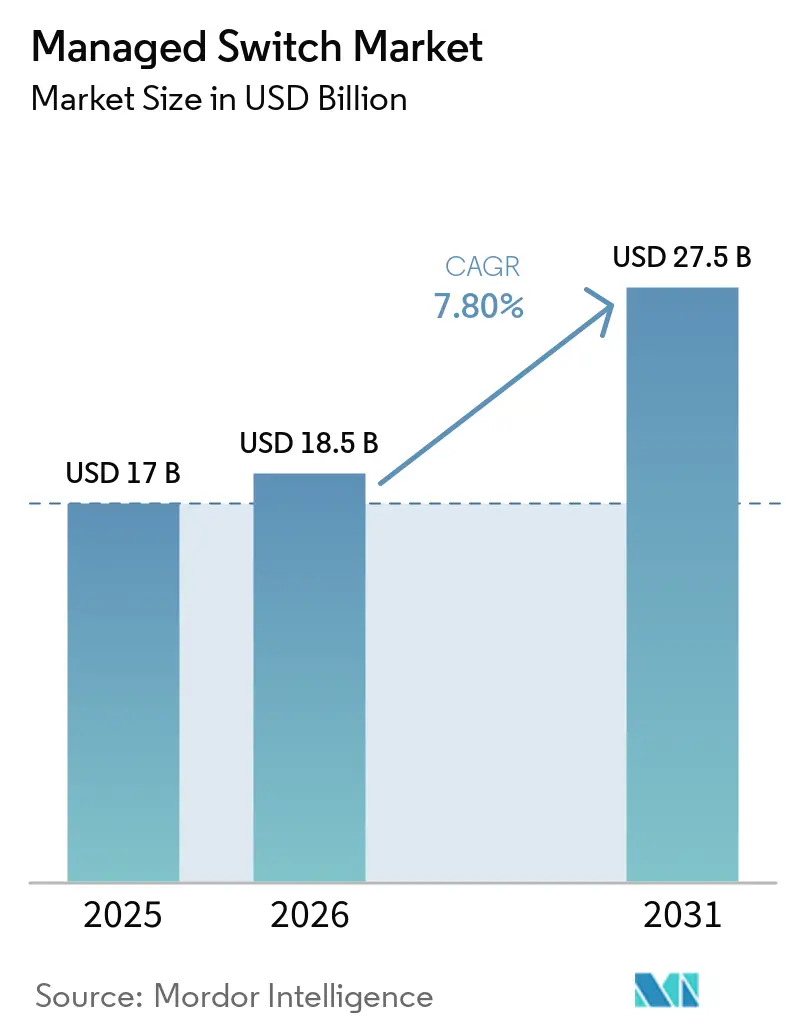
| Market Size (2026) | USD 18.5 Billion |
| Market Size (2031) | USD 27.5 Billion |
| Growth Rate (2026 - 2031) | 7.80% CAGR |
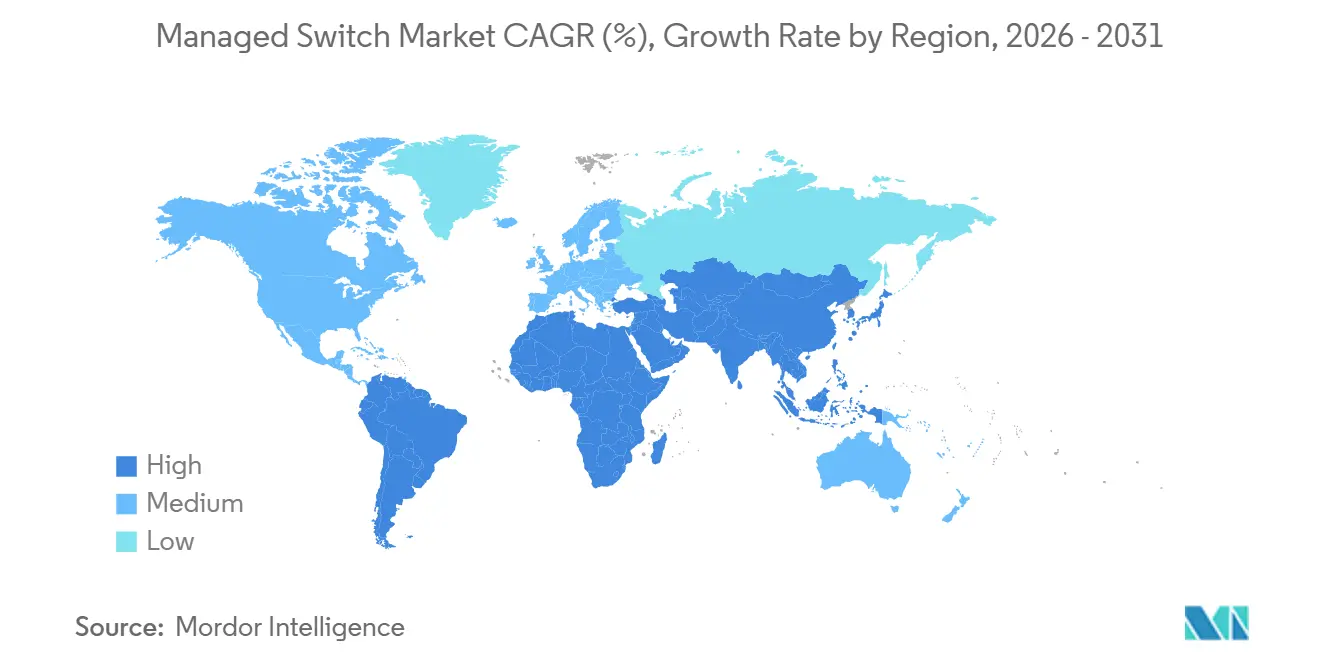
| Fastest Growing Market | Asia-Pacific |
| Largest Market | Asia-Pacific |
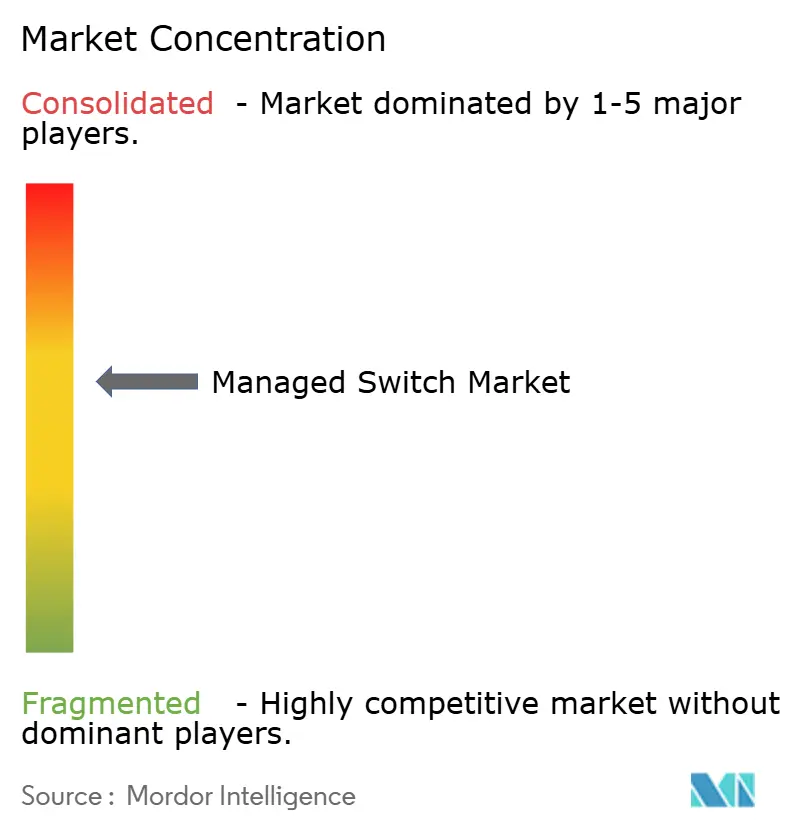
| Market Concentration | Medium |
Major Players *Disclaimer: Major Players sorted in no particular order Image © Mordor Intelligence. Reuse requires attribution under CC BY 4.0. | |
Managed Switch Market Analysis by Mordor Intelligence
The managed switch market size is projected to expand from USD 17 billion in 2025 and USD 18.5 billion in 2026 to USD 27.5 billion by 2031, registering a CAGR of 7.8% between 2026 to 2031. Uptake is fueled by enterprises refreshing campus fabrics for Wi-Fi 6E and Wi-Fi 7 backbones, hyperscalers scaling 400 GbE and 800 GbE spines to serve graphics-processing clusters, and factories converging operational and information-technology networks for deterministic Ethernet. Zero-trust mandates are pushing micro-segmentation to the access layer, so organizations are replacing unmanaged devices with platforms that embed telemetry and policy enforcement. Vendors are also lowering operational barriers through cloud controllers that automate switch onboarding, which is expanding the customer base among small and medium businesses. Supply disruption in high-end application-specific integrated circuits (ASICs) remains a near-term risk, yet demand visibility tied to data-center construction, broadband programs and industrial automation underpins multi-year purchasing commitments.
Key Report Takeaways
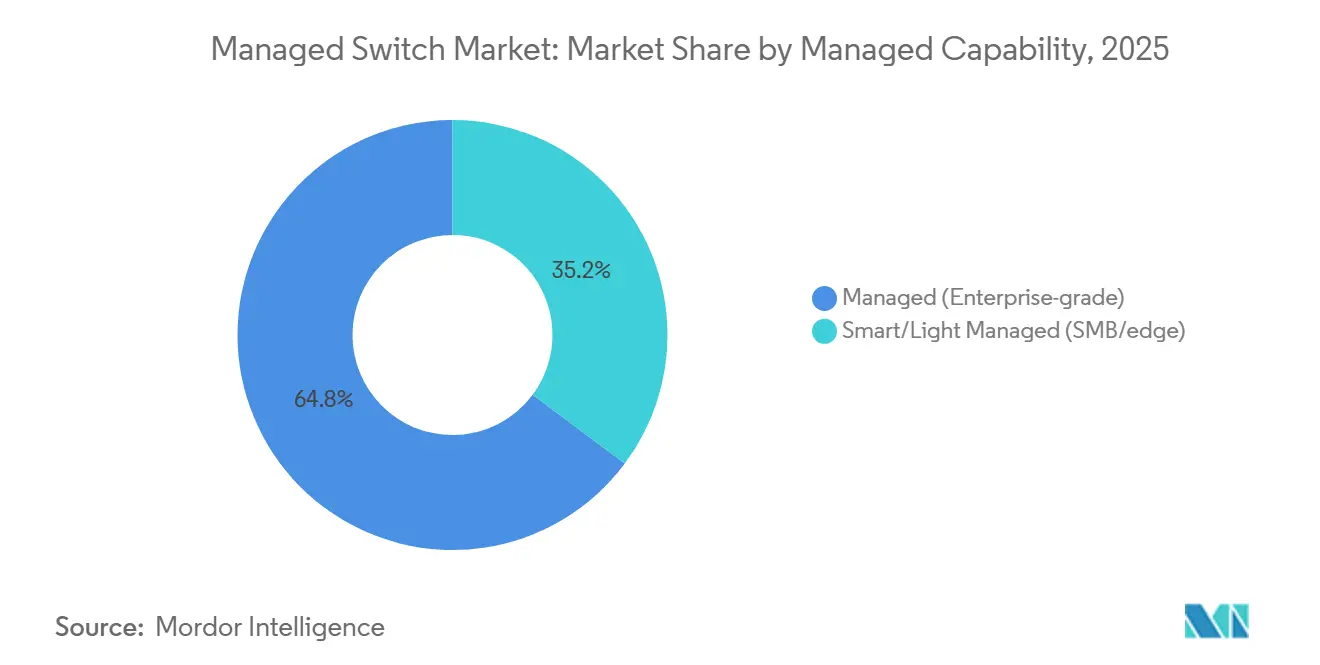
- By managed capability, managed enterprise-grade switches led with 64.8% of the managed switch market share in 2025, while smart and light managed platforms are forecast to post the fastest 10.42% CAGR through 2031.
- By port speed, gigabit Ethernet devices held 46.35% of the managed switch market share in 2025; switches rated at 100 GbE and higher are projected to grow at a 9.51% CAGR between 2026-2031.
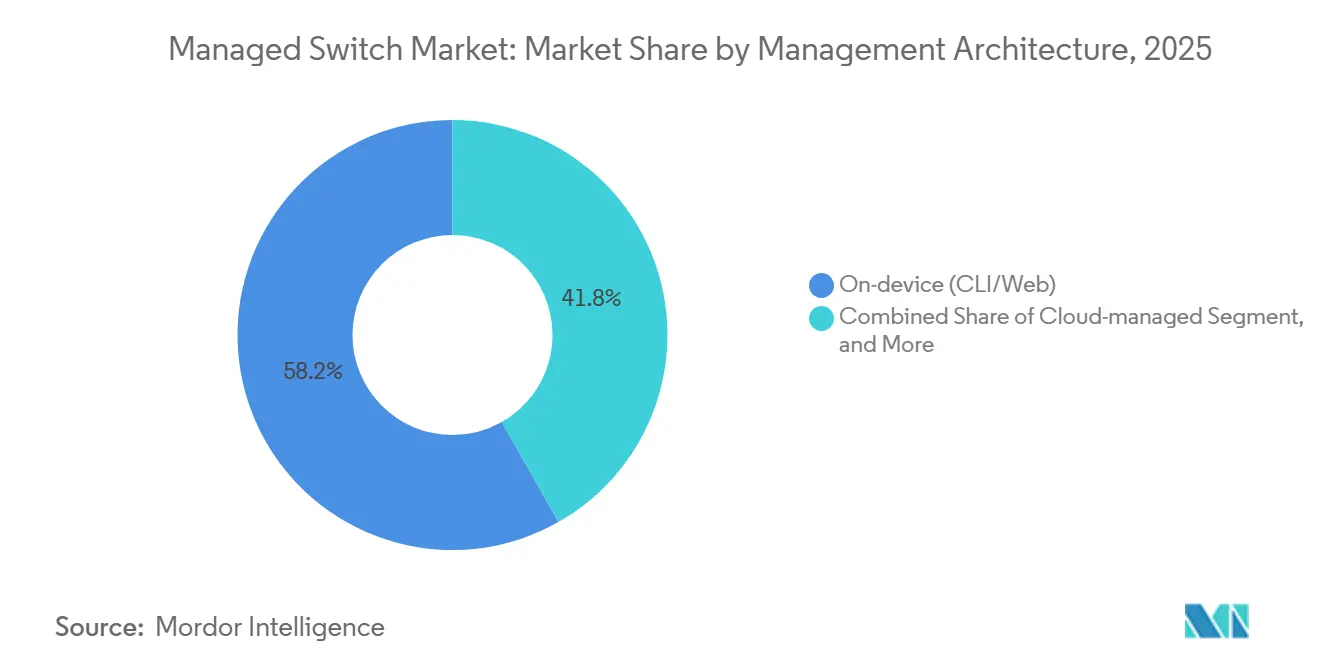
- By management architecture, on-device administration accounted for 58.2% of deployments in 2025; cloud-managed switches are slated to expand at a 9.9% CAGR over the same period.
- By geography, Asia-Pacific commanded 34.1% revenue in 2025 and is anticipated to record a 9% CAGR to 2031.
- By end-user industry, information-technology and telecommunications captured 31.45% of 2025 spend, whereas healthcare is expected to accelerate at an 8.45% CAGR through 2031.
Note: Market size and forecast figures in this report are generated using Mordor Intelligence’s proprietary estimation framework, updated with the latest available data and insights as of January 2026.
Global Managed Switch Market Trends and Insights
Drivers Impact Analysis*
| Driver | (~) % Impact on CAGR Forecast | Geographic Relevance | Impact Timeline |
|---|---|---|---|
| Accelerated Migration to Gigabit and Multi-Gigabit Campus Networks | +1.8% | North America, Europe refreshes, APAC greenfield rollouts | Medium term (2-4 years) |
| Edge-to-Cloud Security Requirements Driving Managed Switch Adoption | +1.5% | North America and Europe compliance-focused rollouts | Short term (≤ 2 years) |
| Industrial Ethernet Expansion in Smart Factories | +1.3% | China, India, Southeast Asia, plus spill-over into Europe, North America | Long term (≥ 4 years) |
| Rising Demand for Power over Ethernet in Converged Networks | +1.2% | Global, early traction in North America healthcare, APAC smart buildings | Medium term (2-4 years) |
| Government-Backed Broadband Modernization Programs | +1.0% | India, Southeast Asia, Europe, United States | Long term (≥ 4 years) |
| AI-Optimized Network Management Platforms Reducing OPEX | +0.9% | Early adoption in North America and Europe, spreading to APAC | Short term (≤ 2 years) |
| Source: Mordor Intelligence | |||
Accelerated Migration to Gigabit and Multi-Gigabit Campus Networks
Enterprises are in the midst of a forced refresh because Wi-Fi 6E and Wi-Fi 7 access points saturate legacy gigabit uplinks. Georgetown University swapped 4,000 access points in 2025 and refreshed its distribution switches with multi-gigabit models to sustain 5 Gbps per access point. Similar bottlenecks are showing up in corporate and government campuses where multiple Wi-Fi 6E clients concurrently stream 4K video or sync large datasets. Network teams find that slot-by-slot upgrades are insufficient, so entire switch stacks are replaced with managed devices supporting quality-of-service and granular monitoring. The economics favor managed switch market deployments because unmanaged units cannot prioritize latency-sensitive traffic or expose per-port utilization. As a result, demand for 2.5 GbE, 5 GbE and 10 GbE access switches is accelerating across higher education, corporate headquarters and public-sector buildings.
Edge-to-Cloud Security Requirements Driving Managed Switch Adoption
Zero-trust architecture shifts inspection and segmentation into every hop of the network, turning access switches into enforcement engines. Fortinet embedded its firewall rules directly into FortiSwitch hardware in 2024, enabling micro-segmentation without hair-pinning traffic through centralized appliances. Financial-services and healthcare operators are early adopters because frameworks such as PCI-DSS and HIPAA require sensitive flows to remain isolated. Managed switches equipped with posture assessment can quarantine non-compliant devices in real time and feed telemetry to security information and event-management tools. This moves the managed switch market beyond basic connectivity toward an active security role, which increases attach rates for licenses and maintenance contracts. Vendors that integrate analytics and automation gain an advantage as enterprises seek platforms that merge networking and security skill sets.
Industrial Ethernet Expansion in Smart Factories
Factories are rewiring production lines with time-sensitive networking (TSN) so that control loops, robots and sensors share deterministic Ethernet. Cisco began shipping IEC 61850-certified industrial switches in volume to automotive plants and semiconductor fabs during 2025.[1]Cisco Industrial Networking Group, “IEC 61850-Certified Switches for Smart Factories,” cisco.com Converging operational technology and information-technology networks removes protocol gateways and ushers in standardized cybersecurity practices. Yet brownfield sites still harbor proprietary fieldbus gear that cannot justify a rip-and-replace, so hybrid networks will coexist for years. Greenfield factories in India and Vietnam are instead specifying TSN-capable managed switches from day one, tilting growth toward APAC. The managed switch market benefits from premium pricing on ruggedized, extended-temperature models that can survive harsh industrial environments.
Rising Demand for Power over Ethernet in Converged Networks
High-power devices such as pan-tilt-zoom cameras, LED lighting and Wi-Fi 6E access points require switches compliant with IEEE 802.3bt. Antaira released a 24-port platform in 2025 that delivers 95 W on every port, aimed at medical and industrial sites where device density is high. Hospitals are deploying these switches to power nurse-call panels and patient monitors without installing separate electrical runs. Centralized power also enables remote reboots and load-shedding, improving uptime during utility disruptions. While a fully loaded 48-port chassis can draw more than 4 kW, advances in power-supply efficiency and improved airflow are mitigating thermal overhead. Consequently, the managed switch market is capturing incremental value from integrated power delivery and energy management features.
Restraints Impact Analysis*
| Restraint | (~) % Impact on CAGR Forecast | Geographic Relevance | Impact Timeline |
|---|---|---|---|
| Supply Chain Volatility for Specialized Switching ASICs | -1.2% | Worldwide, most acute for vendors reliant on Broadcom silicon | Short term (≤ 2 years) |
| Growing Preference for Wireless-First Architectures in SMBs | -0.8% | North America and Europe retail, hospitality and other small and medium businesses | Medium term (2-4 years) |
| Cyber-Security Skill Shortage Hindering Complex Switch Deployments | -0.6% | Regions with limited technical-education capacity | Long term (≥ 4 years) |
| Increasing Adoption of White-Box Switching by Hyperscalers | -0.5% | North America and APAC hyperscale data centers | Medium term (2-4 years) |
| Source: Mordor Intelligence | |||
Supply Chain Volatility for Specialized Switching ASICs
Broadcom commands most of the merchant silicon in enterprise and data-center switches, so any production hiccup reverberates across vendors. Google moved future designs to Marvell silicon, a shift disclosed in Marvell’s fiscal 2025 earnings, highlighting customer concern about dependence on a single supplier. Tight 3-nm and 5-nm wafer capacity at foundries such as TSMC has pushed lead times for switching ASICs beyond 52 weeks. Smaller vendors without secured allocations either ship older, less efficient chips or delay launches, surrendering share. While tier-one OEMs can pre-pay and lock foundry slots, the broader managed switch market faces intermittent shortages that impede revenue recognition and inflate inventory costs.
Growing Preference for Wireless-First Architectures in SMBs
Retailers, cafés and boutique hotels are gravitating toward wireless mesh systems that bypass distribution-layer switches altogether. Cloud-managed access points need only internet and power, while managed switches require virtual LAN planning and continuous firmware upkeep. For resource-limited IT teams, the total cost of ownership tilts toward Wi-Fi even if unit hardware prices are higher. Managed switches continue to power access points via PoE, but port counts are smaller and traffic aggregation demands are lower, depressing incremental revenue. Vendors are countering by bundling simplified smart switches with access points, yet the trend caps the addressable managed switch market in the small-business segment.
*Our forecasts treat driver/restraint impacts as directional, not additive. The impact forecasts reflect baseline growth, mix effects, and variable interactions.
Segment Analysis
By Managed Capability: Cloud Platforms Expand the Addressable Base
Enterprise-grade platforms held 64.8% of the managed switch market in 2025 on the strength of deep routing and security features. Smart and light managed devices are on track for a 10.42% CAGR thanks to cloud controllers that hide complexity and let non-specialists roll out branch offices in minutes. The managed switch market size advantage enjoyed by enterprise gear narrows as newer smart platforms adopt high-end ASICs, delivering line-rate performance at lower cost. Vendors sweeten deals by bundling multiyear cloud subscriptions, converting capital spend to operating expense and improving budget predictability. However, customers face lock-in when migrating between cloud domains because every switch needs re-provisioning and staff must relearn workflows. Over the forecast, organizations with fewer than 50 switches are expected to jump straight to cloud-first smart devices, while Fortune 1000 enterprises continue to favor on-premises control for granular visibility.
Second-tier suppliers are carving niches by offering vertical-specific firmware, for example, ruggedized smart switches pre-configured for manufacturing protocols. As a result, procurement decisions increasingly weigh both feature breadth and vertical depth. The managed switch industry is likely to witness a two-tier channel strategy: global OEMs focus on full-stack solutions, and regional specialists address compliance or environmental nuances.


By Port Speed: AI Workloads Propel 100 GbE and Beyond
Gigabit devices still comprised 46.35% of the managed switch market share in 2025 because most laptops and IoT sensors max out at 1 Gbps. Yet switches rated at 100 GbE and higher are forecast to sprint at a 9.51% CAGR as east-west traffic inside data centers mushrooms. Arista’s 800 GbE 7060X6, launched in 2025, delivers 64 ports in a single rack unit, achieving 40% better power efficiency than its prior generation.[2]Arista Product Brief, “7060X6 High-Density 800G Switch,” arista.com Early adopters are hyperscalers training large language models that exchange gradients at extreme speeds. Optics cost, north of USD 10,000 per module, restrains broader uptake, so many enterprises will leapfrog to 1.6 Tbps once standards firm up. Mid-tier buyers remain on 10 GbE and 25 GbE for top-of-rack connections because they balance cost, power and capacity. Consequently, the managed switch market size expansion at the high end is offset partly by plateauing demand in mid-range speeds.
Component price declines, driven by 5 nm yields and silicon photonics, should gradually close the gap, yet CFOs still weigh the dollar per delivered gigabit carefully. Vendors differentiate through real-time congestion control, reduced jitter for AI workloads and flow-telemetry hooks for observability stacks rather than raw throughput alone.
By Management Architecture: SaaS Economics Redefine Ownership Models
On-device administration, CLI or embedded web UI, accounted for 58.2% of 2025 deployments, reflecting entrenched work practices in enterprises with network-operations centers. Cloud-managed units are projected to post a 9.9% CAGR as software-as-a-service eliminates controller hardware and gives branch technicians zero-touch provisioning. The managed switch market share tilt toward SaaS is especially visible in retail chains rolling out hundreds of micro-sites. Juniper’s Mist AI mines telemetry from thousands of switches then applies machine learning to slash mean time to resolution by 60%. Data-sovereignty rules in healthcare and government slow adoption where telemetry may cross borders, but vendors counter with regional clouds or on-prem editions.
Hybrid control planes that keep mission-critical functions local while offloading analytics to the cloud are emerging. These satisfy latency requirements in factories that cannot rely on always-on internet yet still capitalize on aggregated intelligence. Over time, licensing structures will morph toward per-port monthly fees, making the network resemble other utility services.

By End User Industry: Connected Care Drives Healthcare Outperformance
IT and telecom absorbed 31.45% of the managed switch market in 2025 because data-center builds and 5G backhaul stacks rely heavily on high-density switches. Healthcare, however, is the growth leader with an 8.45% CAGR through 2031 as hospitals deploy PoE for imaging, patient monitoring and real-time location services. Ethernet’s deterministic features via TSN meet the latency needs of digital operating theaters, while embedded security satisfies HIPAA guidelines. Banking upgrades for hybrid branches, manufacturer investments in Industry 4.0, and upgraded education campuses also contribute. Energy utilities embracing IEC 61850 in substations further expand the managed switch market size by requiring hardened, fan-less devices with wide-temperature tolerances.
Smaller verticals such as retail and hospitality aggregate into a significant tail, particularly as video analytics and self-checkout systems spread. Specialized vendors that certify for medical-grade power supplies or hazardous-area compliance win outsized premiums, underscoring the role of vertical differentiation.
Geography Analysis
Asia-Pacific led with 34.1% of the managed switch market in 2025 and is forecast to post a 9% CAGR through 2031. A 19.4-GW data-center construction pipeline spotlighted in 2025, concentrated in Johor, Malaysia and Mumbai, India, underpins orders for spine and top-of-rack platforms. India’s BharatNet Phase 3, funded at INR 1.4 lakh crore (USD 16.1 billion), is extending fiber to 214,000 village clusters, all terminating in symmetrical-gigabit managed access switches. Data-localization statutes in India and Vietnam prompt hyperscalers to build domestic facilities, elevating demand for high-speed aggregation gear. Meanwhile, supply-chain diversification is pushing manufacturers into Vietnam and Malaysia, where newly built smart factories specify TSN-ready industrial switches from day one.
North America ranks second, buoyed by higher-education campus refreshes and the Broadband Equity, Access and Deployment program, which directs USD 42.5 billion toward rural fiber builds. Enterprises across the United States are adopting multi-gigabit PoE to support Wi-Fi 7 handsets and IoT sensors, driving steady replacement cycles. Europe benefits from the Connecting Europe Facility Digital program, which earmarked EUR 865 million (USD 975 million) for backbone upgrades that rely on managed switches with advanced optical and routing features.[3]European Commission, “Connecting Europe Facility Digital,” europa.eu
The Middle East, spurred by sovereign-cloud directives, is attracting hyperscale investments such as AWS’s plan to invest more than USD 5 billion in Saudi Arabia. These builds prefer equipment that offers advanced encryption and compliance reporting. South America and Africa are smaller today yet post healthy growth as operators roll out fiber backhaul and governments prioritize digital inclusion. Vendors face price pressure in Asia-Pacific, premium margins in the Middle East, and elongated payment cycles in emerging markets, requiring diversified go-to-market tactics.

Competitive Landscape
Managed switch market competition is moderate. Cisco, Juniper, Hewlett Packard Enterprise and Arista collectively hold the lion’s share but face direct price competition from white-box original-design manufacturers. Cisco closed its USD 28 billion Splunk deal in 2024, integrating observability and predictive analytics into switching platforms to reduce downtime.[4]Cisco Investor Relations, “Cisco Completes Acquisition of Splunk,” cisco.com Arista extended beyond data centers into campus networks and launched an 800 GbE line in 2025, narrowing gaps in feature breadth against incumbents. Hewlett Packard Enterprise’s USD 14 billion bid for Juniper, announced in 2024 and still awaiting regulatory clearance, aims to fuse Aruba campus switches with Juniper’s data-center fabric to build an end-to-end stack.
Hyperscalers continue to specify white-box gear built around Broadcom or Marvell silicon, saving around 40% versus branded hardware. The Open Compute Project and SONiC NOS have matured to the point where Amazon, Google, Microsoft and Meta independently qualify new hardware, compressing vendor margins. Enterprise uptake of white-box remains limited because of perceived support gaps, yet some financial institutions are piloting deployments in low-risk labs. At the small-business end, Ubiquiti and MikroTik capture share with cloud-managed switches priced well below Cisco Meraki, though scalability and security depth are limited.
Component supply remains a strategic variable. Vendors with guaranteed wafer capacity at TSMC can hold lead-time advantages, while second-tier players scramble during demand surges. Software differentiation, particularly AI-driven troubleshooting and integrated security, has therefore become the battleground for defending price premiums in an otherwise commoditizing hardware space.
Managed Switch Industry Leaders
Cisco Systems, Inc.
Huawei Technologies Co., Ltd.
Hewlett Packard Enterprise Company
Arista Networks, Inc.
Dell Technologies Inc.
- *Disclaimer: Major Players sorted in no particular order

Recent Industry Developments
- April 2026: Cisco introduced a cloud-native Nexus dashboard application that fuses Splunk analytics with streaming telemetry to offer intent verification for campus fabrics.
- March 2025: India’s cabinet approved INR 1.4 lakh crore (USD 16.1 billion) for BharatNet Phase 3, unlocking large-volume demand for rural gigabit switches.
- March 2024: Cisco completed the USD 28 billion acquisition of Splunk, bolstering AI-driven observability in its switching portfolio.
- January 2024: Hewlett Packard Enterprise announced a USD 14 billion agreement to purchase Juniper Networks, with closure pending regulatory review.


Global Managed Switch Market Report Scope
The Managed Switch Market encompasses Ethernet switches that provide comprehensive network oversight, configuration, and monitoring. With features like VLANs and QoS, these switches empower administrators to manage traffic, bolster security, and guarantee network reliability. Predominantly utilized in enterprise, industrial, and data center networks, their market expansion is propelled by the surging demand for scalable, secure, and high-performance networking solutions.
The Managed Switch Market Report is Segmented by Managed Capability (Managed [Enterprise-grade], and Smart/Light Managed [SMB/edge]), Port Speed (Fast Ethernet [≤100 Mb/s], Gigabit Ethernet [1 Gb/s], 10 Gigabit Ethernet, 25/40 Gigabit Ethernet, and ≥100 Gigabit Ethernet), Management Architecture (On-device [CLI/Web], Cloud-managed, and Hybrid), End User Industry (IT and Telecom, BFSI, Manufacturing, Healthcare, Education, Government and Defense, Energy and Utilities, and Other Industries), and Geography (North America, South America, Europe, Asia-Pacific, Middle East, and Africa). The Market Forecasts are Provided in Terms of Value (USD).
| Managed (Enterprise-grade) |
| Smart/Light Managed (SMB/edge) |
| Fast Ethernet (≤100 Mb/s) |
| Gigabit Ethernet (1 Gb/s) |
| 10 Gigabit Ethernet |
| 25/40 Gigabit Ethernet |
| ≥100 Gigabit Ethernet |
| On-device (CLI/Web) |
| Cloud-managed |
| Hybrid |
| IT and Telecom |
| BFSI |
| Manufacturing |
| Healthcare |
| Education |
| Government and Defense |
| Energy and Utilities |
| Other End User Industries |
| North America | United States |
| Canada | |
| Mexico | |
| South America | Brazil |
| Argentina | |
| Rest of South America | |
| Europe | Germany |
| United Kingdom | |
| France | |
| Italy | |
| Spain | |
| Russia | |
| Rest of Europe | |
| Asia-Pacific | China |
| Japan | |
| India | |
| South Korea | |
| Australia and New Zealand | |
| Rest of Asia-Pacific | |
| Middle East | Saudi Arabia |
| United Arab Emirates | |
| Turkey | |
| Rest of Middle East | |
| Africa | South Africa |
| Nigeria | |
| Rest of Africa |
| By Managed Capability | Managed (Enterprise-grade) | |
| Smart/Light Managed (SMB/edge) | ||
| By Port Speed | Fast Ethernet (≤100 Mb/s) | |
| Gigabit Ethernet (1 Gb/s) | ||
| 10 Gigabit Ethernet | ||
| 25/40 Gigabit Ethernet | ||
| ≥100 Gigabit Ethernet | ||
| By Management Architecture | On-device (CLI/Web) | |
| Cloud-managed | ||
| Hybrid | ||
| By End User Industry | IT and Telecom | |
| BFSI | ||
| Manufacturing | ||
| Healthcare | ||
| Education | ||
| Government and Defense | ||
| Energy and Utilities | ||
| Other End User Industries | ||
| By Geography | North America | United States |
| Canada | ||
| Mexico | ||
| South America | Brazil | |
| Argentina | ||
| Rest of South America | ||
| Europe | Germany | |
| United Kingdom | ||
| France | ||
| Italy | ||
| Spain | ||
| Russia | ||
| Rest of Europe | ||
| Asia-Pacific | China | |
| Japan | ||
| India | ||
| South Korea | ||
| Australia and New Zealand | ||
| Rest of Asia-Pacific | ||
| Middle East | Saudi Arabia | |
| United Arab Emirates | ||
| Turkey | ||
| Rest of Middle East | ||
| Africa | South Africa | |
| Nigeria | ||
| Rest of Africa | ||


Key Questions Answered in the Report
What is the current managed switch market size and its expected value by 2031?
The managed switch market size stands at USD 18.5 billion in 2026 and is projected to reach USD 27.5 billion by 2031.
Which segment is growing the fastest within managed switches?
Switches rated at 100 GbE and higher are forecast to record the highest 9.51% CAGR between 2026-2031.
Why is Asia-Pacific leading demand for managed switches?
Asia-Pacific benefits from a 19.4 GW data-center pipeline and large-scale broadband programs such as BharatNet Phase 3, which together drive rapid port deployment.
What supply-chain risks affect switch availability?
Dependence on Broadcom ASICs and tight 3-nm wafer capacity can stretch lead times beyond 52 weeks, pressuring smaller vendors without guaranteed allocations.
Which industries outside IT are adopting managed switches fastest?
Healthcare is outpacing others, expanding at an 8.45% CAGR as hospitals standardize on PoE networks for connected medical devices.
Page last updated on:


