Router And Switch Market Size and Share
Market Overview
| Study Period | 2019 - 2030 |
|---|---|
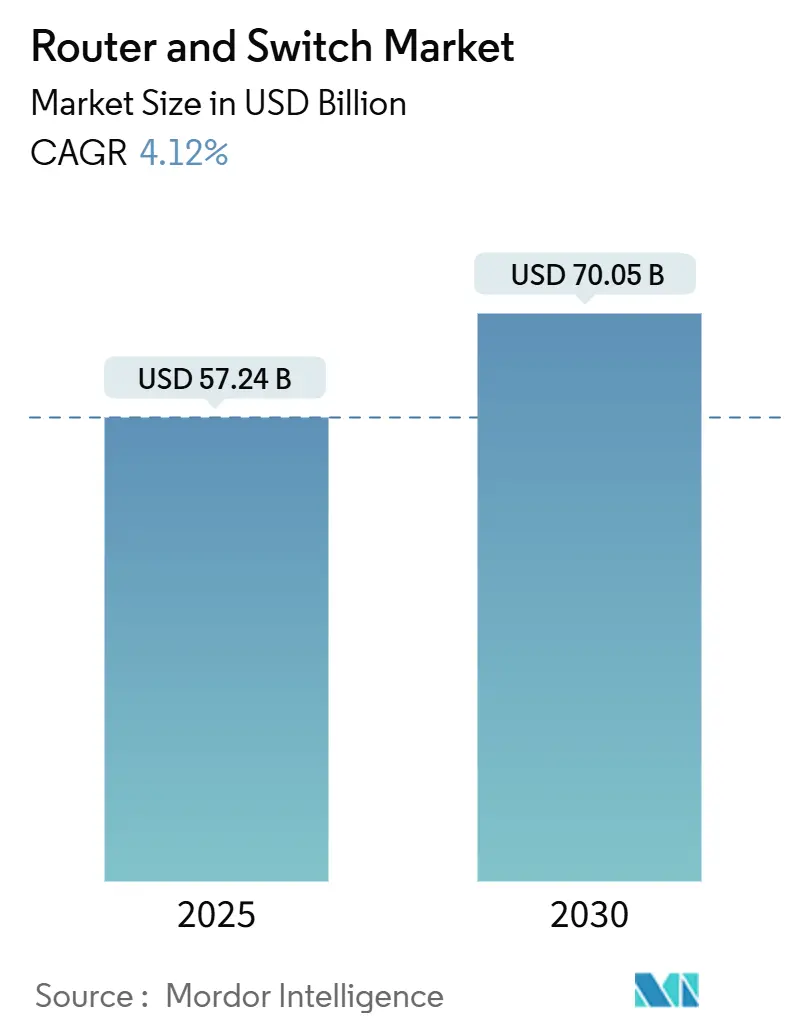
| Market Size (2025) | USD 57.24 Billion |
| Market Size (2030) | USD 70.05 Billion |
| Growth Rate (2025 - 2030) | 4.12% CAGR |
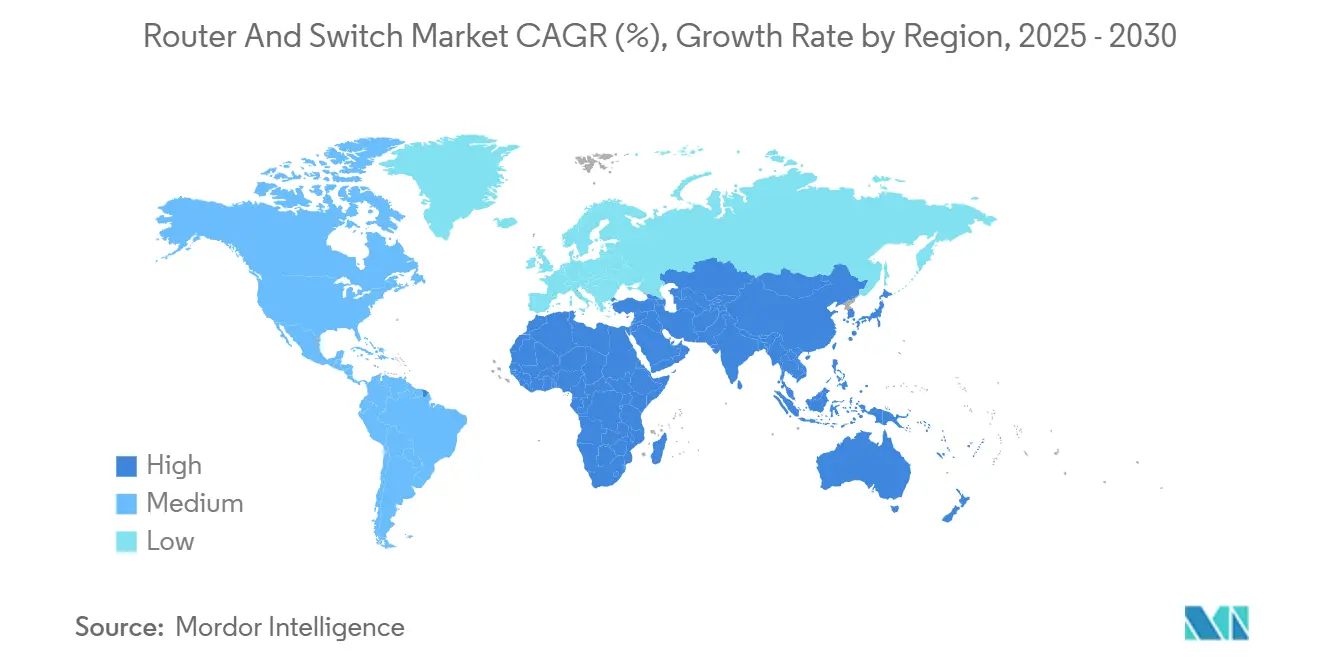
| Fastest Growing Market | Middle East and Africa |
| Largest Market | Asia Pacific |
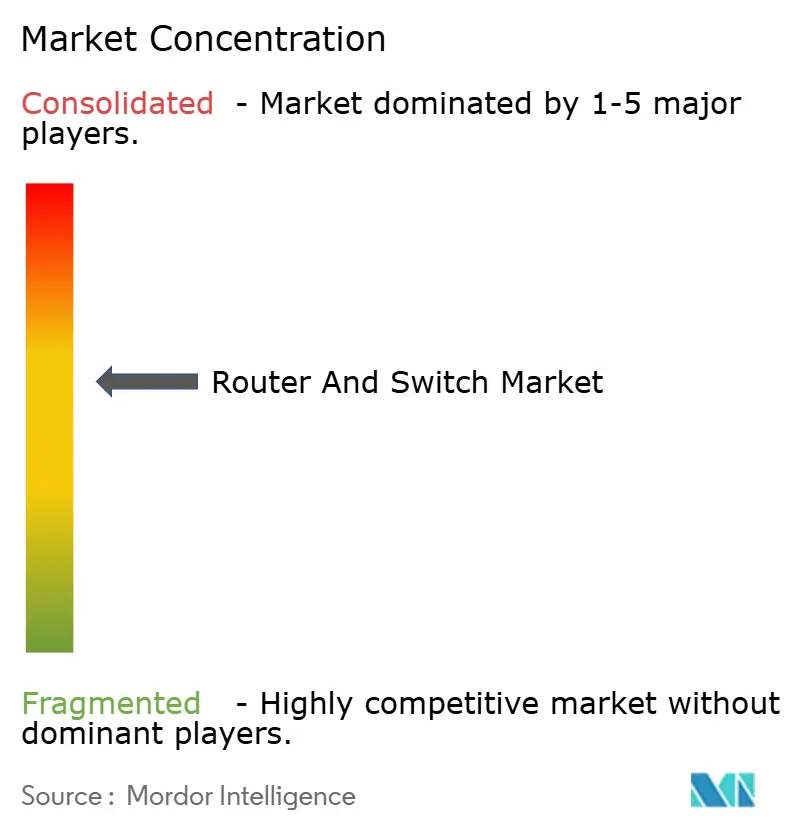
| Market Concentration | Medium |
Major Players *Disclaimer: Major Players sorted in no particular order Image © Mordor Intelligence. Reuse requires attribution under CC BY 4.0. | |
Router And Switch Market Analysis by Mordor Intelligence
The router and switch market size reached USD 55.2 billion in 2024 and is projected to climb to USD 70.05 billion by 2030, advancing at a 4.12% CAGR through the forecast period. Moderate topline growth stems from post-pandemic inventory normalization, giving way to steady infrastructure modernization, with artificial intelligence workloads and cloud-first operating models dictating new capacity requirements. Demand for 400G and 800G platforms is accelerating, yet 100 Gbps solutions remain the prevailing choice for enterprises and carriers balancing price and performance. Environmental regulations in major economies are pushing network operators toward energy-efficient silicon, while open networking initiatives reduce vendor lock-in and reshape competitive positioning across the router and switch market. Regional momentum is strongest in Asia-Pacific, where hyperscale expansions, semiconductor ecosystems, and 5G rollouts converge, although the Middle East and Africa offer the fastest growth runway under large-scale digital-economy programs.
Key Report Takeaways
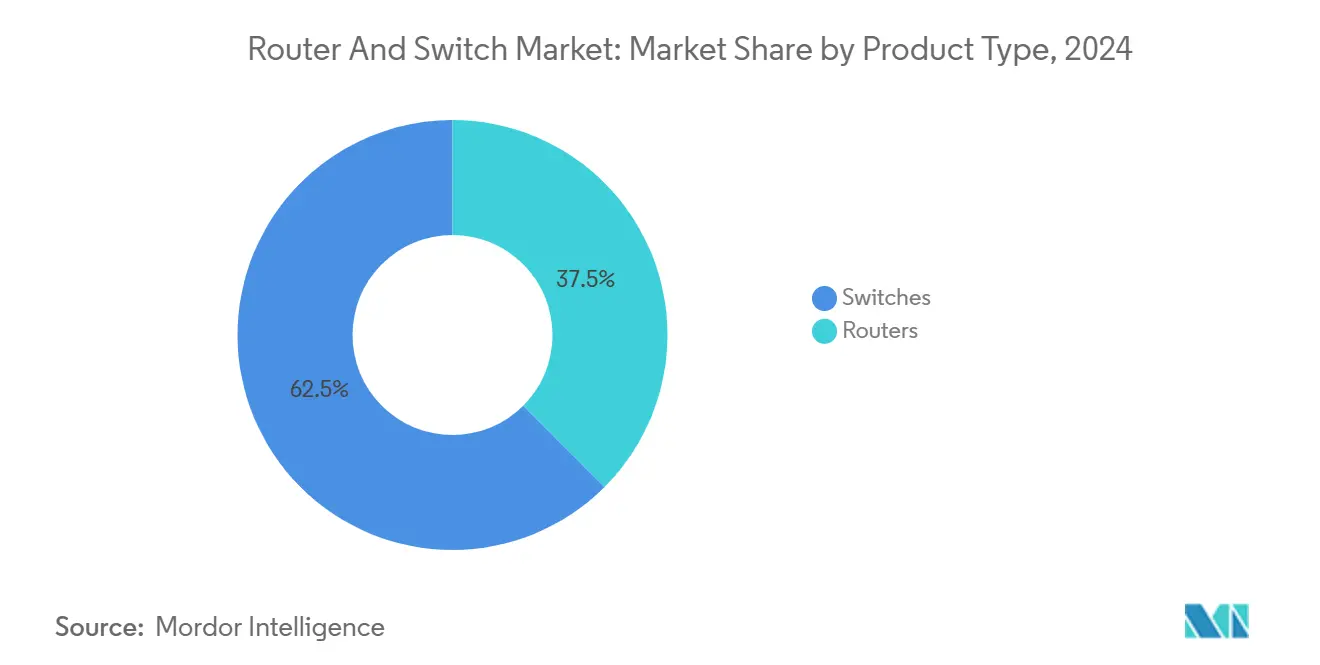
- By product type, switches captured 62% of the router and switch market share in 2024, whereas disaggregated routers are poised for the quickest 4.18% CAGR through 2030.
- By end user, service providers held 38% of the router and switch market size in 2024; hyperscale data centers are projected to expand at a 4.13% CAGR to 2030.
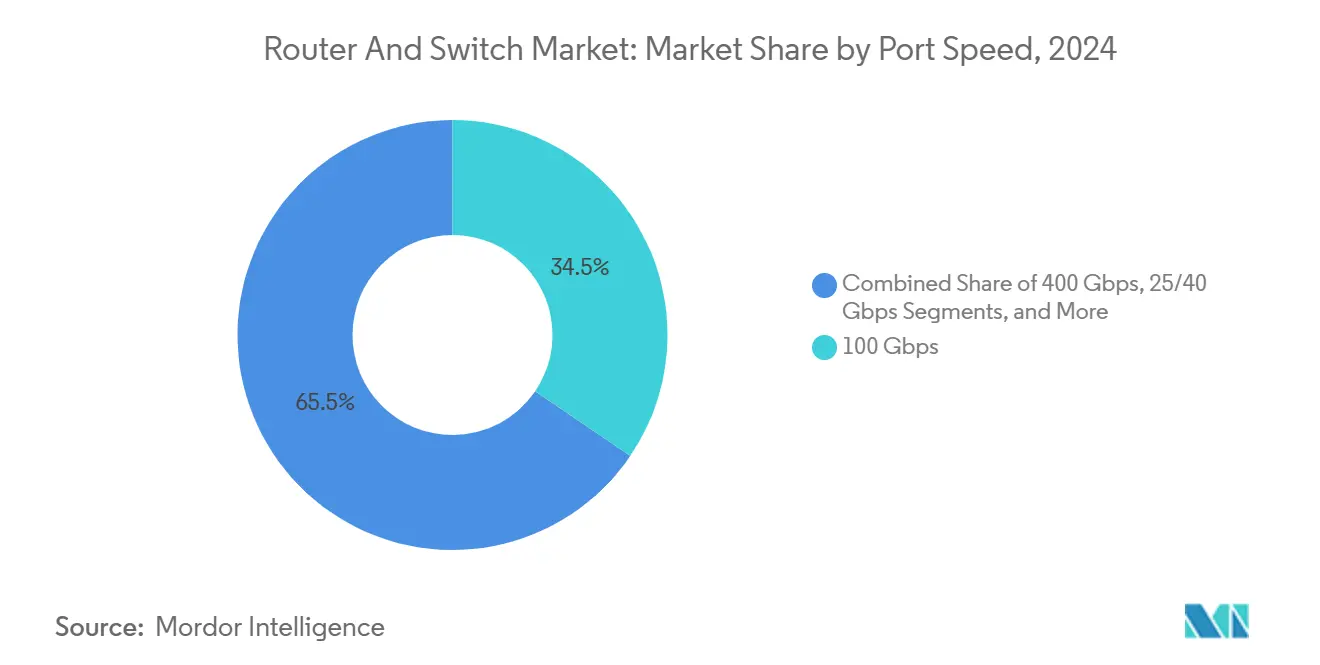
- By port speed, 100 Gbps accounted for 34.5% of the router and switch market size in 2024, while 800 Gbps and above is forecast to match the overall 4.12% CAGR.
- By geography, Asia-Pacific led with 32% router and switch market share in 2024, and the Middle East and Africa region is advancing at a 4.01% CAGR through 2030.
Global Router And Switch Market Trends and Insights
Drivers Impact Analysis*
| Driver | % Impact on CAGR Forecast | Geographic Relevance | Impact Timeline |
|---|---|---|---|
| Cloud-first WAN modernisation & SD-WAN adoption boom | +0.8% | Global, with concentration in North America & Europe | Medium term (2–4 years) |
| Hyperscale demand for 400G/800G & silicon-photonics switches | +1.2% | APAC core, spill-over to North America | Medium term (2–4 years) |
| Energy-efficiency mandates for network equipment | +0.3% | Europe & North America, expanding to APAC | Long term (≥ 4 years) |
| Geopolitical vendor bans reshaping supplier mix | +0.4% | North America, Europe, selective APAC markets | Short term (≤ 2 years) |
| AI/ML workloads requiring lossless, low-latency fabrics | +1.0% | Global, led by hyperscale regions | Medium term (2–4 years) |
| Open-source NOS & network disaggregation economics | +0.5% | Global, with early adoption in cloud-native environments | Long term (≥ 4 years) |
| Source: Mordor Intelligence | |||
Cloud-First WAN Modernisation and SD-WAN Adoption Boom
Enterprise transformation accelerated in 2024 as organizations migrated to software-defined wide-area architectures that support hybrid workforces and cloud-native applications. Cisco’s 2024 networking survey reveals that 56% of enterprises plan to upgrade their Ethernet backbones within two years to meet the demands of AI traffic.[1]Source: Cisco Systems, “Cisco Data Center Networking Blueprint for AI/ML Applications,” cisco.com Security remains the chief concern for 40% of IT leaders, channeling spending toward SD-WAN platforms with built-in zero-trust functionality. Because SD-WAN decouples control and transport, intelligent edge routers capable of automated policy enforcement are seeing renewed interest across the router and switch market. Vendors are embedding telemetry and analytics to enable real-time optimization, while channel partners pivot toward managed-service offerings that monetize operational complexity. The shift away from hub-and-spoke design toward cloud-on-ramp topologies raises the baseline for port density and encryption throughput, thereby lifting average selling prices for next-generation routing platforms.
Hyperscale Demand for 400G/800G and Silicon-Photonics Switches
Artificial intelligence infrastructure scales rapidly, with GPU clusters linked by non-blocking fabrics that now demand 400G and 800G throughput at the rack. Silicon photonics advances have pushed switch radix to 1.6 Tb/s per port, trimming power per bit by up to 70% according to Broadcom’s 51.2 Tbps co-packaged roadmap.[2]Source: Broadcom Inc., “Broadcom Delivers Industry’s First 51.2-Tbps Co-Packaged Optics Ethernet Switch Platform,” broadcom.com Asia-Pacific hyperscalers anchor early deployments, but North American cloud majors are finalizing 800G production runs for fiscal 2025 expansions. While capital outlays remain high, operators project lifecycle TCO savings from consolidated cabling and lower cooling loads, propelling adoption across the router and switch market. Component miniaturization enables higher faceplate density, forcing new thermal management designs that emphasize liquid cooling and chassis-level airflow modeling.
Energy-Efficiency Mandates for Network Equipment
The European Energy Efficiency Directive now compels data centers above 100 kW to publish annual energy metrics, and several U.S. states are drafting carbon-reduction penalties for high-density campuses.[3]Source: California Energy Commission, “Enabling Energy Efficient Data Center in Smart Power Distribution Systems,” energy.ca.gov These regulations elevate power management to a procurement criterion, prompting OEMs to integrate dynamic voltage-frequency scaling, advanced sleep modes, and granular telemetry into product roadmaps. California’s energy commission estimates that smarter power states could save 1,342 GWh each year, equal to USD 163 million in operating costs. Network architects increasingly evaluate performance per watt, favoring ASICs fabricated at 3 nm that deliver double-digit efficiency gains. Long-term carbon-pricing scenarios add financial urgency, positioning green silicon as a revenue driver for the router and switch market.
AI/ML Workloads Requiring Lossless, Low-Latency Fabrics
Deep-learning clusters depend on microsecond latency and congestion-free transport to maximize GPU utilization. Ethernet fabrics augmented with Priority Flow Control and Explicit Congestion Notification now rival InfiniBand on efficiency, according to Juniper’s AI-networking analysis.[4]Source: Juniper Networks, “Networking the AI Data Center,” juniper.net Consortium-led enhancements under the Ultra Ethernet banner seek to codify deterministic behaviors, catalyzing refresh cycles among hyperscale buyers. Cisco’s Nexus 9000 incorporates adaptive routing algorithms that maintain nanosecond jitter across thousands of endpoints, underscoring how AI requirements are redefining switch silicon. Demand for specialized buffer architectures and precise timestamping is spurring niche entrants, yet incumbent vendors hold advantage through mature firmware stacks that integrate with orchestration suites. This workload-driven re-architecture underpins sustained premium margins in the router and switch market.
Restraints Impact Analysis*
| Restraint | ( ) % Impact on CAGR Forecast | Geographic Relevance | Impact Timeline |
|---|---|---|---|
| Post-COVID enterprise capex digestion & switch inventory glut | -0.6% | Global, particularly North America & Europe | Short term (≤ 2 years) |
| Supply-chain chip shortages for high-end ASICs | -0.4% | Global, with acute impact on advanced silicon | Medium term (2-4 years) |
| Regulatory restrictions on Chinese OEMs limiting addressable demand | -0.3% | North America, Europe, selective APAC markets | Medium term (2-4 years) |
| Rising power-density cooling limits in legacy edge sites | -0.2% | Global, concentrated in older data center facilities | Long term (≥ 4 years) |
| Source: Mordor Intelligence | |||
Post-pandemic Enterprise Capex Digestion and Switch Inventory Glut
Organizations expanded network capacity rapidly during pandemic lockdowns, leaving many with abundant spare ports and extended depreciation horizons. Gartner projects 7.9% overall IT spend growth for 2025, yet hardware allocations trail as CIOs manage existing assets. Pricing volatility and elongated delivery times have seen procurement teams build buffer inventories, now deemed sufficient for near-term needs. Consequently, quarterly run-rates for mid-range campus switches are soft, pressuring vendors to bundle software subscriptions and deferred payment arrangements. This pause is temporary, however, as AI adoption and Wi-Fi 7 migration will eventually exhaust aged 10G and 40G uplinks, re-invigorating the router and switch market.
Supply-Chain Chip Shortages for High-End ASICs
High-performance routing silicon manufactured at sub-5 nm remains supply-constrained, following capacity bottlenecks at leading foundries. National security export controls have restricted some Chinese OEMs from premier nodes, while Western vendors face allocation limits that stretch lead times beyond six months. The CHIPS for America program earmarks more than USD 50 billion for domestic fabrication; yet practical impact will lag until late 2027, prolonging tightness for 800G switch merchant silicon. Longer planning cycles force operators to pre-order, tying capital early and complicating quarter-on-quarter forecast visibility across the router and switch market.
*Our forecasts treat driver/restraint impacts as directional, not additive. The impact forecasts reflect baseline growth, mix effects, and variable interactions.
Segment Analysis
By Product Type: Switch Dominance and Router Disaggregation
Switches retained 62.5% router and switch market share in 2024, reflecting their pivotal role in spine-leaf and top-of-rack architectures that enable east-west traffic flows for microservice workloads. The segment benefits from programmable pipelines and real-time telemetry that mesh with software-defined orchestration frameworks. Platforms leveraging co-packaged optics now double faceplate bandwidth without enlarging chassis footprints. Disaggregated routers are the fastest-growing category, expanding at a 4.18% CAGR as open-source NOS adoption gains traction among cloud majors. Microsoft’s SONiC establishes a multi-vendor control layer, encouraging white-box hardware that lowers the total cost of ownership. Service-provider core refreshes, driven by 5G backhaul and converged IP transport, also favor merchant-silicon routers that separate software innovation cycles from hardware lifecycles. Vendors are responding with unified operating systems that blur legacy product boundaries, signaling an era of converged Layer 2-3 forwarding engines throughout the router and switch market.
Continued modularization invites ecosystem partners to deliver specialized microservices such as deep packet inspection or advanced NAT directly on switch ports, shortening service-creation intervals for carriers. While incumbent router suppliers leverage embedded security and MPLS feature depth to defend share, they increasingly ship hardware-agnostic parcels of code to remain relevant. The motion toward consumption-based licenses supplies recurring revenue streams that partially offset lower unit gross margins. Those dynamics collectively affirm that hardware differentiation alone no longer secures lasting advantage in the router and switch market; integration with DevOps-centric toolchains and cloud interface APIs now frames competitive moats.


By End User: Hyperscale Momentum Outpaces Carrier Scale
Service providers controlled 38.5% of the router and switch market size in 2024 as fiber densification, 5G core upgrades, and cable-network node splits sustained spending. Reliability requirements and multidecade vendor relationships reinforce incumbent positioning, yet procurement criteria increasingly stress open-standards compliance to avoid geopolitical trade restrictions. Hyperscale data centers, though accounting for a smaller base, will compound at 4.13% CAGR through 2030 as AI backbone scale surpasses historical peaks. Meta’s adoption of Ethernet-based AI fabrics underscores the pivot away from proprietary interconnects toward high-speed Ethernet that aligns with optical-transport roadmaps. Enterprises and SMB/SOHO segments maintain steady refresh cycles devoted to Wi-Fi 7 access, zero-trust gateways, and edge compute adjacency; however, their incremental growth is eclipsed by the capital intensity of cloud majors.
Managed-service providers bridge enterprise skill gaps by offering network-as-a-service bundles that combine SD-WAN, SASE, and performance analytics, redirecting value capture from hardware margins to monthly recurring revenue. Hyperscalers influence component roadmaps by co-designing optics and silicon, subsequently driving economies of scale that trickle down to carrier and enterprise buyers. This cascading effect accelerates technology diffusion, ensuring that features once reserved for mega-data centers, such as in-band telemetry and line-rate MAC-sec, soon become baseline expectations across the router and switch market.
By Port Speed: 100 Gbps Relevance Amid 800 Gbps Transition
The 100 Gbps tier represented 34.5% of the router and switch market size in 2024, favored for its attractive cost-per-bit ratio and mature optical ecosystem. Enterprises standardize on 4×25G breakout to servers, while carriers deploy 100 Gbps in aggregation layers to aggregate massive PON and small-cell backhaul traffic. Price erosion of single-lambda 100G optics continues, extending the tier’s shelf life until at least 2028. In parallel, 400 Gbps shipments are scaling through QSFP-DD optics, providing a runway toward 800 Gbps and subsequent 1.6T adoption. The 800 Gbps segment, though embryonic, is forecast to grow in lockstep with overall demand at a 4.12% CAGR as hyperscalers qualify 200G/lane DSP technology.
Ciena’s WaveLogic 6 Extreme demonstrates 1.6 Tb/s coherent performance, offering operators twice the channel capacity at near-linear power increase, making greenfield adoption feasible in submarine and metro segments. Co-packaged optics lower link-budget penalties and ease thermal constraints, yet field maintainability challenges slow broader acceptance. Interoperability testing within the Ultra Ethernet Consortium aims to certify multi-vendor 800G deployments, a prerequisite for mass rollout across the router and switch market. Legacy 10G and 40G port shipments are declining in double digits, yet remain entrenched in cost-sensitive access networks, indicating a prolonged coexistence period where multispeed backplanes and gearboxes remain essential.

Geography Analysis
Asia-Pacific led the router and switch market with a 32% revenue share in 2024. National digital-infrastructure programs in China, Japan, and South Korea, coupled with greenfield hyperscale campuses in Indonesia, Malaysia, and India, underpin sustained demand. Government incentives for semiconductor fabs bolster a regional supply chain that shortens lead times and reduces currency exposure for local buyers. Aggressive 5G rollouts accelerate transport upgrades to converged IP-optical cores, while campus digitalization initiatives in manufacturing hubs sustain enterprise switch volumes. The region’s burgeoning AI-startup ecosystem further stimulates purchases of 400G leaf-spine fabrics and lossless Ethernet clusters destined for computer-vision training workloads.
North America held 29.3% share and remains the second-largest contributor. Hyperscalers allocate multi-billion-dollar budgets to GPU superclusters, propelling 800G order books for early 2026 deliveries. Federal incentives under the CHIPS for America Act encourage on-shoring of advanced node fabs, promising long-term supply resilience. Concurrently, state-level energy-efficiency standards heighten interest in low-power merchant silicon, reinforcing a refresh cycle favoring 3 nm ASICs. Enterprise adoption of SaaS tools accelerates SD-WAN and SASE deployments, moving spend from core routers to edge devices that combine security and networking functions, yet overall bandwidth growth remains robust.
The Middle East and Africa represent the fastest rising region with a 4.01% CAGR outlook. National Vision 2030 agendas in Saudi Arabia and the United Arab Emirates promote hyperscale investments and smart-city applications that demand converged IP-fabric backbones. Telecom operators across the Gulf Cooperation Council target 40% 5G traffic share by end-2024, triggering core-routing refreshes toward segment-routing IPv6. Sub-Saharan Africa sees submarine-cable landings drive regional data-center builds, creating greenfield opportunities absent legacy encumbrances. Europe continues its steady evolution, with regulatory carbon caps steering the market toward lower-wattage switch silicon and granular energy-reporting features. South America’s focus on fiber-to-the-home and fintech digitization sustains incremental router and switch market growth, though currency volatility tempers capital-expenditure visibility for regional carriers.

Competitive Landscape
Market leadership remains moderately concentrated. Cisco leverages its broad catalog and installed-base loyalty, sustaining double-digit operating margins despite heightened price competition. Arista Networks focuses on cloud and AI fabrics, growing revenue to USD 7 billion in 2024 on the back of 400G leaf-spine wins that displaced incumbents in brownfield data centers. Hewlett Packard Enterprise’s July 2025 completion of Juniper Networks acquisition doubles its networking revenue stream, furnishing an AI-focused portfolio that directly challenges Cisco’s Nexus and Arista’s R-series lines.
Silicon vendors such as Broadcom and NVIDIA vertically integrate, marketing complete switch systems alongside merchant silicon to capture more of the value chain. Broadcom’s Tomahawk 6 achieved 102.4 Tb/s throughput in 2025, introducing co-packaged optics to mass-market Ethernet while preserving standards compliance. NVIDIA’s Spectrum-X Photonics line bypasses electrical retimers, reducing power by 30% and grabbing prominent design wins in GPU-rich clusters. Arrcus, with USD 30 million in new funding, advances a microservices-based NOS that scales from edge to core, attracting carriers intent on escaping monolithic software stacks.
Open-standards momentum under the Ultra Ethernet Consortium threatens proprietary fabrics, encouraging interoperability as a key purchase criterion. Established vendors counter with value-added telemetry and AI-assisted troubleshooting that shorten mean-time-to-repair, features hard to replicate in pure white-box environments. The competitive battleground has thus shifted from hardware speeds and feeds to software integration and lifecycle automation, reinforcing the conclusion that sustained differentiation in the router and switch market now hinges on cloud-native control-plane innovation and ecosystem partnerships rather than pure port-density supremacy.
Router And Switch Industry Leaders
Cisco Systems, Inc.
Huawei Technologies Co., Ltd.
Juniper Networks, Inc.
Hewlett Packard Enterprise Company
Arista Networks, Inc.
- *Disclaimer: Major Players sorted in no particular order

Recent Industry Developments
- July 2025: Hewlett Packard Enterprise finalized its USD 14 billion acquisition of Juniper Networks, adding AI-centric routing and switching to its portfolio.
- June 2025: Broadcom introduced Tomahawk 6 switches providing 102.4 Tb/s bandwidth, positioning Ethernet as a scalable AI interconnect.
- March 2025: NVIDIA launched Spectrum-X Photonics switches delivering 1.6 Tb/s per port using silicon photonics to support exascale GPU clusters.


Global Router And Switch Market Report Scope
| Routers |
| Switches |
| Service Providers |
| Hyperscale / Cloud Data Centres |
| Enterprises |
| SMB / SOHO |
| less than or equal to 10 Gbps |
| 25/40 Gbps |
| 100 Gbps |
| 400 Gbps |
| 800 Gbps and Above |
| North America | United States | |
| Canada | ||
| Mexico | ||
| South America | Brazil | |
| Argentina | ||
| Rest of South America | ||
| Europe | Germany | |
| France | ||
| United Kingdom | ||
| Rest of Europe | ||
| Asia Pacific | China | |
| Japan | ||
| South Korea | ||
| India | ||
| Taiwan | ||
| Rest of Asia Pacific | ||
| Middle East and Africa | Middle East | Saudi Arabia |
| United Arab Emirates | ||
| Turkey | ||
| Rest of Middle East | ||
| Africa | South Africa | |
| Egypt | ||
| Rest of Africa | ||
| By Product Type | Routers | ||
| Switches | |||
| By End User | Service Providers | ||
| Hyperscale / Cloud Data Centres | |||
| Enterprises | |||
| SMB / SOHO | |||
| By Port Speed | less than or equal to 10 Gbps | ||
| 25/40 Gbps | |||
| 100 Gbps | |||
| 400 Gbps | |||
| 800 Gbps and Above | |||
| By Geography | North America | United States | |
| Canada | |||
| Mexico | |||
| South America | Brazil | ||
| Argentina | |||
| Rest of South America | |||
| Europe | Germany | ||
| France | |||
| United Kingdom | |||
| Rest of Europe | |||
| Asia Pacific | China | ||
| Japan | |||
| South Korea | |||
| India | |||
| Taiwan | |||
| Rest of Asia Pacific | |||
| Middle East and Africa | Middle East | Saudi Arabia | |
| United Arab Emirates | |||
| Turkey | |||
| Rest of Middle East | |||
| Africa | South Africa | ||
| Egypt | |||
| Rest of Africa | |||


Key Questions Answered in the Report
How large is the router and switch market in 2025?
The router and switch market size is forecast at USD 57.24 billion in 2025, up from USD 55.2 billion in 2024.
Which product category leads revenue?
Switch platforms dominate with 62.5% router and switch market share in 2024 thanks to spine-leaf data-center adoption.
What segment is growing fastest?
Disaggregated routers show the highest 4.18% CAGR through 2030, propelled by open-networking deployments.
Which region offers the quickest growth?
The Middle East and Africa region is projected to expand at 4.01% CAGR on the back of large-scale telecom modernization.
Page last updated on:


